Uncategorized
XRP Breaks $2.80 as Bearish September Begins, Oversold Signals Suggest Recovery Ahead
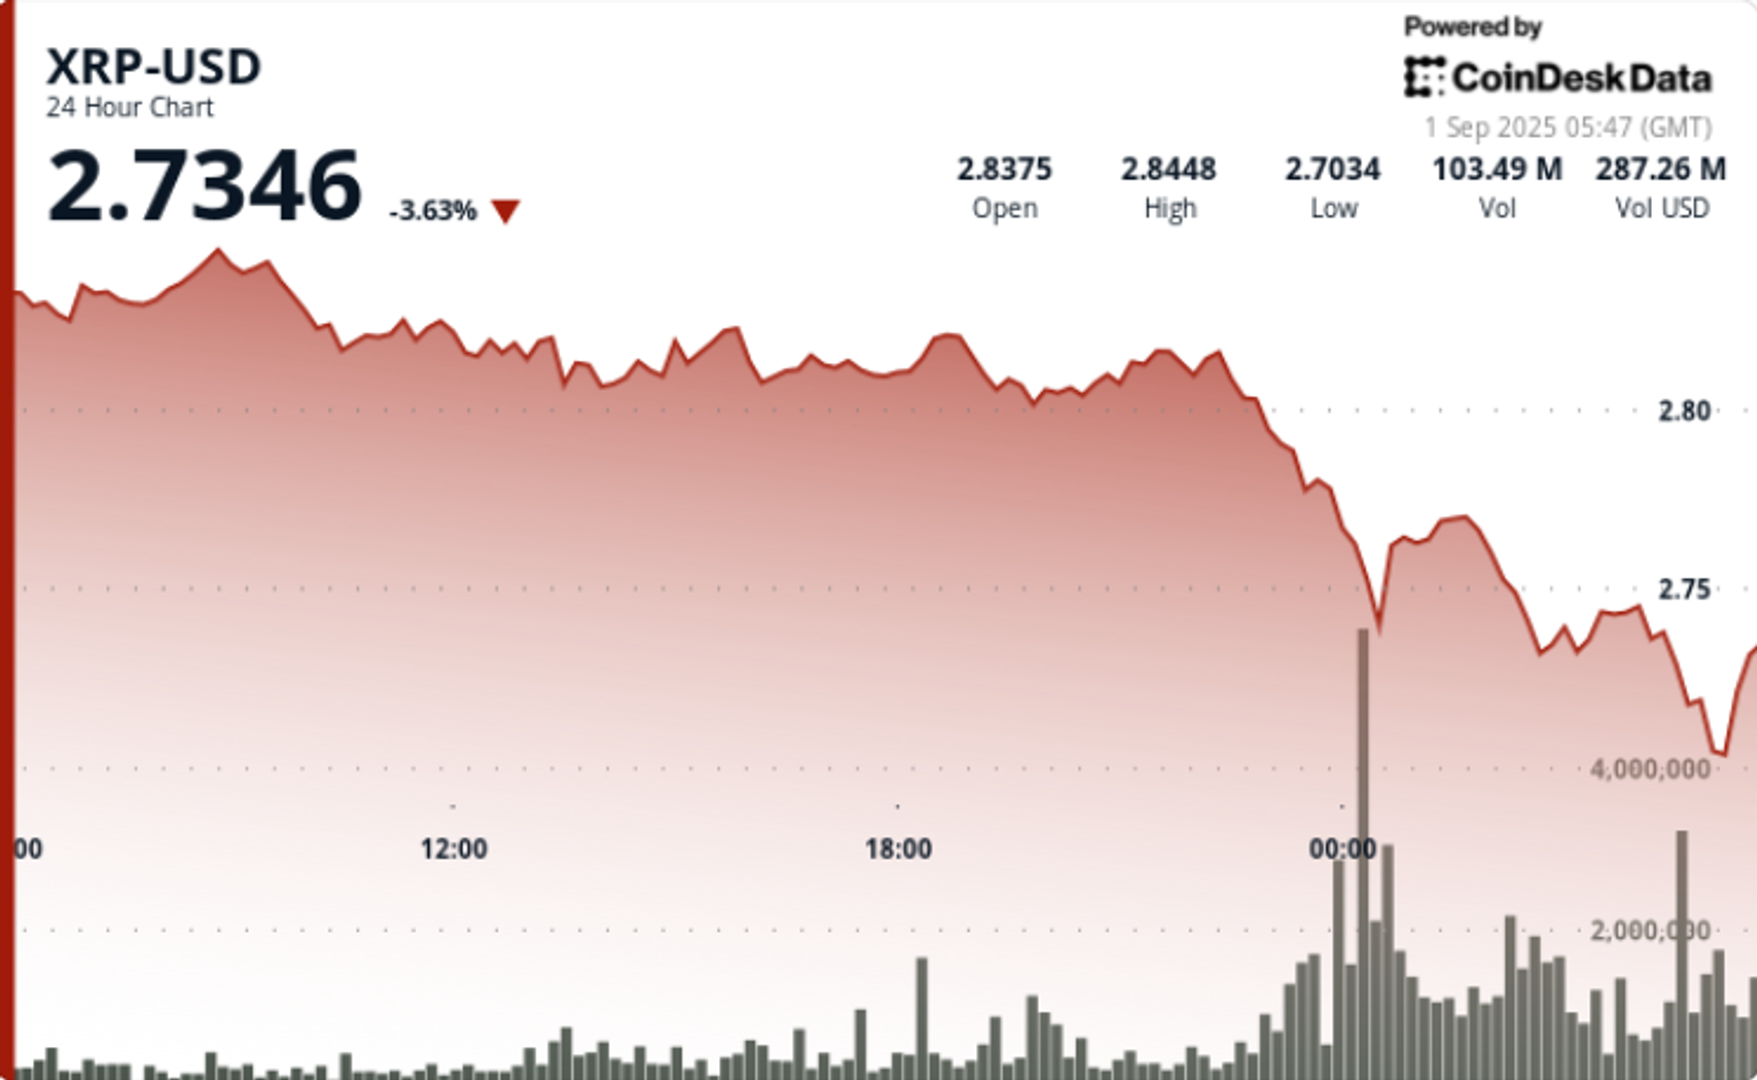
News Background
- XRP declined 4% from $2.85 to $2.75 in the 24-hour session ending Sept. 1 at 02:00, moving across a $0.12 (4%) range.
- Market turbulence was amplified by institutional liquidation flows totaling $1.9B since July, prompting fears of cyclical exhaustion.
- In contrast, whales accumulated 340M XRP over the past two weeks, highlighting contradictory behavior between large holders and short-term liquidators.
- September seasonality and ongoing regulatory pressure in the U.S. add to caution: crypto markets have historically underperformed in September, while unresolved SEC actions keep institutions wary.
- On-chain data shows activity on the XRP Ledger trending higher, with symmetrical-triangle formations reminiscent of 2017 pre-breakout conditions. Liquidity maps suggest concentrations up to $4.00 that could amplify any upside move.
Price Action Summary
- The sharpest decline came at 23:00 GMT on Aug. 31, when XRP dropped from $2.80 to $2.77 on 76.87M volume, nearly triple the daily average of 27.3M.
- Support was tested again during the final hour (01:31–02:30 GMT, Sept. 1) as price fell from $2.77 to $2.75, with spikes of 10M+ tokens per minute confirming forced liquidations.
- Earlier in the day, XRP briefly touched $2.87 before retreating, as institutional selling capped rallies above $2.80.
Technical Analysis
- Support: $2.75–$2.77 remains the immediate base; below this, $2.50 and $2.00 are critical longer-term levels.
- Resistance: Heavy rejection at $2.80–$2.87 marks the ceiling for now; $3.30 is the higher-term breakout line.
- Momentum: RSI dipped into the mid-40s before stabilizing, suggesting oversold conditions.
- MACD: Bearish divergence persists but histogram compression points to potential crossover if accumulation continues.
- Patterns: Symmetrical triangle + double-bottom formations align with long-term cup-and-handle structure. Analysts flag upside potential to $5–$13 if resistance breaks and liquidity pockets above $4.00 are tapped.
- Volume: The 76.87M spike during the $2.80 breakdown confirms distribution, but whale absorption of 340M tokens in the background supports the case for accumulation.
What Traders Are Watching
- Can $2.75 hold as the new floor into early September trading?
- A close above $2.87 would flip bias toward a run at $3.30.
- Divergence between institutional selling ($1.9B since July) and whale accumulation (340M tokens in August) as a key market driver.
- Whether seasonal September weakness overrides bullish structural setups pointing to $5–$13.
Welcome back to TechCrunch Mobility, your hub for all things “future of transportation.”
Over the last two years, Nvidia has used its ballooning fortunes to invest in over 100 AI startups. Here are the giant semiconductor’s largest investments.
Cerca is a dating app that sets users up with mutual friends.

Elon Musk vs. the regulators
Nvidia’s AI empire: A look at its top startup investments
Dating app Cerca will show how Gen Z really dates at TechCrunch Disrupt 2025
-

 Business12 месяцев ago
3 Ways to make your business presentation more relatable
-
Fashion12 месяцев ago
According to Dior Couture, this taboo fashion accessory is back
-
Entertainment12 месяцев ago
10 Artists who retired from music and made a comeback
-
Entertainment12 месяцев ago
\’Better Call Saul\’ has been renewed for a fourth season
-
Entertainment12 месяцев ago
New Season 8 Walking Dead trailer flashes forward in time
-
Business12 месяцев ago
15 Habits that could be hurting your business relationships
-
Entertainment12 месяцев ago
Meet Superman\’s grandfather in new trailer for Krypton
-

 Uncategorized4 месяца ago
Robinhood Launches Micro Bitcoin, Solana and XRP Futures Contracts