Uncategorized
XLM Jumps 4.3% Amid Volatile Trading Session
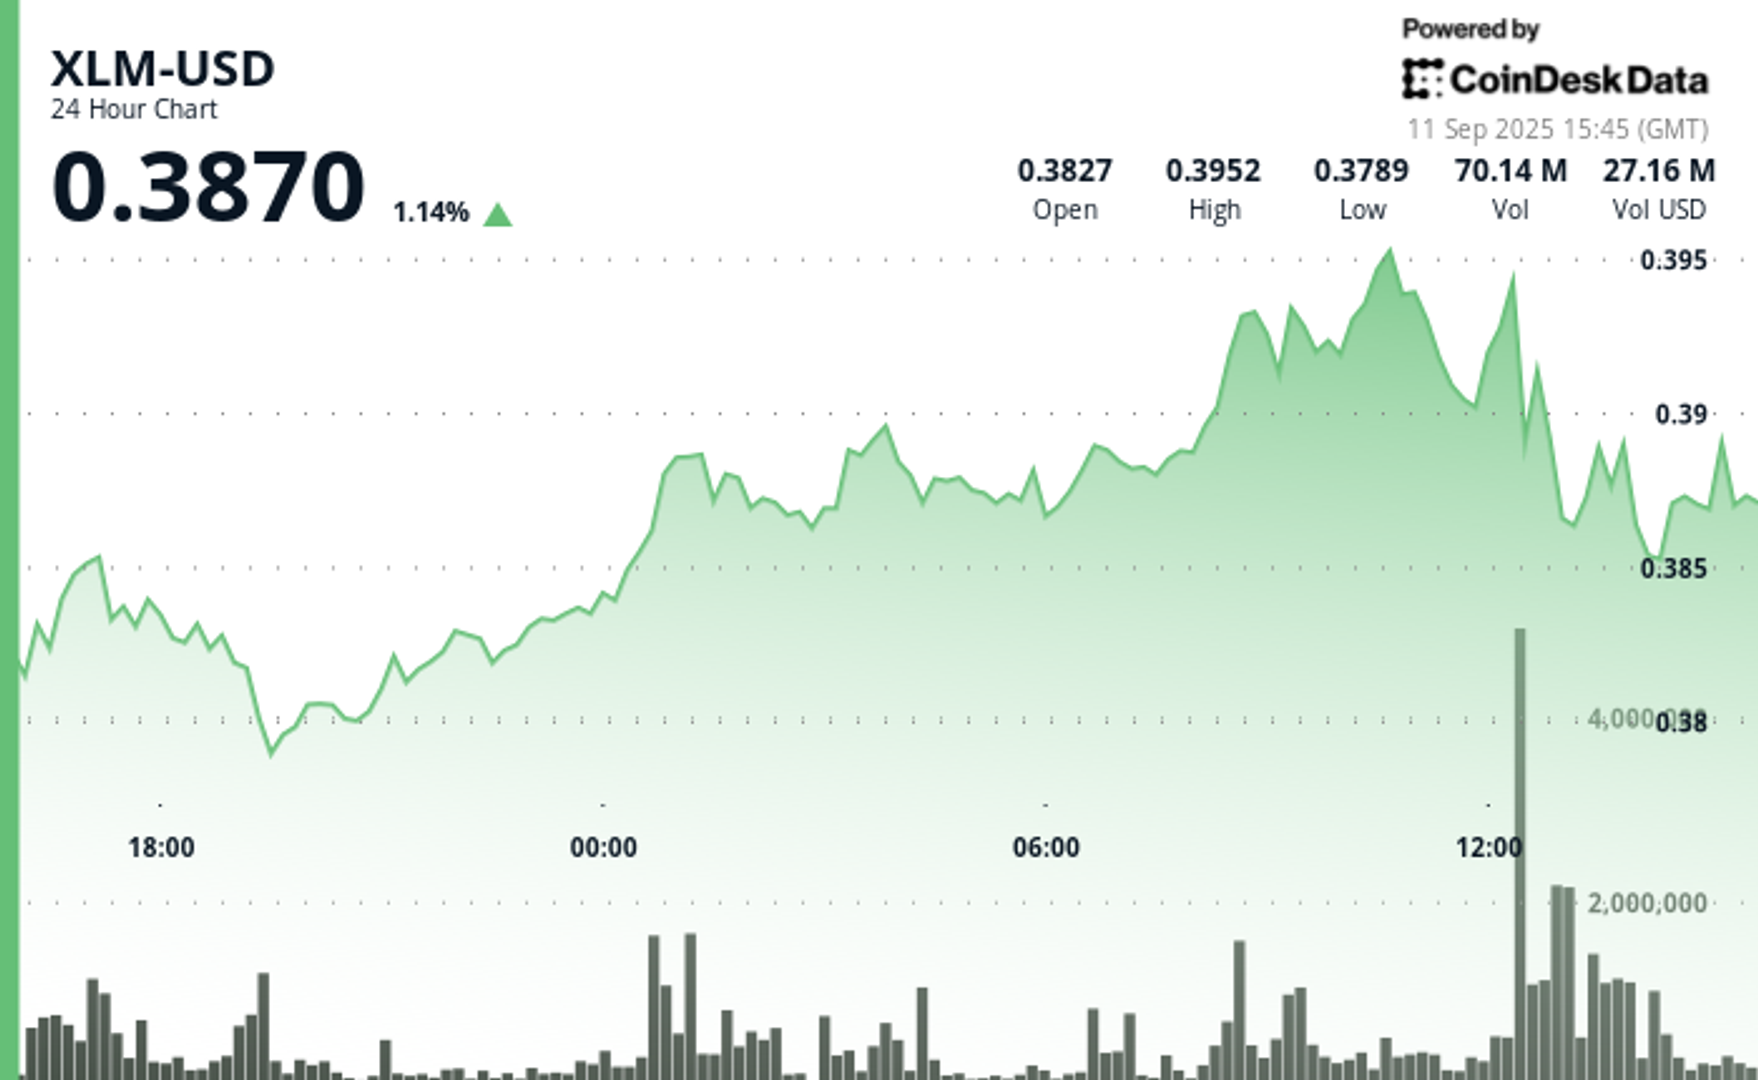
XLM posted sharp swings in the latest 24-hour trading cycle, oscillating within a $0.017 band that marked a 4.3% fluctuation between $0.379 and $0.396. The token’s rally took shape around midnight on September 11, when prices climbed from $0.384 to a high of $0.396 by mid-morning.
The upward push came alongside a surge in market activity, underscored by a 112 million unit spike in volume at noon — far above typical averages. Still, the momentum faltered, and XLM slipped back to $0.387, confirming firm resistance in the $0.394 to $0.396 zone.
The broader trading context highlighted the interplay between macro and micro forces. Market-wide institutional participation and broader crypto sentiment amplified volume, while technical ceilings limited sustained advances.
Traders saw buyers consistently absorbed at the $0.394-$0.396 range, while accumulation near $0.379-$0.381 underscored an emerging support base.
On a shorter horizon, XLM’s performance between 1:14 and 2:13 p.m. on September 11 captured the consolidation dynamic. The asset held to a tight $0.003 range, fluctuating between support at $0.386 and resistance at $0.389.
During this window, two short-lived bursts of bullish activity briefly pushed the price to $0.389 on strong volume, only to face immediate rejection. The repeated failures at this level reinforced the significance of $0.389 as a ceiling in line with the 24-hour trend.
Taken together, the pattern reflects a market still testing its boundaries. While high-volume surges showcase interest and participation, repeated rejection at resistance levels signals distribution pressure limiting upside potential. For traders, the technical story hinges on whether XLM can convert $0.389 into support, or whether continued selling will force another retest of the $0.379-$0.381 base.
")
Technical Indicators Breakdown
- Volume Analysis: Extraordinary 112.18 million volume surge dramatically exceeded standard 24-hour benchmarks, signaling institutional participation.
- Support Levels: Robust support establishment identified within $0.379-$0.381 range where accumulation interest previously developed.
- Resistance Zones: Definitive resistance confirmed at $0.394-$0.396 level featuring multiple rejection instances on amplified volume.
- Price Range: 4.30% volatility spectrum illustrates substantial intraday trading possibilities for engaged market participants.
- Breakout Pattern: Bullish breakout initiative from midnight session failed to maintain upward momentum beyond critical technical barriers.
Disclaimer: Parts of this article were generated with the assistance from AI tools and reviewed by our editorial team to ensure accuracy and adherence to our standards. For more information, see CoinDesk’s full AI Policy.
Welcome back to TechCrunch Mobility, your hub for all things “future of transportation.”
Over the last two years, Nvidia has used its ballooning fortunes to invest in over 100 AI startups. Here are the giant semiconductor’s largest investments.
Cerca is a dating app that sets users up with mutual friends.

Elon Musk vs. the regulators
Nvidia’s AI empire: A look at its top startup investments
Dating app Cerca will show how Gen Z really dates at TechCrunch Disrupt 2025
-

 Business12 месяцев ago
3 Ways to make your business presentation more relatable
-
Fashion12 месяцев ago
According to Dior Couture, this taboo fashion accessory is back
-
Entertainment12 месяцев ago
10 Artists who retired from music and made a comeback
-
Entertainment12 месяцев ago
\’Better Call Saul\’ has been renewed for a fourth season
-
Entertainment12 месяцев ago
New Season 8 Walking Dead trailer flashes forward in time
-
Business12 месяцев ago
15 Habits that could be hurting your business relationships
-
Entertainment12 месяцев ago
Meet Superman\’s grandfather in new trailer for Krypton
-
Entertainment12 месяцев ago
Disney\’s live-action Aladdin finally finds its stars