Uncategorized
Why ‘Expensive’ Ethereum Will Dominate Institutional DeFi

With over 100 layer-2 (L2) blockchains, you’re excused for thinking Ethereum is too expensive and too slow. But ask any institution preparing to settle a $500 million interest rate swap where they’ll build, and the answer is Ethereum. The reason reveals everything about how institutional DeFi is likely to develop.
The metrics that matter for institutional adoption are entirely different to retail. While retail users flee Ethereum’s transaction fees for cheaper chains, institutions will gladly pay that premium for security when moving hundreds of millions. The premium that people are willing to pay for a safe infrastructure is not an issue. Ethereum’s “weaknesses” are actually its institutional moat.
A tale of two markets
Examining the numbers, the difference in perspective between retail and institutional investors makes sense. If you are buying a memecoin for $50, you don’t want to pay $10 in transaction fees. But when it comes to settling a $500 million interest rate swap, shelling out $10 to ensure a secure transaction is a small price for that peace of mind.
One needs to look no further than TradFi to see this perspective is not new, and the security premium to transact on Ethereum is actually the product. There’s a reason why institutions pay more to trade on the NYSE than the Pink Sheets (securities on OTC exchanges), and why they continue to transact through SWIFT, despite its costs. It’s all about legitimacy and a proven track record of conducting transactions in a secure and compliant manner. The same will apply to blockchains.
The idea of having hundreds of millions of dollars in funds stuck on an inoperable network is the definition of a nightmare for institutions. Many institutions value the battle-tested security of chains like Ethereum rather than ones that focus on speed. If you take one thing away from this op-ed, understand that traditional finance always pays for infrastructure reliability.
Preparing for regulations
What investors need most is a robust, market tested base-layer blockchain that is widely accepted among financial institutions as a neutral settlement layer. Ethereum gets serious institutional engagement because the network is properly integrated with existing infrastructure. It’s what it was built for.
One proof point is the number of major banks building on Ethereum, who get regulatory comfort with Ethereum’s decentralization, as well as from the pool of developer talent that has been, and will continue to be, concentrated within the Ethereum ecosystem. This just might be a self-reinforcing cycle of institutional adoption.
A feature, not a failure
We need to stop seeing Ethereum’s high fees as a failure – they’re a feature that naturally segments the market. Some chains are intentionally optimized for low cost, fast, micro transactions. Institutions need, and will pay for, the digital equivalent of Fort Knox for large ones, where liquidity is available.
Instead of looking at metrics like daily active users or translation counts, institutions are taking a more fundamental approach. They are watching where regulated entities are building their infrastructure, and are focused on the big game of institutional settlement.
So the next time someone declares Ethereum dead, ask them where they would rather settle a $500 million transaction? The answer reveals why reports of Ethereum’s demise are greatly exaggerated – and why institutions betting on “boring” Ethereum infrastructure will capture the real value in DeFi’s institutional future.
Read more: Paul Brody — Ethereum Has Already Won

Wall Street giant Citigroup (C) has launched new ether (ETH) forecasts, calling for $4,300 by year-end, which would be a decline from the current $4,515.
That’s the base case though. The bank’s full assessment is wide enough to drive an army regiment through, with the bull case being $6,400 and the bear case $2,200.
The bank analysts said network activity remains the key driver of ether’s value, but much of the recent growth has been on layer-2s, where value “pass-through” to Ethereum’s base layer is unclear.
Citi assumes just 30% of layer-2 activity contributes to ether’s valuation, putting current prices above its activity-based model, likely due to strong inflows and excitement around tokenization and stablecoins.
A layer 1 network is the base layer, or the underlying infrastructure of a blockchain. Layer 2 refers to a set of off-chain systems or separate blockchains built on top of layer 1s.
Exchange-traded fund (ETF) flows, though smaller than bitcoin’s (BTC), have a bigger price impact per dollar, but Citi expects them to remain limited given ether’s smaller market cap and lower visibility with new investors.
Macro factors are seen adding only modest support. With equities already near the bank’s S&P 500 6,600 target, the analysts do not expect major upside from risk assets.
Read more: Ether Bigger Beneficiary of Digital Asset Treasuries Than Bitcoin or Solana: StanChart

Stellar’s XLM token endured sharp swings over the past 24 hours, tumbling 3% as institutional selling pressure dominated order books. The asset declined from $0.39 to $0.38 between September 14 at 15:00 and September 15 at 14:00, with trading volumes peaking at 101.32 million—nearly triple its 24-hour average. The heaviest liquidation struck during the morning hours of September 15, when XLM collapsed from $0.395 to $0.376 within two hours, establishing $0.395 as firm resistance while tentative support formed near $0.375.
Despite the broader downtrend, intraday action highlighted moments of resilience. From 13:15 to 14:14 on September 15, XLM staged a brief recovery, jumping from $0.378 to a session high of $0.383 before closing the hour at $0.380. Trading volume surged above 10 million units during this window, with 3.45 million changing hands in a single minute as bulls attempted to push past resistance. While sellers capped momentum, the consolidation zone around $0.380–$0.381 now represents a potential support base.
Market dynamics suggest distribution patterns consistent with institutional profit-taking. The persistent supply overhead has reinforced resistance at $0.395, where repeated rally attempts have failed, while the emergence of support near $0.375 reflects opportunistic buying during liquidation waves. For traders, the $0.375–$0.395 band has become the key battleground that will define near-term direction.
")
Technical Indicators
- XLM retreated 3% from $0.39 to $0.38 during the previous 24-hours from 14 September 15:00 to 15 September 14:00.
- Trading volume peaked at 101.32 million during the 08:00 hour, nearly triple the 24-hour average of 24.47 million.
- Strong resistance established around $0.395 level during morning selloff.
- Key support emerged near $0.375 where buying interest materialized.
- Price range of $0.019 representing 5% volatility between peak and trough.
- Recovery attempts reached $0.383 by 13:00 before encountering selling pressure.
- Consolidation pattern formed around $0.380-$0.381 zone suggesting new support level.
Disclaimer: Parts of this article were generated with the assistance from AI tools and reviewed by our editorial team to ensure accuracy and adherence to our standards. For more information, see CoinDesk’s full AI Policy.
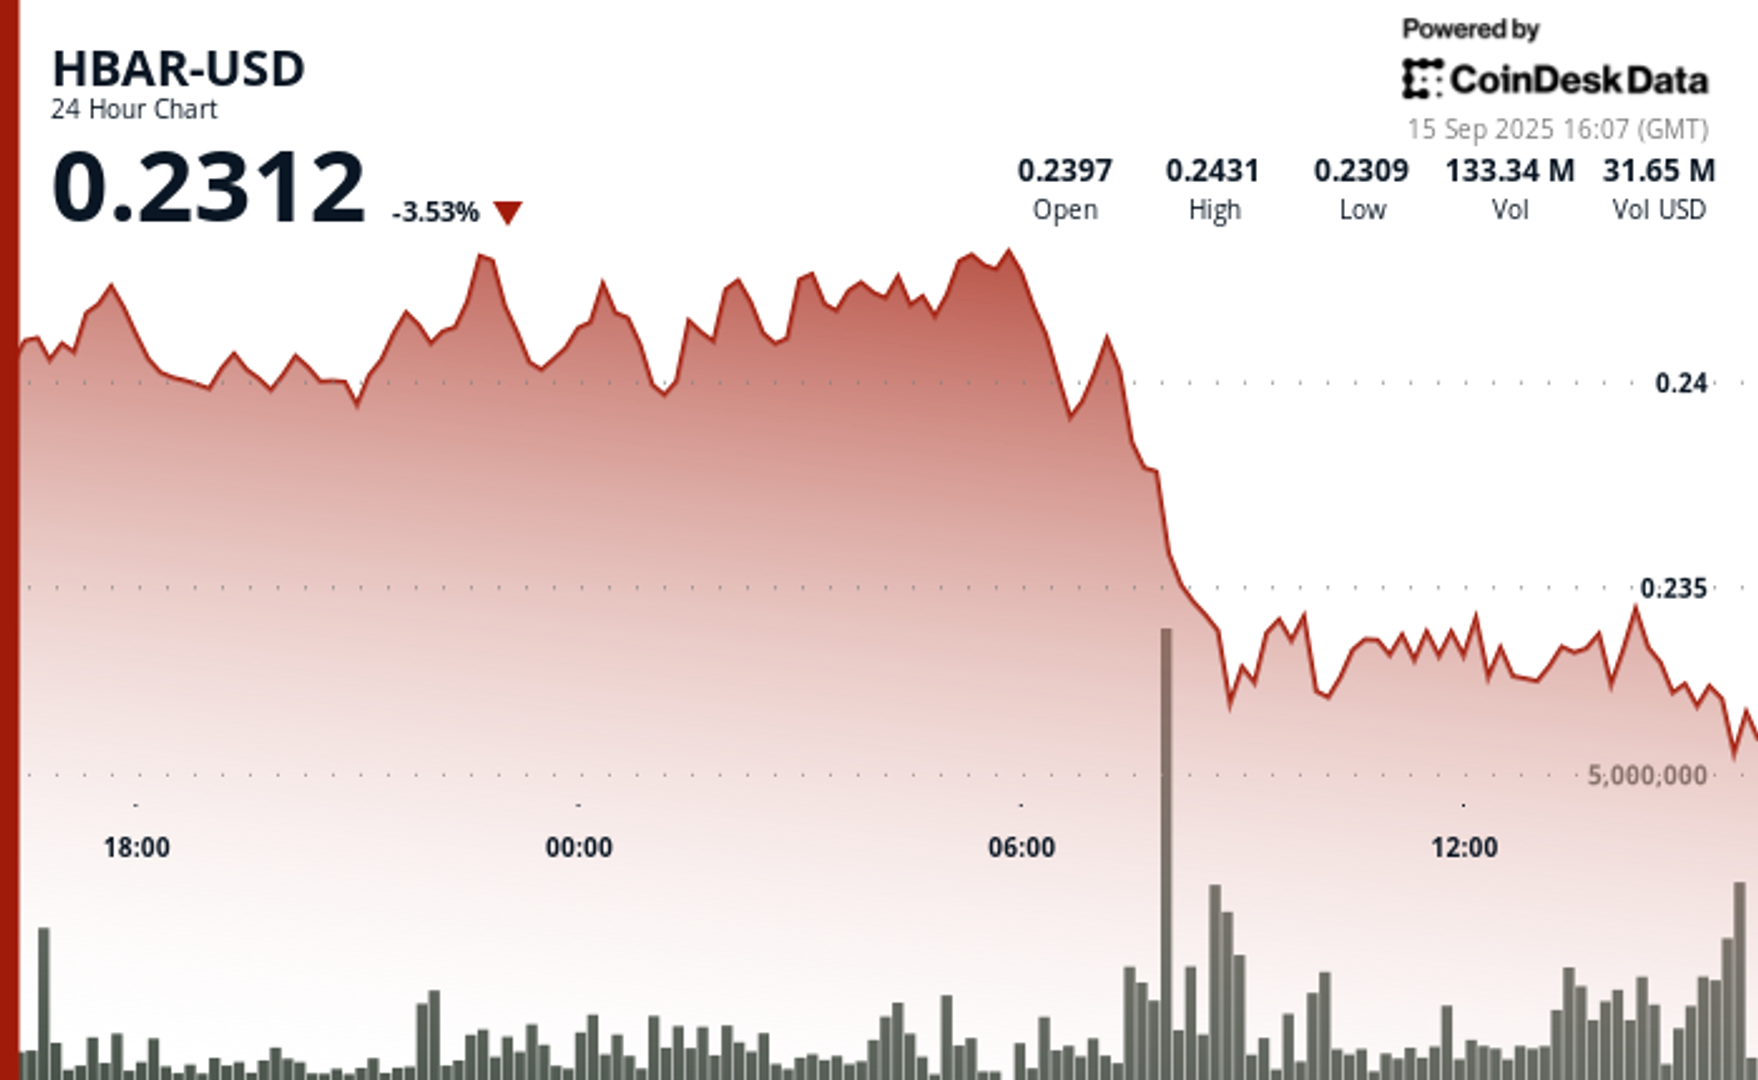
Hedera Hashgraph’s HBAR token endured steep losses over a volatile 24-hour window between September 14 and 15, falling 5% from $0.24 to $0.23. The token’s trading range expanded by $0.01 — a move often linked to outsized institutional activity — as heavy corporate selling overwhelmed support levels. The sharpest move came between 07:00 and 08:00 UTC on September 15, when concentrated liquidation drove prices lower after days of resistance around $0.24.
Institutional trading volumes surged during the session, with more than 126 million tokens changing hands on the morning of September 15 — nearly three times the norm for corporate flows. Market participants attributed the spike to portfolio rebalancing by large stakeholders, with enterprise adoption jitters and mounting regulatory scrutiny providing the backdrop for the selloff.
Recovery efforts briefly emerged during the final hour of trading, when corporate buyers tested the $0.24 level before retreating. Between 13:32 and 13:35 UTC, one accumulation push saw 2.47 million tokens deployed in an effort to establish a price floor. Still, buying momentum ultimately faltered, with HBAR settling back into support at $0.23.
The turbulence underscores the token’s vulnerability to institutional distribution events. Analysts point to the failed breakout above $0.24 as confirmation of fresh resistance, with $0.23 now serving as the critical support zone. The surge in volume suggests major corporate participants are repositioning ahead of regulatory shifts, leaving HBAR’s near-term outlook dependent on whether enterprise buyers can mount sustained defenses above key support.
")
Technical Indicators Summary
- Corporate resistance levels crystallized at $0.24 where institutional selling pressure consistently overwhelmed enterprise buying interest across multiple trading sessions.
- Institutional support structures emerged around $0.23 levels where corporate buying programs have systematically absorbed selling pressure from retail and smaller institutional participants.
- The unprecedented trading volume surge to 126.38 million tokens during the 08:00 morning session reflects enterprise-scale distribution strategies that overwhelmed corporate demand across major trading platforms.
- Subsequent institutional momentum proved unsustainable as systematic selling pressure resumed between 13:37-13:44, driving corporate participants back toward $0.23 support zones with sustained volumes exceeding 1 million tokens, indicating ongoing institutional distribution.
- Final trading periods exhibited diminishing corporate activity with zero recorded volume between 13:13-14:14, suggesting institutional participants adopted defensive positioning strategies as HBAR consolidated at $0.23 amid enterprise uncertainty.
Disclaimer: Parts of this article were generated with the assistance from AI tools and reviewed by our editorial team to ensure accuracy and adherence to our standards. For more information, see CoinDesk’s full AI Policy.


Wall Street Bank Citigroup Sees Ether Falling to $4,300 by Year-End

XLM Sees Heavy Volatility as Institutional Selling Weighs on Price

HBAR Tumbles 5% as Institutional Investors Trigger Mass Selloff
-

 Business11 месяцев ago
3 Ways to make your business presentation more relatable
-
Fashion11 месяцев ago
According to Dior Couture, this taboo fashion accessory is back
-
Entertainment11 месяцев ago
10 Artists who retired from music and made a comeback
-
Entertainment11 месяцев ago
\’Better Call Saul\’ has been renewed for a fourth season
-
Entertainment11 месяцев ago
New Season 8 Walking Dead trailer flashes forward in time
-
Business11 месяцев ago
15 Habits that could be hurting your business relationships
-
Entertainment11 месяцев ago
Meet Superman\’s grandfather in new trailer for Krypton
-
Entertainment11 месяцев ago
Disney\’s live-action Aladdin finally finds its stars