Uncategorized
Who Is Cashing Out of Bitcoin at Record Highs Above $120K?
Since mid-July, bitcoin’s (BTC) ascent has slowed above $120,000. Prices hit a new high of $124,157 early Thursday but have since pulled back to $123,000, lacking momentum.
This raises a question: who is cashing out of bitcoin and adding selling pressure to the market? According to observers, the answer lies in blockchain data, which shows old wallets have been liquidating their holdings.
«It may be linked to concentrated selling pressure from long-term holders who have recently accelerated their selling,» Gabriel Halm, senior blockchain analyst at Sentora, told CoinDesk.
«Historically, long-term holders’ selling phases are cleanly defined within the bitcoin cycle. This time, however, accumulation during Q2’s pullback has given way to renewed selling, suggesting the market’s structure may be shifting.»
The supply of BTC controlled by long-term holders or wallets with a history of owning coins for 155 days or more has declined by over 300,000 BTC in four weeks, according to data source Bitcoin Magazine.
Several dormant wallets, inactive for over a decade, have become active in the past four weeks, moving coins on-chain for the first time in years, possibly in profit-taking operations.
Blockchain analytics firm Glassnode stated last week that profit-taking by long-term holders continues, albeit at a slower rate than in July.
«$BTC profit realization by long-term holders (7D SMA) has slowed in August after a July run consistently above $1B/day — one of the largest profit-taking periods on record,» Glassnode said on X.
Sam Gaer, chief investment officer of Monarq Asset Management’s Directional Fund, stated that the supply from ancient wallets has been capping upside but has been largely absorbed well, matching the pattern seen last year when Germany’s Saxony state liquidated its holdings.
«Price levels in BTC have tended to consolidate around psychological levels (think $100,000, $110,000, $120,000) and specifically around ATH levels. This same pattern was seen just last month at the $110,000 level as we touched all-time highs at the 112 area and then drifted lower several times,» Gaer said.
The persistent selling of higher strike calls by institutions could have influenced the rally speed. They typically do so to earn an additional yield on top of spot market holdings. According to Gaer, the so-called call overwriting has led to a volatility meltdown. Implied volatility, which represents expected price turbulence over a specific period, is driven by demand for options.
«Call overwriting activity by long-term holders continues in a seemingly unabated fashion, with a vol crush that’s left BTC with weekend vols in the teens- unheard of in my experience. I use the phrase ’40 is the new 60′ when referencing the overall BTC [implied] volatility repricing– this is a historical sign of a market maturing,» Gaer said.
What next?
The path of least resistance remains upside, thanks to signs of strong dip-demand and macroeconomic tailwinds.
«1.88 million addresses bought 1.3 million BTC at an average of $118,000, indicating a strong layer of demand that has so far prevented a deeper pullback,» Halm told CoinDesk.
Speaking of macro, the market is increasingly getting comfortable with the idea that the new normal inflation in the post-COVID world is well above the Fed’s 2% target and expects the central bank to cut rates in September.
Steve Gregory, founder of Vtrader, expects renewed rotation of funds into bitcoin from ether.
«We may see a rotation back to bitcoin and a break of the $120,000 level as bitcoin’s 3-month volatility hit its lowest since September 2023. Furthermore, 95% of ETH wallets are now in profit, indicating that traders may make a logical rotation back to BTC,» Gregory said.
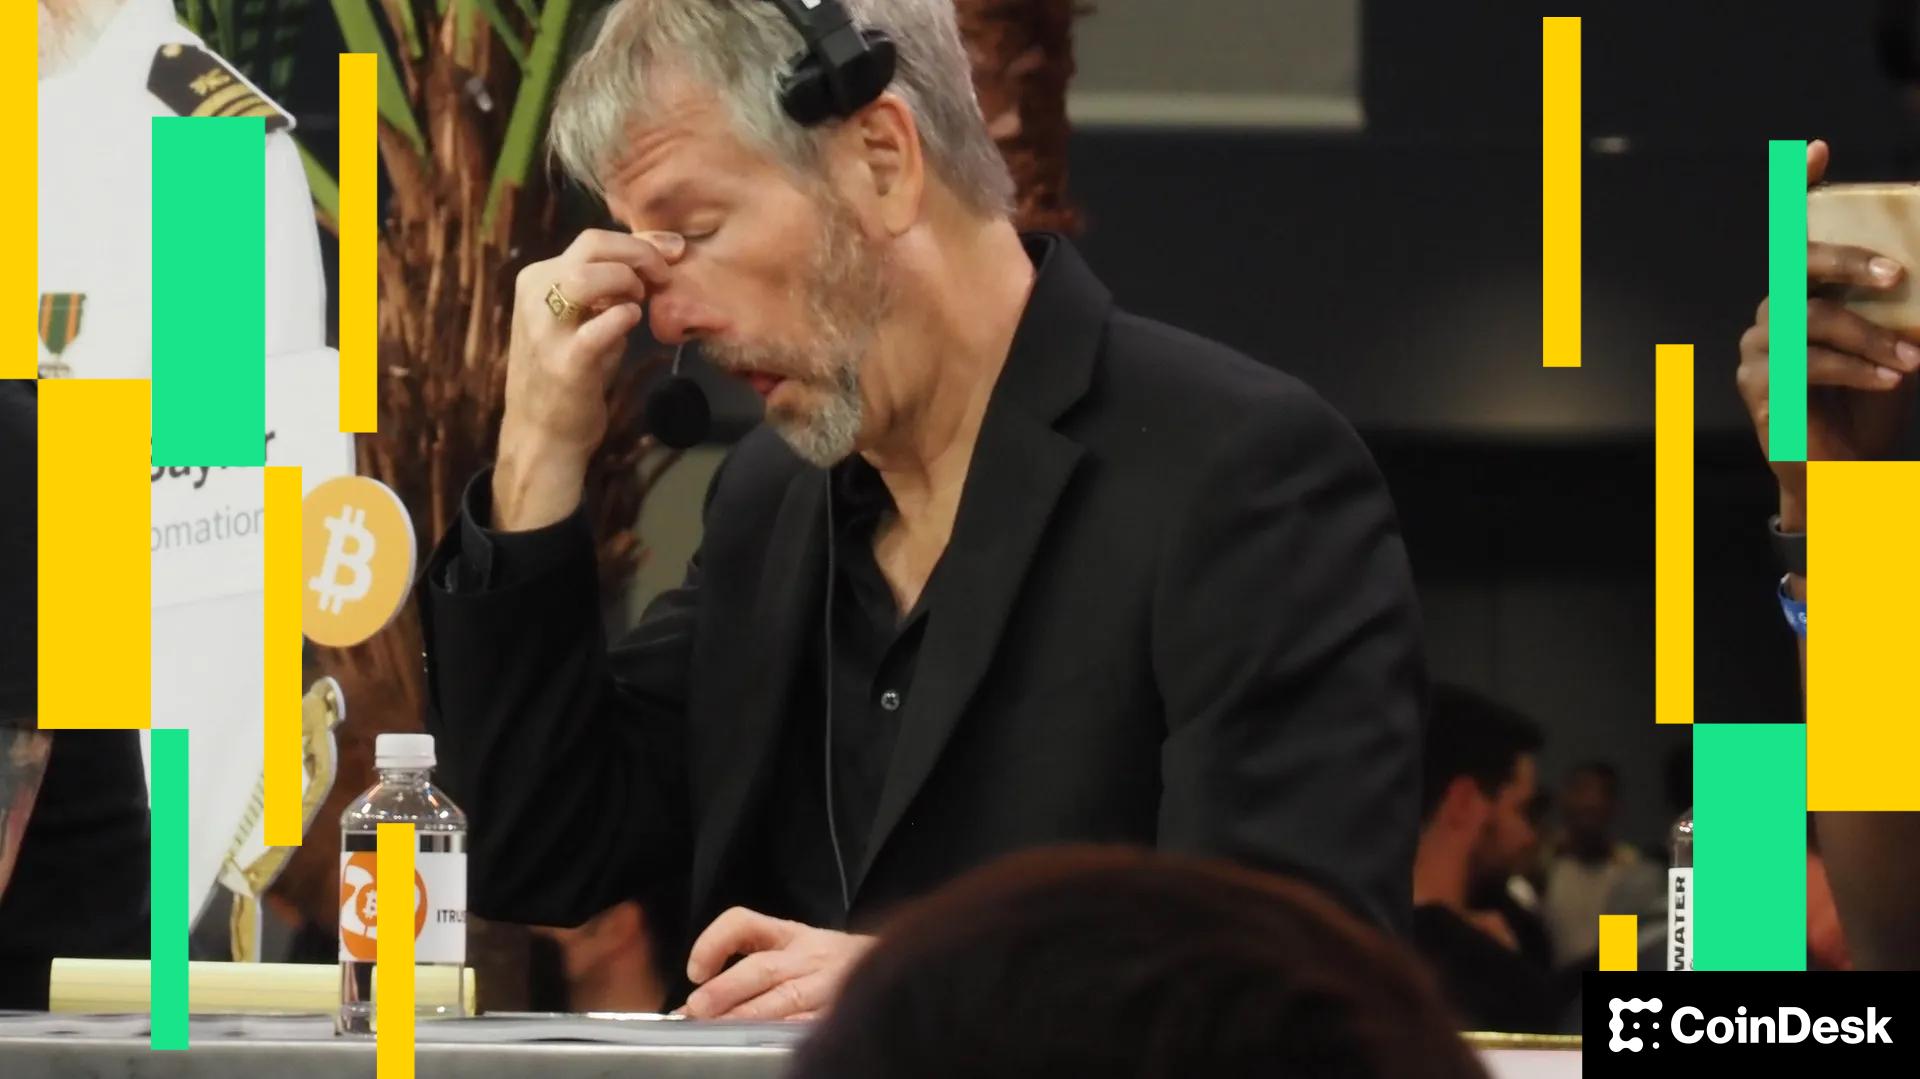
Strategy (MSTR), the world’s largest corporate owner of bitcoin (BTC), appeared to miss out on capitalizing on last week’s market rout to purchase the dip in prices.
According to Monday’s press release, the firm bought 220 BTC at an average price of $123,561. The company used the proceeds of selling its various preferred stocks (STRF, STRK, STRD), raising $27.3 million.
That purchase price was well above the prices the largest crypto changed hands in the second half of the week. Bitcoin nosedived from above $123,000 on Thursday to as low as $103,000 on late Friday during one, if not the worst crypto flash crash on record, liquidating over $19 billion in leveraged positions.
That move occurred as Trump said to impose a 100% increase in tariffs against Chinese goods as a retaliation for tightening rare earth metal exports, reigniting fears of a trade war between the two world powers.
At its lowest point on Friday, BTC traded nearly 16% lower than the average of Strategy’s recent purchase price. Even during the swift rebound over the weekend, the firm could have bought tokens between $110,000 and $115,000, at a 7%-10% discount compared to what it paid for.
With the latest purchase, the firm brought its total holdings to 640,250 BTC, at an average acquisition price of $73,000 since starting its bitcoin treasury plan in 2020.
MSTR, the firm’s common stock, was up 2.5% on Monday.
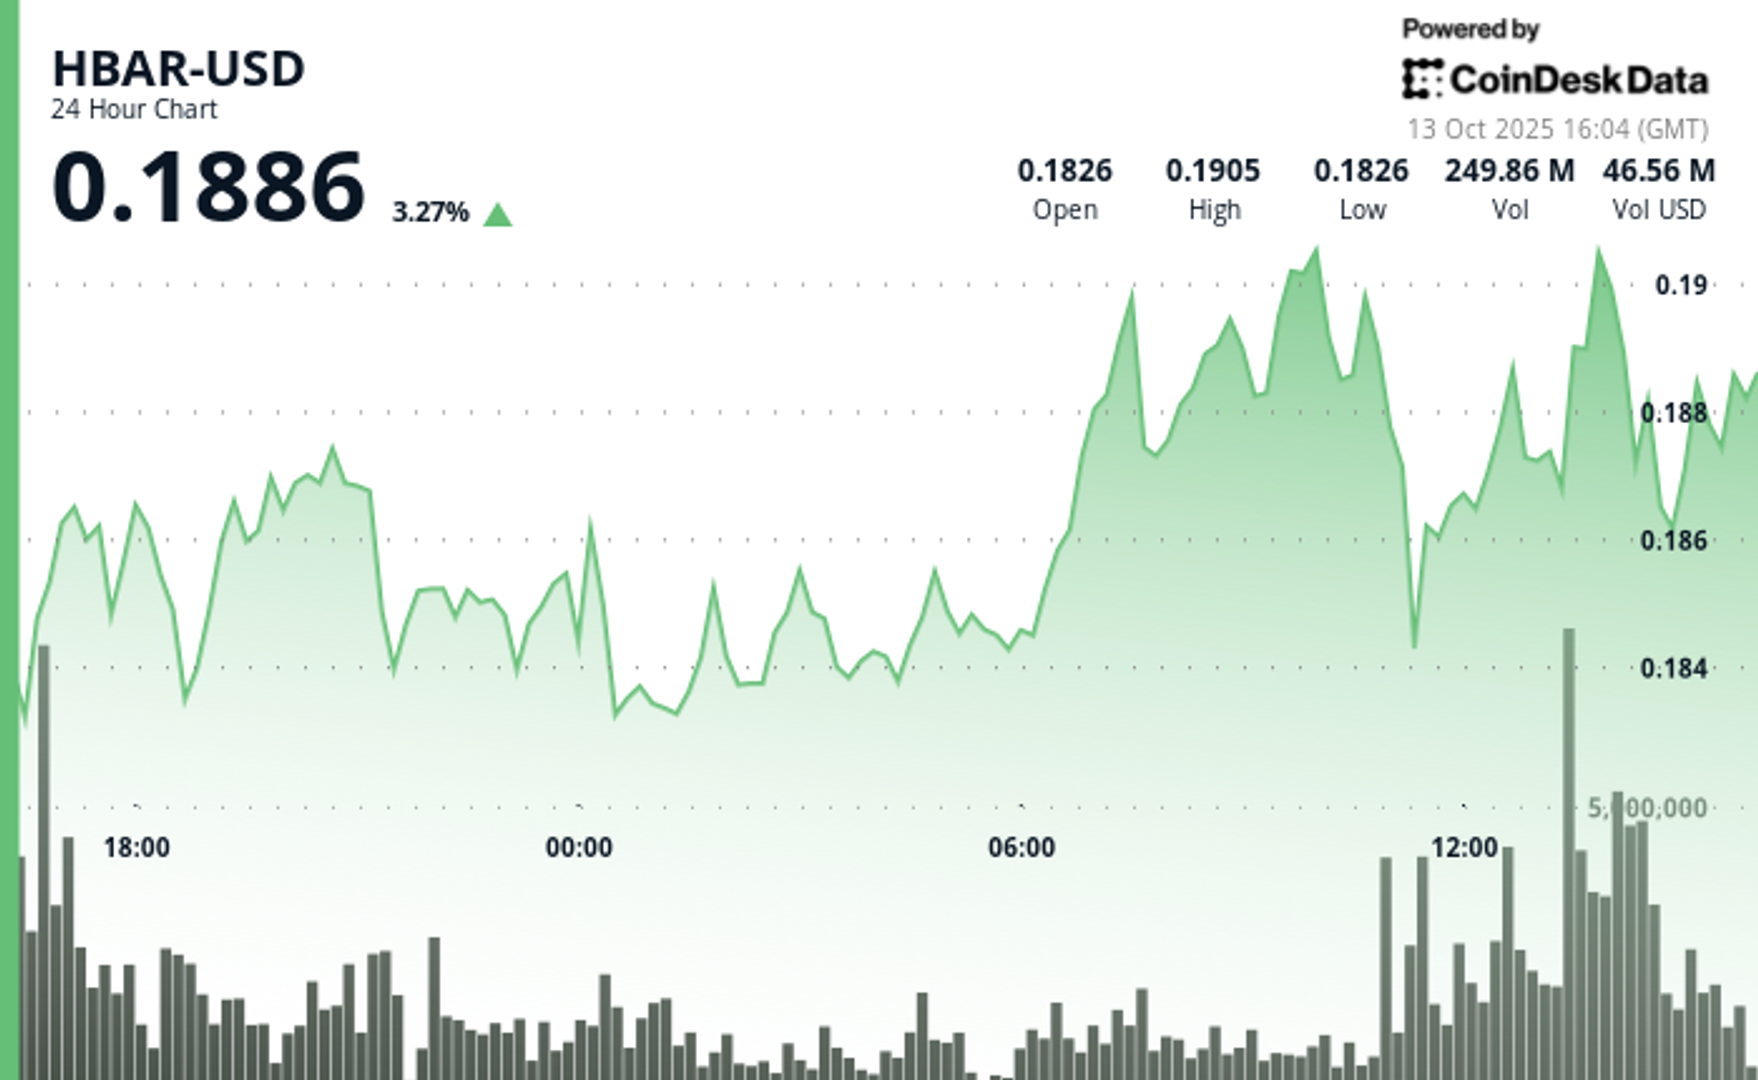
HBAR (Hedera Hashgraph) experienced pronounced volatility in the final hour of trading on Oct. 13, soaring from $0.187 to a peak of $0.191—a 2.14% intraday gain—before consolidating around $0.190.
The move was driven by a dramatic surge in trading activity, with a standout 15.65 million tokens exchanged at 13:31, signaling strong institutional participation. This decisive volume breakout propelled the asset beyond its prior resistance range of $0.190–$0.191, establishing a new technical footing amid bullish momentum.
The surge capped a broader 23-hour rally from Oct. 12 to 13, during which HBAR advanced roughly 9% within a $0.17–$0.19 bandwidth. This sustained upward trajectory was characterized by consistent volume inflows and a firm recovery from earlier lows near $0.17, underscoring robust market conviction. The asset’s ability to preserve support above $0.18 throughout the period reinforced confidence among traders eyeing continued bullish action.
Strong institutional engagement was evident as consecutive high-volume intervals extended through the breakout window, suggesting renewed accumulation and positioning for potential continuation. HBAR’s price structure now shows resilient support around $0.189–$0.190, signaling the possibility of further upside if momentum persists and broader market conditions remain favorable.
")
Technical Indicators Highlight Bullish Sentiment
- HBAR operated within a $0.017 bandwidth (9%) spanning $0.174 and $0.191 throughout the previous 23-hour period from 12 October 15:00 to 13 October 14:00.
- Substantial volume surges reaching 179.54 million and 182.77 million during 11:00 and 13:00 sessions on 13 October validated positive market sentiment.
- Critical resistance materialized at $0.190-$0.191 thresholds where price movements encountered persistent selling activity.
- The $0.183-$0.184 territory established dependable support through volume-supported bounces.
- Extraordinary volume explosion at 13:31 registering 15.65 million units signaled decisive breakout event.
- High-volume intervals surpassing 10 million units through 13:35 substantiated significant institutional engagement.
- Asset preserved support above $0.189 despite moderate profit-taking activity.
Disclaimer: Parts of this article were generated with the assistance from AI tools and reviewed by our editorial team to ensure accuracy and adherence to our standards. For more information, see CoinDesk’s full AI Policy.
The crypto market staged a recovery on Monday following the weekend’s $500 billion bloodbath that resulted in a $10 billion drop in open interest.
Bitcoin (BTC) rose by 1.4% while ether (ETH) outperformed with a 2.5% gain. Synthetix (SNX, meanwhile, stole the show with a 120% rally as traders anticipate «perpetual wars» between the decentralized trading venue and HyperLiquid.
Plasma (XPL) and aster (ASTER) both failed to benefit from Monday’s recovery, losing 4.2% and 2.5% respectively.
Derivatives Positioning
- The BTC futures market has stabilized after a volatile period. Open interest, which had dropped from $33 billion to $23 billion over the weekend, has now settled at around $26 billion. Similarly, the 3-month annualized basis has rebounded to the 6-7% range, after dipping to 4-5% over the weekend, indicating that the bullish sentiment has largely returned. However, funding rates remain a key area of divergence; while Bybit and Hyperliquid have settled around 10%, Binance’s rate is negative.
- The BTC options market is showing a renewed bullish lean. The 24-hour Put/Call Volume has shifted to be more in favor of calls, now at over 56%. Additionally, the 1-week 25 Delta Skew has risen to 2.5% after a period of flatness.
- These metrics indicate a market with increasing demand for bullish exposure and upside protection, reflecting a shift away from the recent «cautious neutrality.»
- Coinglass data shows $620 million in 24 hour liquidations, with a 34-66 split between longs and shorts. ETH ($218 million), BTC ($124 million) and SOL ($43 million) were the leaders in terms of notional liquidations. Binance liquidation heatmap indicates $116,620 as a core liquidation level to monitor, in case of a price rise.
Token Talk
By Oliver Knight
- The crypto market kicked off Monday with a rebound in the wake of a sharp weekend leverage flush. According to data from CoinMarketCap, the total crypto market cap climbed roughly 5.7% in the past 24 hours, with volume jumping about 26.8%, suggesting those liquidated at the weekend are repurchasing their positions.
- A total of $19 billion worth of derivatives positions were wiped out over the weekend with the vast majority being attributed to those holding long positions, in the past 24 hours, however, $626 billion was liquidated with $420 billion of that being on the short side, demonstrating a reversal in sentiment, according to CoinGlass.
- The recovery has been tentative so far; the dominance of Bitcoin remains elevated at about 58.45%, down modestly from recent highs, which implies altcoins may still lag as capital piles back into safer large-cap names.
- The big winner of Monday’s recovery was synthetix (SNX), which rose by more than 120% ahead of a crypto trading competition that will see it potentially start up «perpetual wars» with HyperLiquid.


Strategy Bought $27M in Bitcoin at $123K Before Crypto Crash

HBAR Rises Past Key Resistance After Explosive Decline

Crypto Markets Today: Bitcoin and Altcoins Recover After $500B Crash
-

 Business12 месяцев ago
3 Ways to make your business presentation more relatable
-
Fashion12 месяцев ago
According to Dior Couture, this taboo fashion accessory is back
-
Entertainment12 месяцев ago
10 Artists who retired from music and made a comeback
-
Entertainment12 месяцев ago
\’Better Call Saul\’ has been renewed for a fourth season
-
Entertainment12 месяцев ago
New Season 8 Walking Dead trailer flashes forward in time
-

 Uncategorized4 месяца ago
Robinhood Launches Micro Bitcoin, Solana and XRP Futures Contracts
-
Business12 месяцев ago
15 Habits that could be hurting your business relationships
-
Entertainment12 месяцев ago
Meet Superman\’s grandfather in new trailer for Krypton