Uncategorized
What the Key Metrics for Onchain Activity Say About SOL, ETH and Other Chains in 2025

Web3 is drowning in metrics, most of which paint an unclear picture. Transaction volumes, token prices and flashy headlines often mask what really matters: the quality of user engagement and the potential for organic, exponential growth. As the industry moves beyond the hype, reliable, data-driven signals of success are no longer optional — they’re essential.
Here’s the good news: the tools to cut through the noise already exist. By combining multiple on-chain metrics into a single “health index” score indicating the depth and quality of overall user engagement, we can identify which chains are truly thriving and poised for long-term growth. With 2024 coming to a close, let’s dig into what these signals reveal about today’s leading chains, and what we can expect in 2025.
Assessing user quality using aggregated, not isolated, data
When creating a sustainable on-chain ecosystem, it doesn’t make sense to optimize any single user action. What’s needed is context — a way to quantify not just everything users are doing, but how and why it matters. One promising approach to achieve this is to aggregate user behaviors into five core categories:
Transaction Activity, ranging from spot trades to smart contract interactions.
Token Accumulation in the medium-to-long-term, and other “investment” behaviors.
DeFi Engagement for activities like staking, lending and liquidity provision.
NFT Activity such as minting, trading and utility-driven interactions.
Governance Participation to quantify DAO or protocol governance contributions.
Crucially, these metrics should not be treated equally. A better approach is to weigh and combine them using a Bayesian model to generate a single top-line “score.” Unlike traditional scoring systems that rely on static thresholds or simple averages, this lets us incorporate both prior knowledge (what we expect from an “average” wallet) and new evidence (actual activity observed on-chain). These dynamic, multi-variate scores are much harder to game and therefore more likely to reveal accurate, actionable insights.
What the data tells us about 2024
The above approach provides a fresh perspective on each chain’s user activity through 2024. Let’s zoom in on some of the more surprising findings.
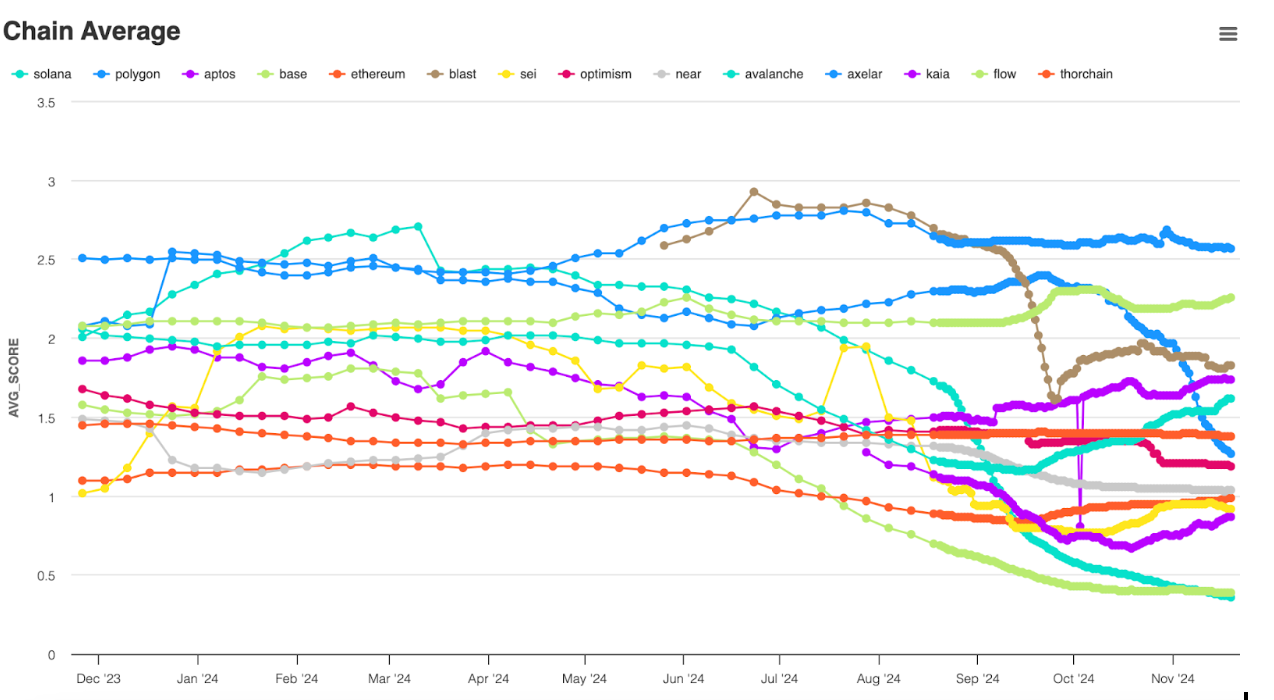
Solana (the top light blue line that peaks at ~2.75) attracted a huge share of high-quality users between February and mid-March, but engagement quality has fallen since. Interestingly, this downslide coincided with SOL’s first price and trading volume spike of 2024, and has continued through the current memecoin mania. Repetitive actions have diminishing returns when assessed using a Bayesian model, meaning multiple token swaps yield smaller score improvements than engagement across multiple types of activities, for any given wallet. This suggests most Solana users are currently engaged in a narrow range of on-chain activities that aren’t contributing to Solana’s multi-sector growth.
As for Ethereum supporters (the bottom orange line that begins at just above 1) who expected this year’s ETH ETFs to be a game-changer, the numbers paint a different picture. Ethereum’s low and stable user score through H1 2024 suggests that this year’s bullish developments did not spur broader ecosystem participation such as DeFi activity and protocol governance.
It’s also worth noting that Axelar (the dark blue line that begins at 2.5) had the most active users across the broadest range of on-chain activities relative to its total user base, according to the data. While Axelar is currently much smaller by TVL than the legacy chains dominating today’s headlines, this is an intriguing signal that warrants closer inspection — and would have been missed if we were looking at market cap or trading volume alone.
The takeaway here isn’t that Solana is doomed and Axelar will inevitably become the world’s biggest chain. There is limited value in comparing these types of scores across chains, since each score is proportional to the user quality of its corresponding chain. In other words, a Solana user with a score of “4” may be very different from a “4” on Axelar, given the differences in each chain’s baseline activity. As such, these scores are most useful when tracking changes in the quality of a chain’s overall user activity over time, not cross-chain comparisons.
Predictions for 2025
With that said, what does each chain’s user quality track record tell us about next year?
For starters, it’s clear that Solana faces significant challenges and opportunities entering 2025. The chain’s trajectory depends on its ability to retain its massive casual user base and expand their range of on-chain interactions. Failure to do so could result in a significant slump once memecoins cool off — although data from early 2024 suggests the chain has a large contingent of quality users that will endure regardless of what happens short-term.
2024 demonstrated Axelar’s ability to attract a concentrated user base engaged in diverse, sustained on-chain activities, rather than speculative surges. Now, Axelar’s challenge will be upscaling its ecosystem without diluting the quality of its user base. This may involve prioritizing high-profile partnerships to unlock new audiences while creating more newbie-friendly onramps across its dApp ecosystem.
Ethereum’s fragmentation has shifted many active users to its faster, cheaper L2 ecosystem, and so we may see mainnet activity increasingly consolidate around core features protocol staking and governance. These activities are critical for the broader EVM ecosystem, but this trajectory may be penalized by scoring systems that reward diverse on-chain engagement.
This dynamic underscores a challenge for scoring systems: prioritizing wide-ranging user activity can present an incomplete picture when applied to task-specific networks (or general purpose chains that are evolving into something more specialized). As a result, it’s important to clearly define what success means for whatever chain is being evaluated and use a scoring system that captures the corresponding user actions.
A better way to define, and drive, on-chain growth
Web3 has spent too long chasing the wrong metrics and failing to view the data in aggregate. In 2025, the winners will be those who find multivariate ways to measure — and act on — what matters most: user quality.
By incorporating new scoring methods into their dashboards, on-chain intelligence platforms can provide more meaningful insights to investors and industry observers. At the same time, Web3 builders can use these scores to clarify top priorities and drive user engagement and value creation. Ultimately, this will help the entire industry shift away from hype-driven narratives to data-backed strategies that unlock the full potential of Web3 in 2025 and beyond.
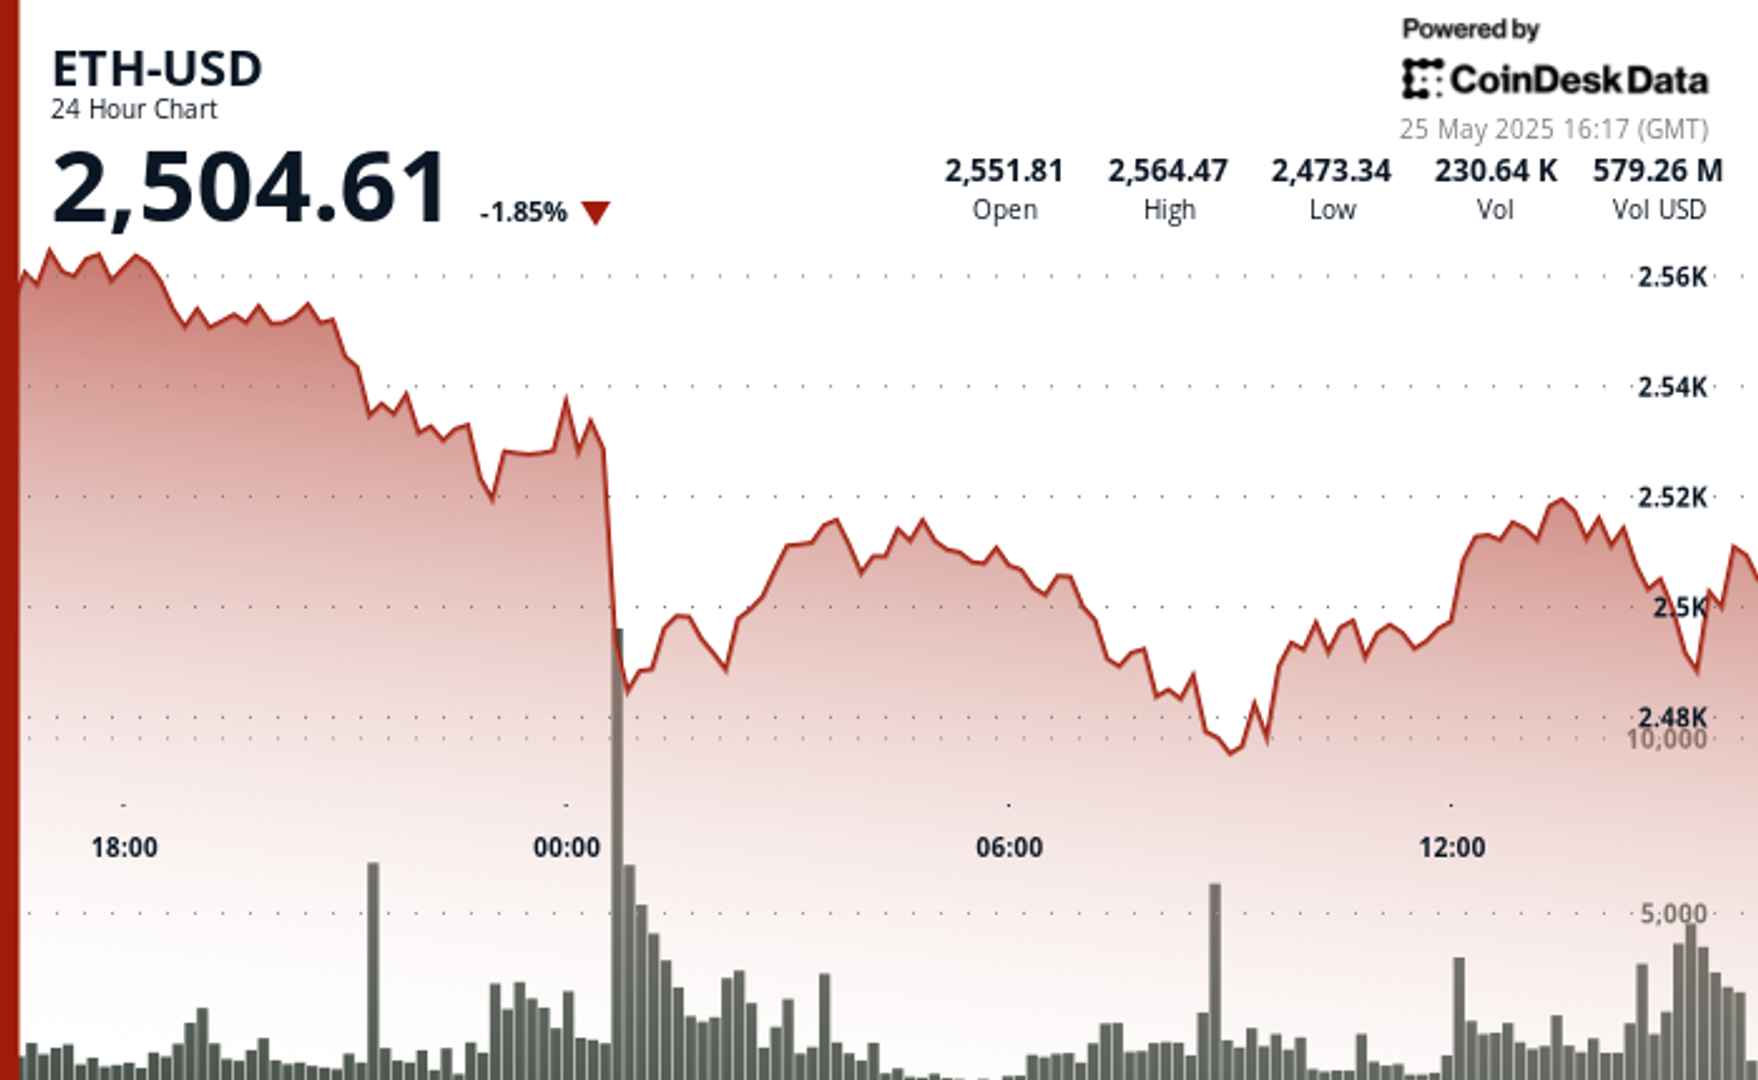
Global economic tensions and trade disputes continue to influence cryptocurrency markets, with ETH showing resilience despite broader market uncertainty.
The second-largest cryptocurrency is currently navigating a critical technical zone between $2,500-$2,530, which analysts identify as immediate resistance that must be overcome for continued upward movement.
Institutional interest remains strong, with spot Ethereum ETFs recording consecutive days of positive inflows, signaling growing confidence from larger investors despite the recent volatility.
Technical Analysis Highlights
- 24-hour ETH price action revealed a substantial 3.5% range ($99.85).
- Sharp sell-off during midnight hour saw price plummet to $2,477.40, establishing a key support zone.
- Extraordinary volume (291,395 units, nearly 3x average) confirmed the significance of the support level.
- Buyers stepped in at the $2,467-$2,480 support band, confirmed by high-volume accumulation during the 08:00-09:00 period.
- Recent price action shows bullish momentum with ETH reclaiming the $2,515 level.
- Potential higher low pattern suggests the correction may have found its bottom.
- $2,520-$2,530 area remains the immediate resistance to overcome for continued upward movement.
- Significant bullish surge at 13:35 saw price jump from $2,515.85 to $2,521.79, accompanied by exceptional volume (5,839 units).
- Sharp reversal occurred at 14:00, with price dropping 5.07 points to $2,508.02 on heavy volume (4,043 units).
- Hourly range of 14.46 points ($2,508.02-$2,522.48) demonstrates market indecision.
External References
- «Ethereum Holds Above Key Prices – Data Points To $2,900 Level As Bullish Trigger«, NewsBTC, published May 24, 2025.
- «Ethereum Forms Inverse H&S – Bulls Eye Breakout Above $2,700 Level«, Bitcoinist, published May 25, 2025.
- «Ethereum Price Analysis: Is ETH Primed for a ‘Healthy’ Correction?«, CryptoPotato, published May 25, 2025.
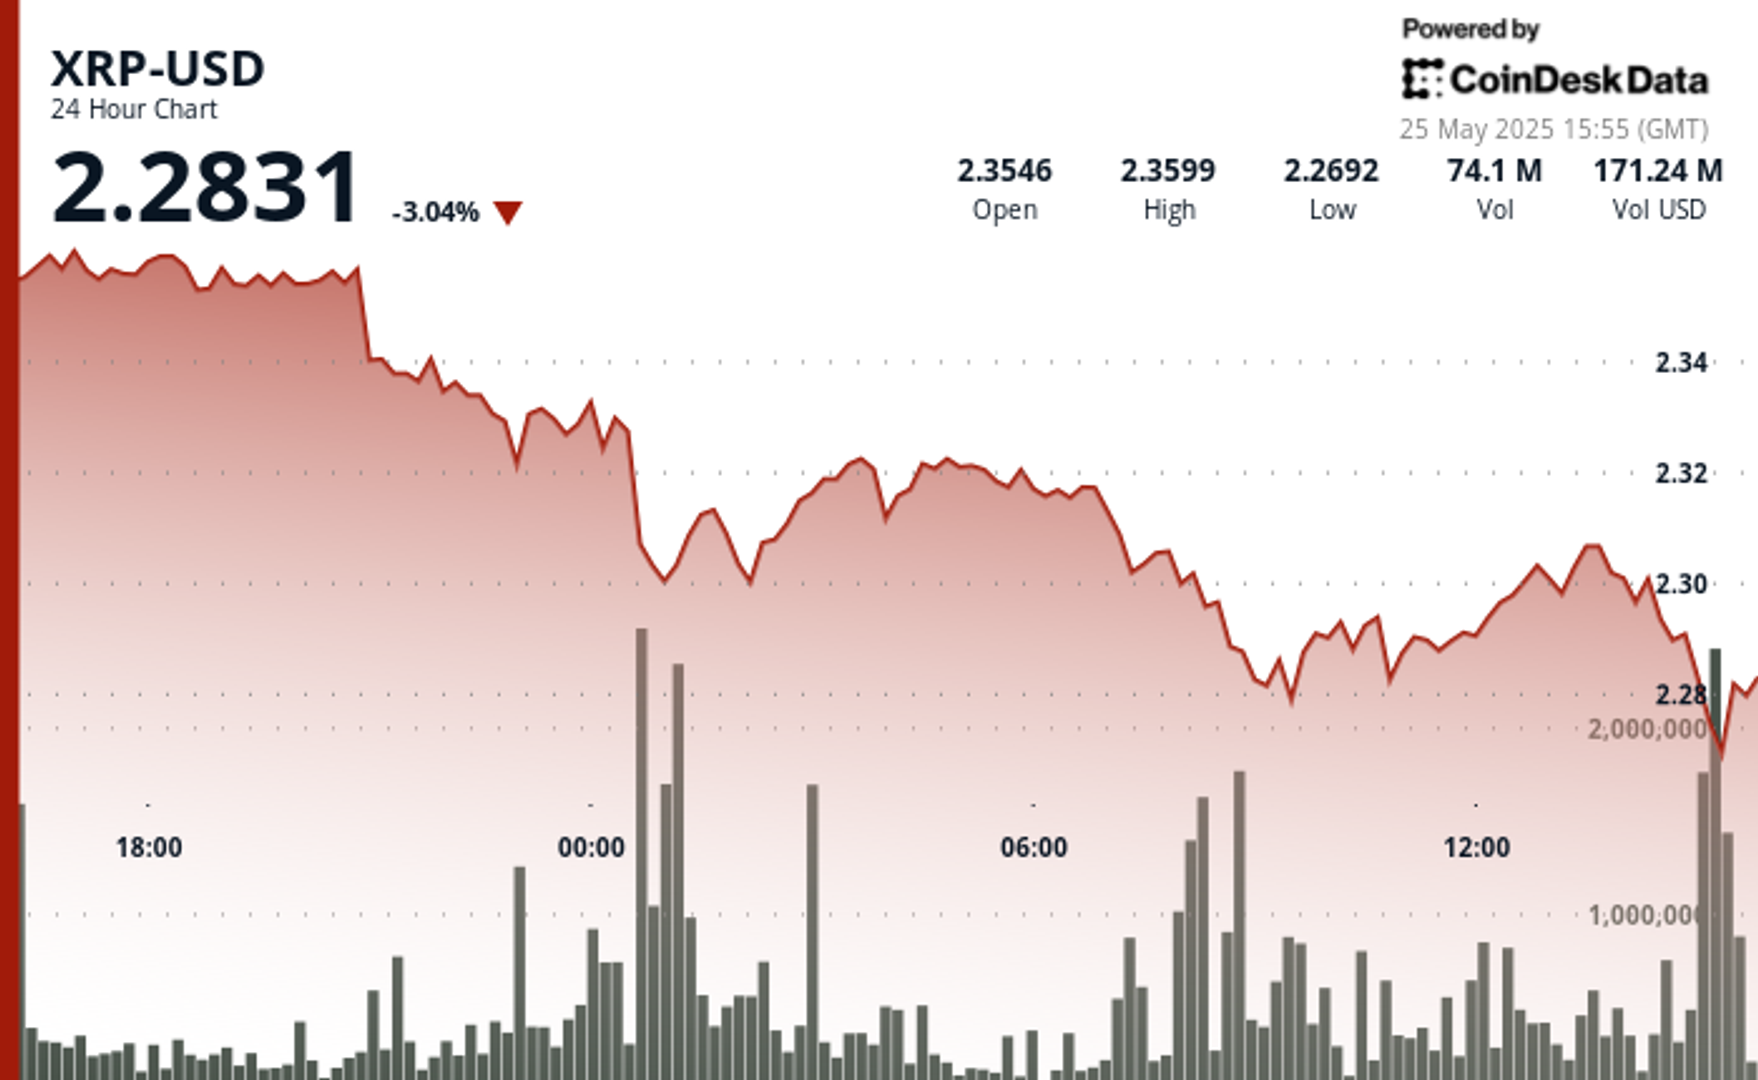
Global economic tensions are weighing heavily on cryptocurrency markets as XRP experiences a significant correction amid heavy selling pressure.
The recent announcement of potential 50% tariffs on European Union imports by the US government has triggered widespread market uncertainty, with XRP falling alongside most major cryptocurrencies despite Bitcoin recently reaching new all-time highs.
Technical analysts point to critical support at the $2.25-$2.26 range, with market watchers warning that a break below this level could trigger deeper corrections toward the $1.55-$1.90 zone.
Meanwhile, institutional interest remains strong with Volatility Shares launching an XRP futures ETF and leveraged ETF inflows surging despite the price dip, suggesting Wall Street continues accumulating positions during market weakness.
Technical Analysis Highlights
- XRP underwent a notable 3.46% correction over the 24-hour period, with price declining from $2.361 to $2.303, creating an overall range of $0.084 (3.57%).
- The most significant price action occurred during the midnight hour (00:00), when XRP plummeted to $2.297 on exceptionally high volume (37.1M), establishing a strong volume-based support zone.
- A secondary sell-off at 08:00 saw price touch the period low of $2.280 with the highest volume spike (39.9M), confirming a double-bottom formation.
- In the last hour, XRP experienced significant volatility with a recovery attempt following the earlier correction.
- After reaching a low of $2.297 at 13:11, price formed a base around $2.298 before staging a substantial rally beginning at 13:27, peaking at $2.307 at 13:36-13:39 with exceptionally high volume (627K-480K).
- This bullish momentum created a clear resistance zone at $2.307, which was tested multiple times.
- The final 15 minutes saw profit-taking pressure emerge, with price retracing to $2.300, establishing a short-term support level that aligns with the psychological $2.30 threshold.
External References
- «XRP Price Watch: Consolidation or Collapse? Market Holds Breath Near $2.35«, Bitcoin.com News, published May 24, 2025.
- «XRP Price Prediction For May 25«, CoinPedia, published May 25, 2025.
- «XRP Risks Fall To $1.55 If This Support Level Fails – Analyst«, NewsBTC, published May 25, 2025.
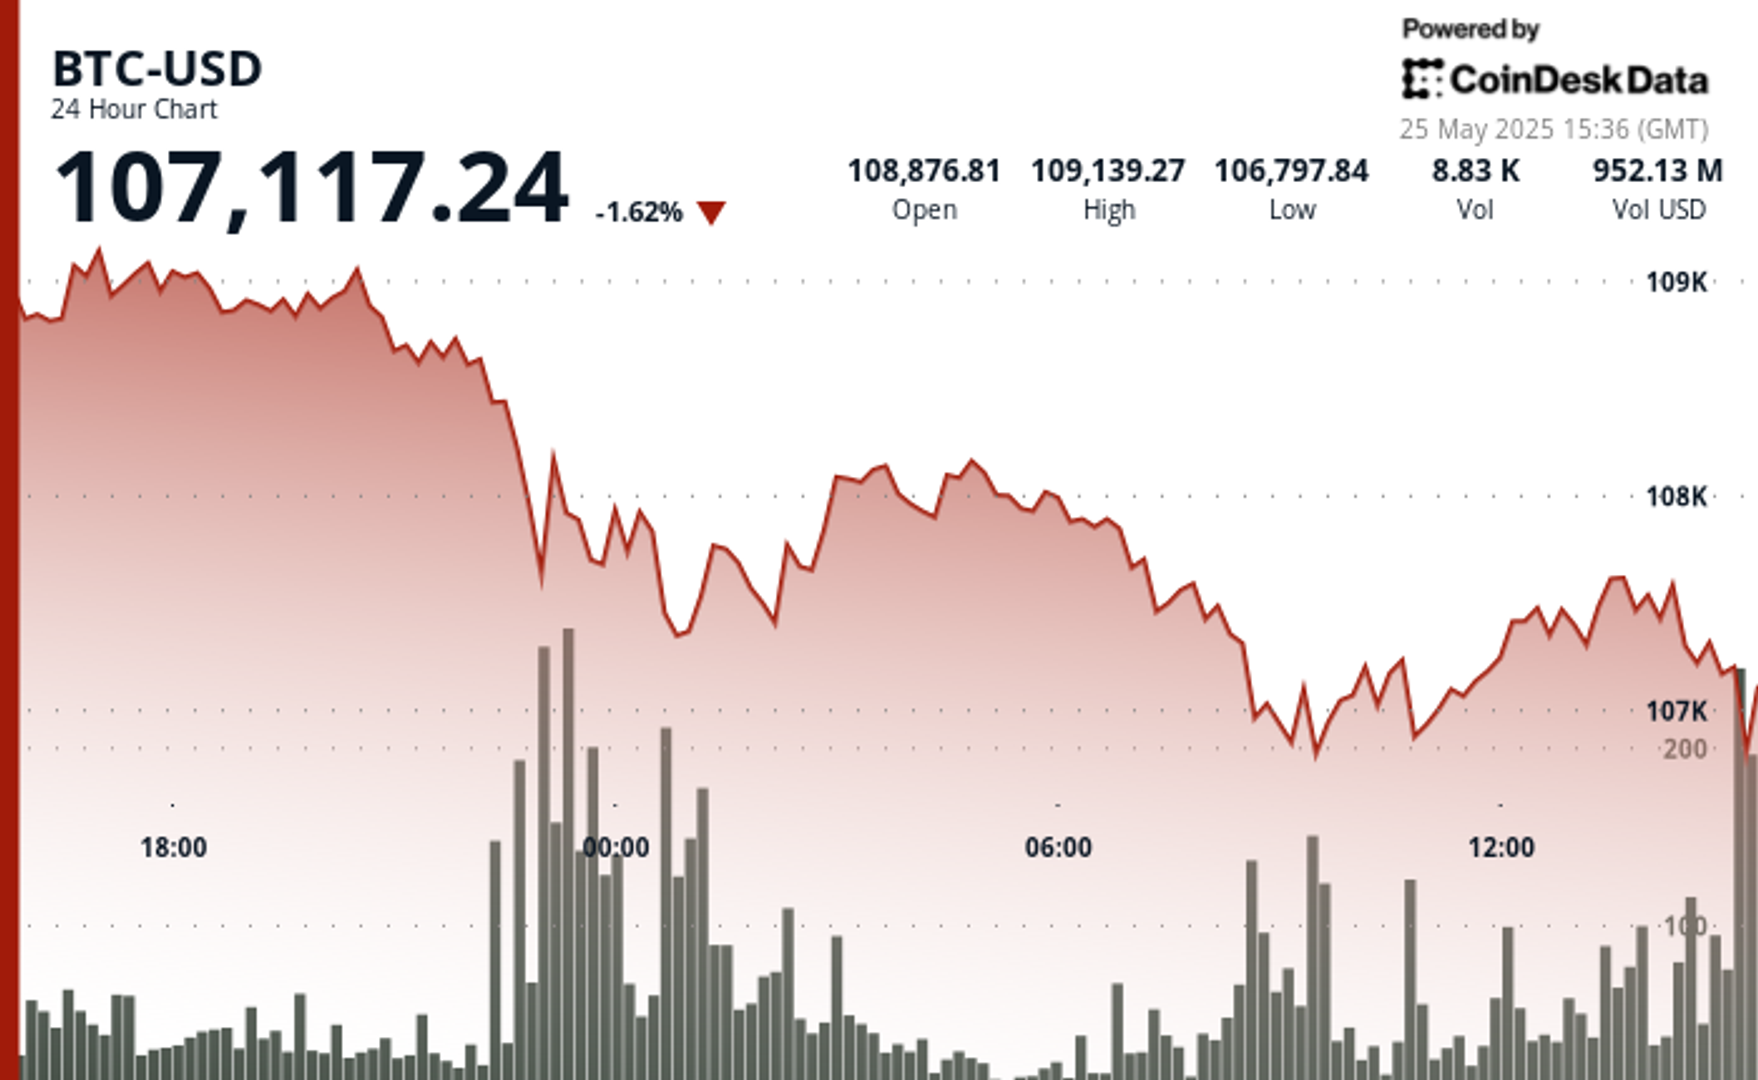
Bitcoin’s recent pullback has established strong volume-based resistance near $108,300, with support forming in the $106,700-$107,000 zone.
The correction accelerated with a notable price surge from $107,373 to $107,671 between 13:06-13:36, followed by a sharp reversal.
Technical analysis suggests Bitcoin is now trading within a compression zone, trapped between two major fair value gaps that will determine the upcoming market direction.
If bulls reclaim the $109K to $110K area, price could push toward resistance beyond $112K, while a break below $107,000 might test liquidity around $106K.
Technical Analysis Breakdown
- The decline accelerated during the 22:00-23:00 hour on May 24th with exceptionally high volume (16,335 BTC), establishing a strong volume-based resistance near $108,300.
- Support has formed in the $106,700-$107,000 zone where buyers emerged during the 09:00-10:00 period on May 25th, though recovery attempts have been modest with price consolidating around $107,500.
- The overall technical structure suggests a short-term bearish trend with potential for further consolidation before directional clarity emerges.
- Bitcoin experienced significant volatility with a notable price surge from $107,373 to $107,671 between 13:06-13:36, followed by a sharp reversal that saw prices decline to $107,393 by 14:00.
- The most substantial price movement occurred during the 13:35 minute candle where BTC jumped nearly $150 with exceptionally high volume (148.76 BTC), establishing temporary resistance around $107,630.
- Support formed near $107,400 where buyers emerged during the final minutes of the period, though the overall technical structure suggests continued consolidation within the broader correction from the $109,239 high.
External References
- «Bitcoin Price Prediction for May 25: Will Bulls Defend $108K or Is a Deeper Drop Ahead?«, Coin Edition, published May 24, 2025.
- «Why is Bitcoin Price Dropping Now? Will BTC Price Go Down to $100K?«, CoinPedia, published May 24, 2025.
- «Bitcoin Price Analysis: BTC Displays Signs of Weakness Following New All-Time High«, CryptoPotato, published May 25, 2025.


Ethereum Surges After Holding $2,477, Fueled by Very Heavy Trading Volume

XRP Plunges Below $2.30 Amid Heavy Selling Pressure

Bitcoin Drops Below $107.5K as Trump Tariff Threat Triggers Crypto Sell-Off
-

 Fashion7 месяцев ago
These \’90s fashion trends are making a comeback in 2017
-
Entertainment7 месяцев ago
The final 6 \’Game of Thrones\’ episodes might feel like a full season
-
Fashion7 месяцев ago
According to Dior Couture, this taboo fashion accessory is back
-
Entertainment7 месяцев ago
The old and New Edition cast comes together to perform
-
Business7 месяцев ago
Uber and Lyft are finally available in all of New York State
-
Sports7 месяцев ago
Phillies\’ Aaron Altherr makes mind-boggling barehanded play
-
Sports7 месяцев ago
Steph Curry finally got the contract he deserves from the Warriors
-
Entertainment7 месяцев ago
\’Better Call Saul\’ has been renewed for a fourth season