Uncategorized
These Six Charts Explain Why Bitcoin’s Recent Move to Over $100K May Be More Durable Than January’s Run

Bitcoin BTC is trading above $100,000 again, and investors, prone to recency bias, may be quick to assume that this event will play out like it did in December-January, when the bull momentum faded, with prices quickly falling back into six figures, eventually dropping as low as $75,000.
However, according to the following six charts, the bitcoin market now appears sturdier than in December-January, suggesting a higher probability of a continued move higher.
Financial conditions: (DXY, 10y, 30y yields vs BTC)
Financial conditions refer to various economic variables, including interest rates, inflation, credit availability, and market liquidity. These are influenced by the benchmark government bond yield, the U.S. 10-year Treasury yield, the dollar exchange rate and other factors.
Tighter financial conditions disincentivize risk-taking in financial markets and the economy, while easier conditions have the opposite effect.
As of writing, financial conditions, represented by the 10-year yield and the dollar index, appear much easier than in January, favoring a sustained move higher in BTC.
")
At press time, the dollar index, which measures the greenback’s value against major currencies, stood at 99.60, down 9% from highs above 109.00 in January. The yield on the U.S. 10-year Treasury note stood at 4.52%, down 30 basis points from the high of 4.8% in January.
The 30-year yield has risen above 5%, revisiting levels seen in January, but is largely seen as positive for bitcoin and gold.
More dry powder
The combined market capitalization of the top two USD-pegged stablecoins, USDT and USDC, has reached a record high of $151 billion. That’s nearly 9% higher than the average $139 billion in December-January, according to data source TradingView.
In other words, a greater amount of dry powder is now available for potential investments in bitcoin and other cryptocurrencies.
")
Bold directional bets
BTC’s run higher from early April lows near $75,000 is characterized by institutions predominantly taking bullish directional bets rather than arbitrage bets.
That’s evident by the booming inflows into the U.S.-listed spot bitcoin exchange-traded funds (ETFs) and the still subdued open interest in the CME BTC futures.
According to data source Velo, the notional open interest in the CME bitcoin futures has jumped to $17 billion, the highest since Feb. 20. Still, it remains well below the December high of $22.79 billion.
")
On the contrary, the cumulative inflows into the 11 spot ETFs now stand at a record $42.7 billion versus $39.8 billion in January, according to data source Farside Investors.
No signs of speculative fervor
Historically, interim and major bitcoin tops, including the December-January one, have been characterized by speculative fervour in the broader market, leading to a sharp rise in market valuations for non-serious tokens such as DOGE and SHIB.
There are no such signs now, with the combined market cap of DOGE and SHIB well below their January highs.
")
No signs of overheating
The bitcoin perpetual futures market shows demand for bullish leveraged bets, understandably so, considering BTC is trading near record highs.
However, the overall positioning remains light, with no signs of excess leverage build-up or bullish overheating, as evidenced by funding rates hovering well below highs seen in December.
")
The chart shows funding rates, which refer to the cost of holding perpetual futures bets. The positive figure indicates a bias for longs and willingness among the bulls to pay shorts to keep their positions open. It’s a sign of bullish market sentiment.
Implied volatility suggests calm
The bitcoin market appears much calmer this time, with Deribit’s DVOL index, measuring the 30-day expected or implied volatility, significantly lower than levels observed in December-January and March 2024 price tops.
The low IV suggests traders are not pricing in the extreme price swings or uncertainty that typically exists in an overheated market, indicating a more measured and potentially more sustainable uptrend.
")
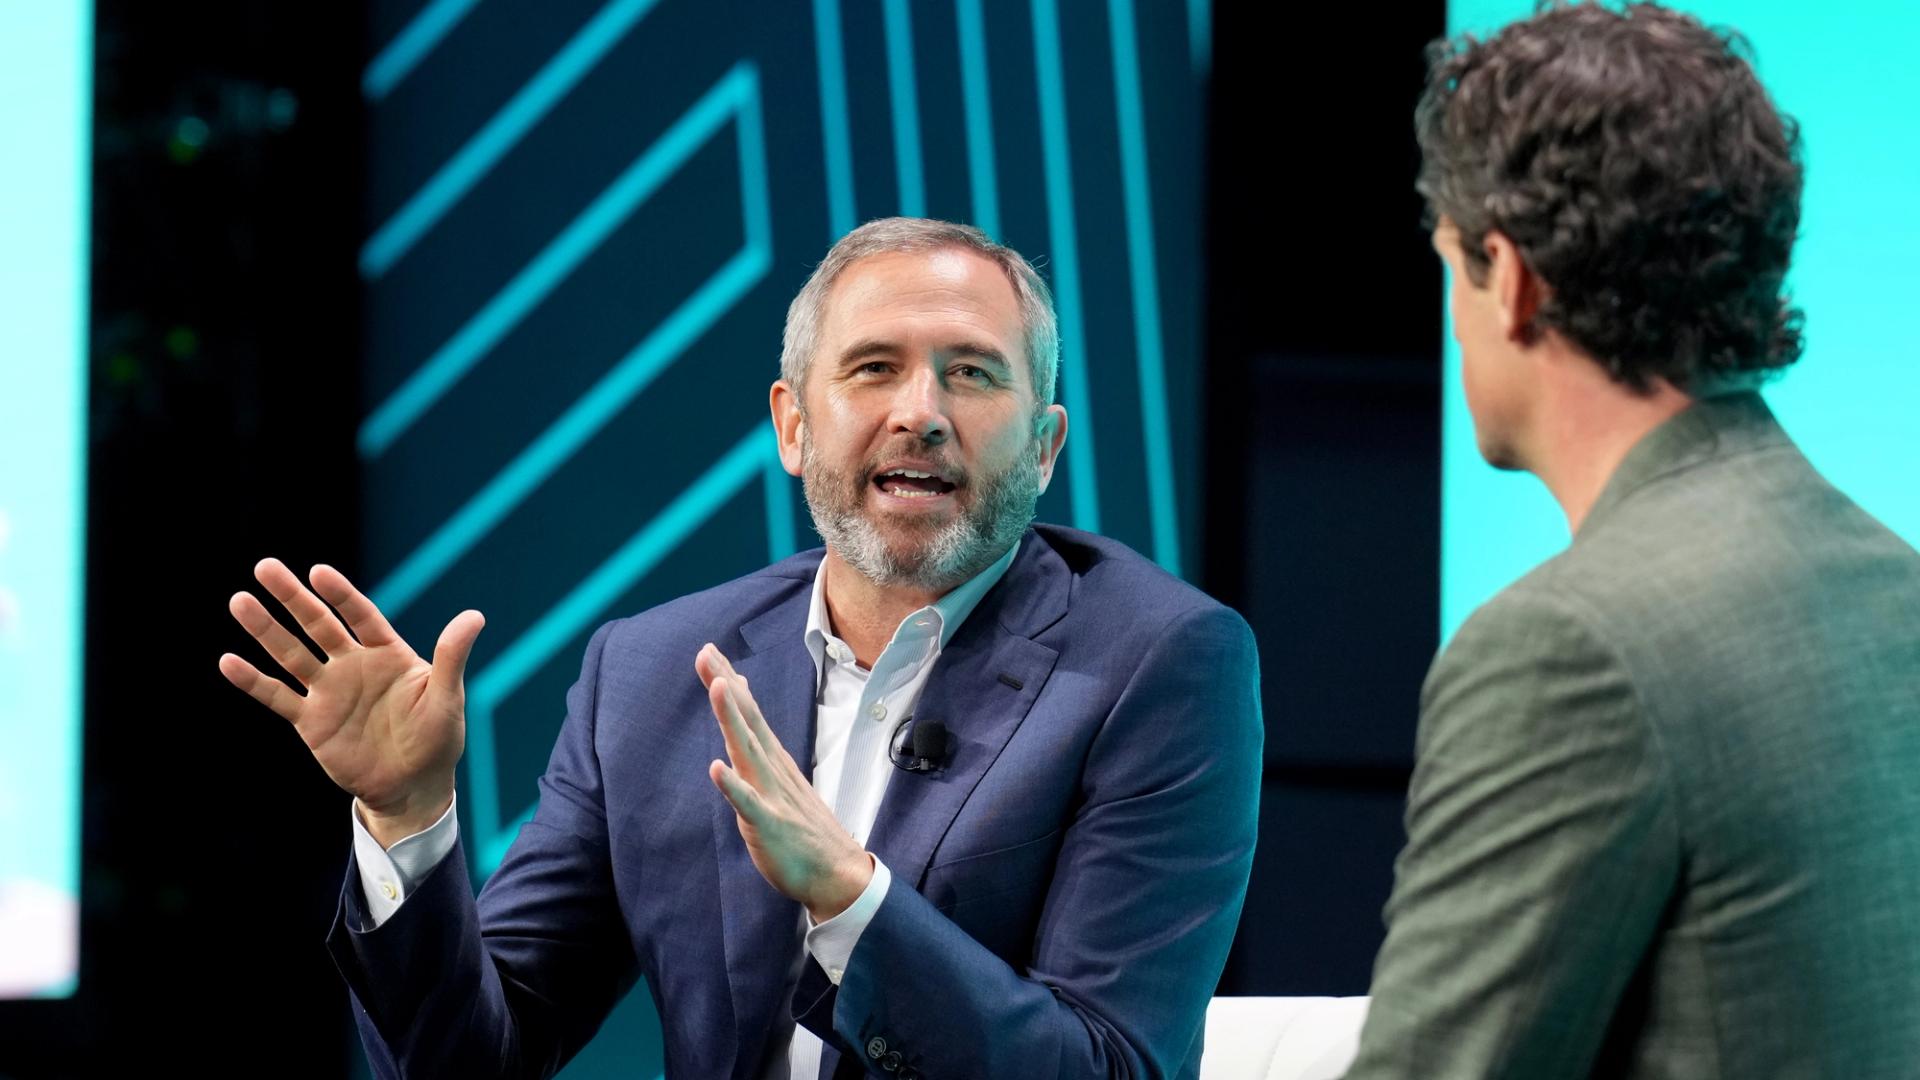
SINGAPORE – Brad Garlinghouse, CEO of crypto company Ripple Labs, stated at the XRP Ledger Apex, the Ripple (XRP) community conference in Singapore, that he remains bullish on stablecoins – a sentiment he said is reinforced by the recent blockbuster Circle CRCL initial public offering (IPO).
«Circle IPO’s clearly went very well. That’s a reflection of investor interest in crypto, both institutions and retail. The financial future will be blockchain-based,» Garlinghouse said at Apex.
Garlinghouse said that one factor in the success of Circle’s IPO is the market’s fundamental belief that the GENIUS Act – the U.S. stablecoin legislation – will pass.
As CoinDesk previously reported, the GENIUS Act, a stablecoin regulatory bill, is poised for imminent Senate passage with bipartisan support, potentially moving to the House and becoming law by August recess.
«Regulatory headwinds have now become tailwinds in the U.S., and that’s good for the global landscape,» Garlinghouse continued. «It’s not deregulation that we want, and we are asking for clear regulation, and progress is evident.»
Other jurisdictions have also recently passed stablecoin legislation, such as Hong Kong. Korea’s new administration is also said to be working on a stablecoin bill.
Garlinghouse declined to comment on a potential Ripple-Circle merger or acquisition.
Apex continues in Singapore through Wednesday.
Uncategorized
Asia Morning Briefing: Coinbase Premium, Not Bank of Japan Rates, Might be the Metric to Watch for BTC

Bitcoin BTC is trading at $109.7K as the Wednesday trading day begins in Asia, according to CoinDesk market data.
While the world’s largest digital asset is trading flat in the early hours of the session, CoinDesk market data shows that it’s up 4% on the week.
An expected Bank of Japan rate cut isn’t doing that much to move the market, even though a low interest rate policy is usually what drives risk-on sentiment and positively impacts BTC prices.
One metric to watch instead is the ‘Coinbase Premium’. Tracked by CryptoQuant, it measures the price difference between BTC on Coinbase Pro (USD) and Binance (USDT), demonstrating the dollar demand for bitcoin (as opposed to crypto-native demand).
")
«The Coinbase Premium is gradually rising, indicating that buying pressure from U.S. investors is supporting the trend,» CryptoQuant analysts wrote in a recent update. «Additionally, whale buying activity is being observed incrementally.»
Part of this movement would include BTC ETF inflow, which has hit $386.27 million so far this week, according to SoSoValue data.
That being said, some market observers are concerned that a staked ether exchange-traded fund (ETF), which may be close to getting approved, could put a damper on institutional BTC interest.
Youwei Yang, chief economist at BIT Mining, says that an ETF that gives investors access to ETH yield from staking would be something that BTC ETFs can’t match, as they just give exposure to price appreciation.
«This has created a lot of buzz, especially considering how much of bitcoin’s rally was fueled by ETF hype,» Yang said. «And let’s be honest: while there’s speculation around Solana or Litecoin ETFs, Ether is still the only other crypto asset with a real existence in U.S. spot ETF. That makes it a go-to option for institutions waiting and watching on the sidelines, ready to move when the timing feels right.»
But for now, it’s still a waiting game. At least until the BoJ’s move is official, as the usual crypto-natives like Arthur Hayes are counting on BTC going parabolic as a result.
DEX Volume Has Nearly Doubled in Past Year
Centralized Exchanges (CEXs) have always had their eyes on Decentralized Exchanges (DEXs) since the concept took off in 2018 with the advent of modern Automated Market Maker (AMM) engines – the technology at the center of the product category.
But as the year continues, and crypto mergers and acquisitions heat up maybe there’ll be a renewed interest in DEXs, considering the massive jump in volume on the platforms in the last year.
")
According to data from Messari, in the last year, trading volume on DEXs has jumped from around 6% of all volume to 12%. In May, that number got closer to 25% as up-and-coming DEX Hyperliquid caught the eye of the market, including crypto’s most aggressive traders.
But are DEXs and CEX’s competitors? No, says OKX President Hong Fang.
Speaking with CoinDesk earlier this year in the run-up to Consensus Hong Kong, Fang said that the two are complementary.
«The crypto-native audience will want to be able to use CEX for reliability and DEX for catching innovations,» she said at the time. «Such supply-demand dynamics will drive further adoption of DEX to enable innovation while supporting the gradual maturity of the crypto regulatory framework.»
News Roundup
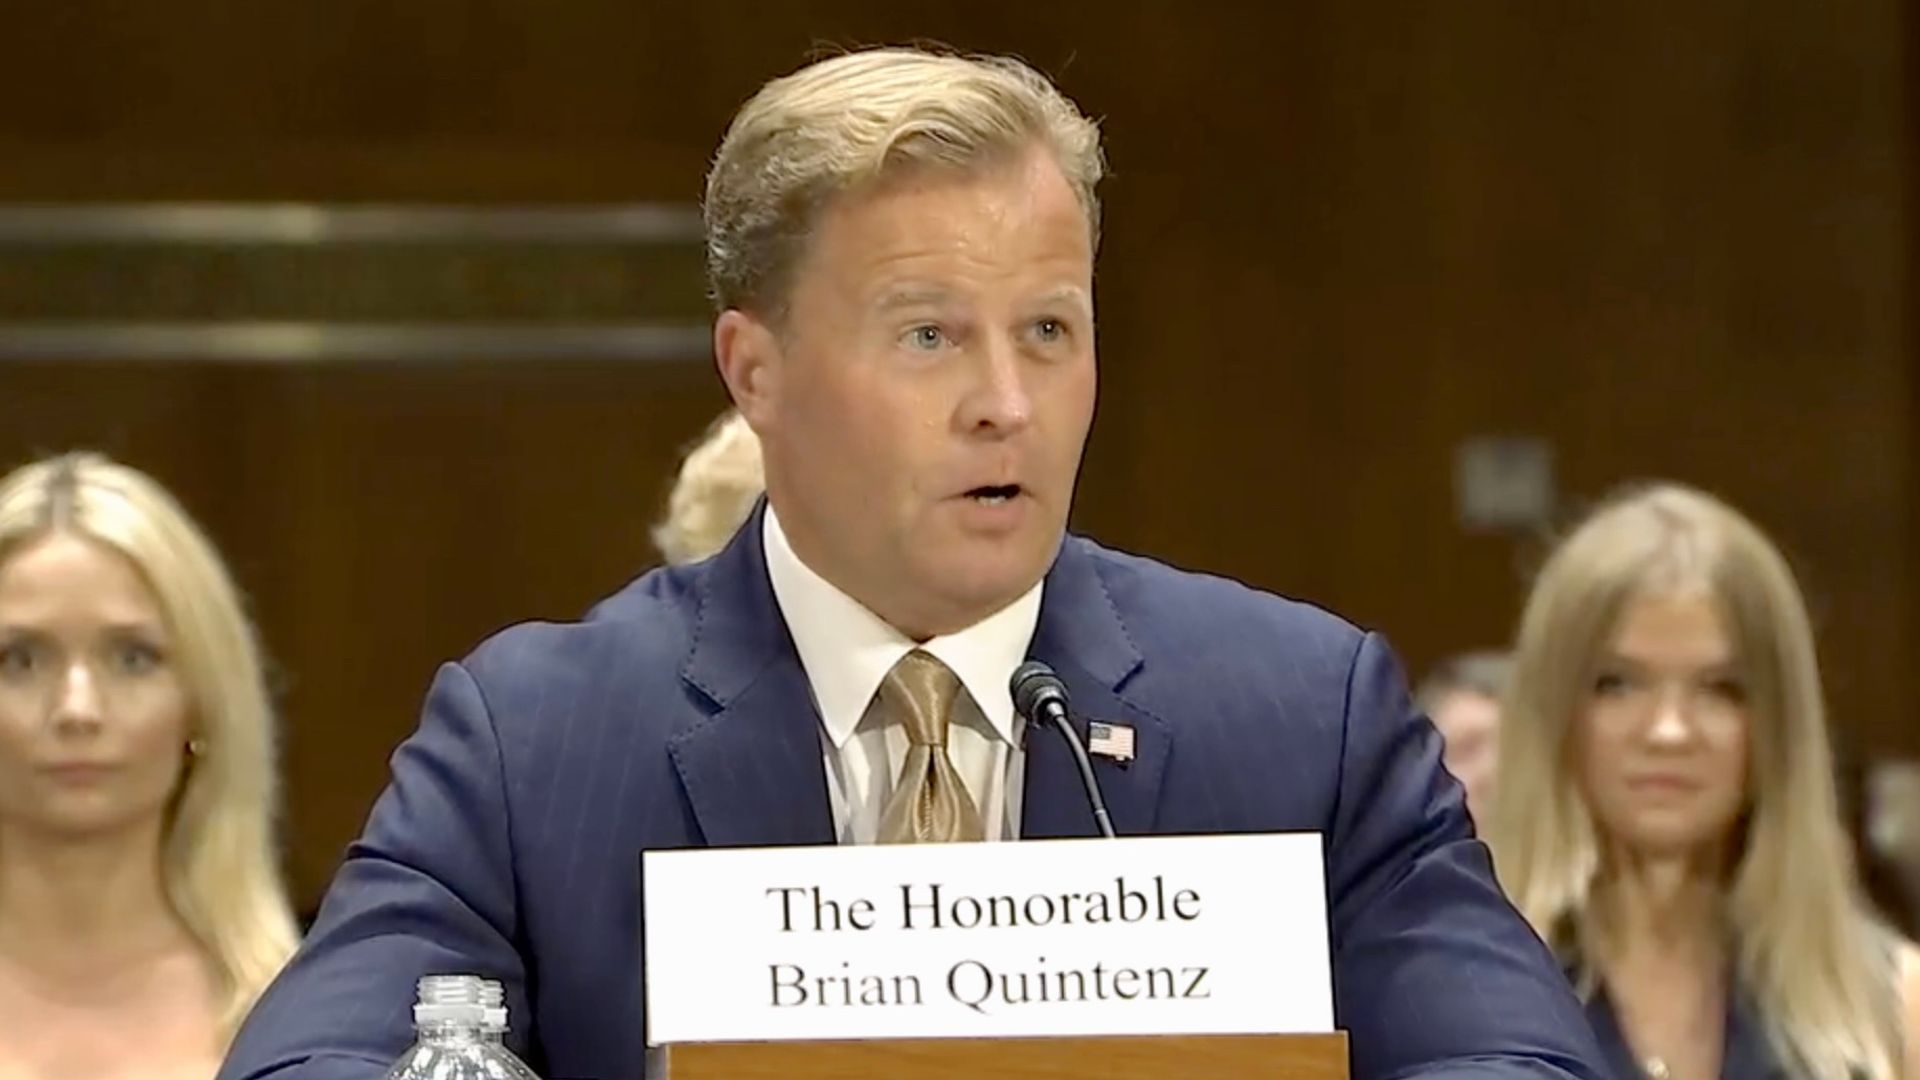
Trump’s CFTC Nominee Brian Quintenz Says Congress Key to Boosting Crypto Innovation and Consumer Protection
Brian Quintenz, President Trump’s nominee for chairman of the Commodity Futures Trading Commission (CFTC), emphasized at his Senate confirmation hearing that Congress must lead in establishing clear guidelines to boost crypto innovation and consumer protection simultaneously, CoinDesk previously reported.
Quintenz, who previously served as a CFTC commissioner and later as head of policy at venture capital firm a16z, argued that forthcoming market structure legislation could provide clarity needed for entrepreneurs while maintaining safeguards for consumers.
During his confirmation, senators expressed concerns about vacancies at the CFTC—particularly the absence of Democratic commissioners—but Quintenz declined to commit to advocating Trump to fill these positions, emphasizing presidential discretion. He acknowledged potential resource needs should the CFTC become the primary regulator for digital commodities, advocating a «technology-first approach» to enhance agency efficiency, and defended the role of prediction markets as legitimate tools for hedging and risk management.
Aave is Now on Sony’s Soneium
Aave has launched on Soneium, an Ethereum Layer-2 blockchain supported by electronics giant Sony, CoinDesk previously reported. This integration includes exploring real-world applications of Aave’s decentralized overcollateralized stablecoin, GHO, across payments, savings, and digital commerce.
Aave’s involvement will extend to liquidity incentive campaigns, notably partnering with Astar, a significant blockchain player in Japan’s Web3 scene, with a dedicated 100 million ASTR allocation ($4 million) to boost adoption.
Soneium already hosts a vibrant 7-million user ecosystem featuring prominent platforms like Uniswap v4, Velodrome, Stargate, and Lido, alongside native protocols Kyo Finance and SuperVol. Stani Kulechov, Aave Labs’ founder, emphasized Sony’s global trust and Soneium’s consumer-centric approach as key advantages, aligning with Aave’s strategy of expanding accessibility and mainstream reach.
Market Movements
- BTC: BTC trades below $110K as exchange reserves drop sharply, signaling strong accumulation amid significant short liquidations.
- ETH: Ethereum surged 6.9% to $2,803 amid triple-average trading volume, reflecting strong institutional conviction driven by significant ETF inflows and BlackRock’s sizable ETH accumulation.
- Gold: Spot gold neared $3,350 Tuesday, buoyed by cautious optimism over US-China trade talks despite a firmer US dollar.
- Nikkei 225: Asia-Pacific markets rose Wednesday amid optimism over «productive» U.S.-China trade talks, with Japan’s Nikkei 225 gaining 0.69% at open.
- S&P 500: The S&P 500 gained 0.6% Tuesday, approaching record highs above 6,000, buoyed by investor optimism on U.S.-China trade talks and Tesla’s rise amid Elon Musk’s robotaxi announcements.
Elsewhere in Crypto:
President Donald Trump’s pick to be chairman of the U.S. commodities watchdog, Brian Quintenz, fielded crypto questions more than any other topic at his Senate confirmation hearing on Tuesday, and he assured the lawmakers that the agency can walk a middle ground between unhampered innovation and robust consumer safeguards.
Even as Quintenz awaits the Senate Agriculture Committee’s vote on whether to advance his nomination as chairman of the Commodity Futures Trading Commission, Congress is working on market structure legislation that could elevate that agency as the marquee regulator of U.S. crypto activity. Quintenz, a former CFTC commissioner, is no stranger to that sector, having served as venture capital firm a16z’s head of policy.
«I have always viewed market structure legislation as an opportunity to be both pro-customer protection and pro-innovation at the same time,» he told the senators weighing his nomination, which ultimately needs to be approved by the overall Senate before he can take over the commission. He said the bill could «provide the clarity to buildings, entrepreneurs, innovators to develop products» while also ensuring the regulated firms are appropriately protecting the users of those products.
«Congress should create an appropriate market regulatory regime to ensure that this technology’s full promise can be realized, and I am fully prepared to use my experience and expertise to assist in that effort as well in executing any expanded mission should legislation pass into law,» Quintenz said, adding that he’s willing to work under the CFTC’s current powers «to provide clarity of how the agency’s statutory objectives could be successfully leveraged through this technology.»
Quintenz would join a commission that’s being abandoned by commissioners. By statute, the CFTC has five members — with three from the party in power — but the members have left or are in the process of leaving, including Acting Chairman Caroline Pham, who said she’s leaving when Quintenz starts work. The lone Democrat, Kristen Johnson, said she’ll depart «later this year,» leaving some uncertainty about her timing. So Quintenz may serve opposite a single Democrat before eventually working alone for a time, leaving potential legal vulnerability for any unilateral policies.
Some of the Democratic senators noted the Trump administration has been systematically stripping regulatory commissions of their Democratic members — described by Senator Raphael Warnock as «political purges» — and asked Quintenz if he would encourage the White House to fill both sides of the roster.
«The president is the head of the executive, and the president will make his own decisions. Quintenz said. He later added, «I don’t tell the president what to do.»
He granted that the agency may need more funding if it’s assigned the monumental new task as the regulator of digital commodities spot markets, which would include transactions of bitcoin BTC. Quintenz said that new staff would be made more efficient by «a technology-first approach» that makes the employees more efficient.
Quintenz also fielded a number of questions on the prediction markets, another area he’s had direct experience with as a board member of Kalshi, which fought a legal battle with the CFTC over the regulation of event contracts. He defended such event contracts as an appropriate «hedging tool.»
«I believe the Commodity Exchange Act is very clear about the purpose of derivatives markets, the purpose of risk management and price discovery, and that events [contracts] can serve a function in that mandate,» he said.
Read More: Trump to Tap Former CFTC Commissioner, a16z Policy Head Brian Quintenz for CFTC Head


Ripple’s Brad Garlinghouse Says Circle IPO Signals U.S. Stablecoin Regulation Ahead

Asia Morning Briefing: Coinbase Premium, Not Bank of Japan Rates, Might be the Metric to Watch for BTC

Trump’s CFTC Pick Says U.S. Can Boost Crypto Innovation and Shield Consumers
-

 Business8 месяцев ago
3 Ways to make your business presentation more relatable
-
Entertainment8 месяцев ago
10 Artists who retired from music and made a comeback
-
Fashion8 месяцев ago
According to Dior Couture, this taboo fashion accessory is back
-
Entertainment8 месяцев ago
\’Better Call Saul\’ has been renewed for a fourth season
-
Business8 месяцев ago
15 Habits that could be hurting your business relationships
-
Entertainment8 месяцев ago
Disney\’s live-action Aladdin finally finds its stars
-
Tech8 месяцев ago
5 Crowdfunded products that actually delivered on the hype
-
Entertainment8 месяцев ago
New Season 8 Walking Dead trailer flashes forward in time