Uncategorized
SOL: Nasdaq-Listed Firm Secures $200M in Financing, with Over $150M Tied to Solana Treasury Strategy
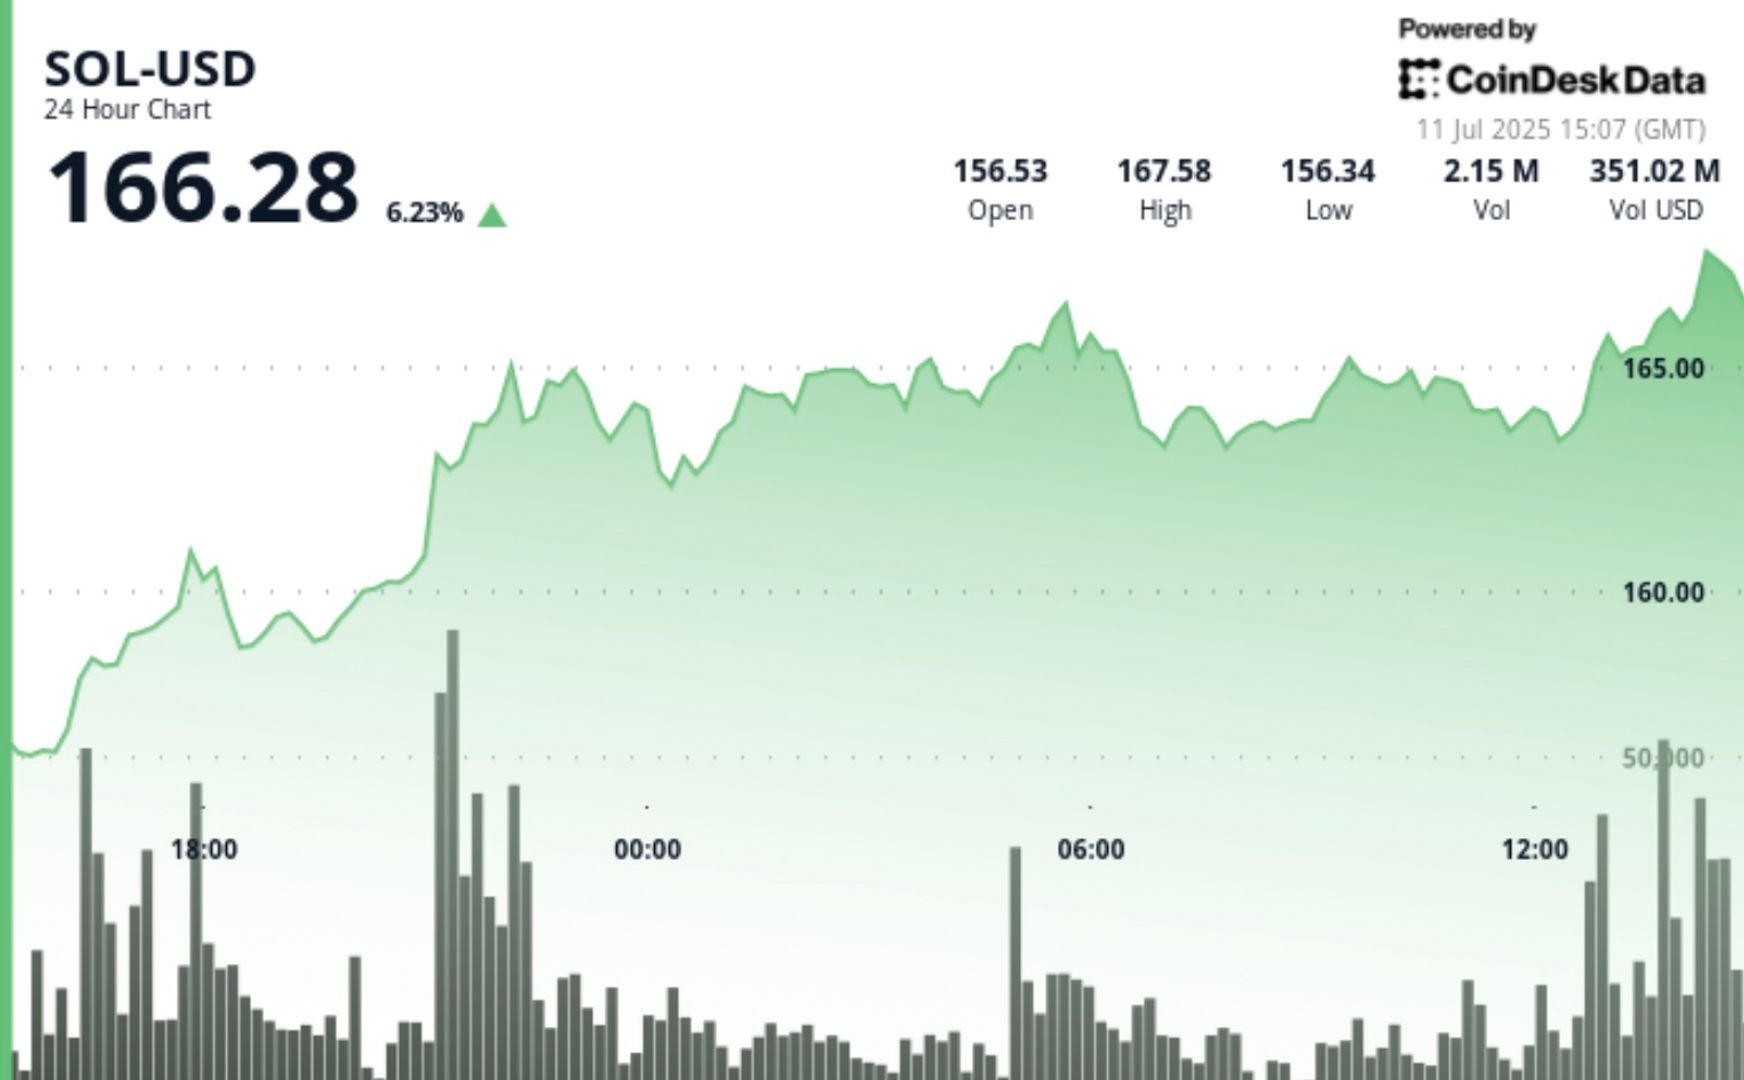
At the time of writing, solana (SOL) is trading at around $166.28, up 6.23% in the past 24-hour period, according to CoinDesk Research’s technical analysis model.
Upexi (UPXI), a Tampa-based consumer brands company listed on Nasdaq, announced Friday it has secured approximately $200 million in new financing through a combination of equity and convertible note offerings. A portion of the proceeds will support Upexi’s existing operations, while the rest will be used to grow its cryptocurrency treasury, with a specific focus on Solana (SOL).
As part of the equity component, Upexi raised $50 million from accredited and institutional investors, including its CEO Allan Marshall. Shares were sold at $4.00 each, with management purchasing at a premium of $4.94. The company said the equity deal is expected to close around July 14.
Separately, Upexi entered into agreements to issue $150 million in convertible notes to institutional investors. The notes are backed by SOL as collateral and carry a 2% annual interest rate. They are convertible into Upexi stock at a fixed price of $4.25 per share and mature in 24 months. The notes are expected to close around July 16, at which point the associated SOL will be added to the company’s holdings.
In a June 26 press release, Upexi disclosed that it held 735,692 SOL as of June 24, an 8% increase from the 679,677 SOL reported on May 28. Upon closing of the new financing, Upexi expects to more than double its current SOL position.
The offerings were conducted privately and are not registered with the SEC.
Technical Analysis
- SOL demonstrated exceptional resilience throughout the preceding 24-hour period from 10 July 15:00 to 11 July 14:00, progressing from $156.45 to $166.65, constituting a substantial 6.52% appreciation with an aggregate trading range of $10.99 extending from $155.78 to $166.76.
- The price dynamics unveiled distinctive accumulation sequences with considerable volume-backed support materialising at $160.31 during the 21:00 hour advancement, where extraordinary volume of 3.23 million substantially surpassed the 24-hour mean of 1.34 million, corroborating institutional capital deployment.
- Pivotal resistance emerged proximate to $165.30, subjected to multiple examinations between 22:00 and 03:00, whilst the conclusive breakthrough above $166.00 transpired with amplified volume of 2.26 million, intimating persistent bullish conviction.
- The technical architecture suggests SOL has consolidated a superior trading corridor with robust volume validation, establishing foundations for prospective advancement towards the $170.00 psychological threshold.
- Throughout the concluding 60-minute interval from 11 July 13:05 to 14:04, SOL encountered considerable volatility whilst preserving its overarching bullish disposition, oscillating within a $2.90 bandwidth from $164.24 to $166.76 and settling at $165.87, representing a marginal 0.44% contraction from the hour’s commencement at $165.92.
- The period manifested quintessential consolidation attributes encompassing two discrete phases: an initial retreat to $164.28 circa 13:33 accompanied by intensified distribution pressure of 45,017 volume, succeeded by a vigorous recovery commencing at 13:48 where volume escalated to 81,740 during the ascent towards $166.76, validating renewed accumulation interest.
- Fundamental support crystallised near $164.30 with multiple successful examinations, whilst resistance materialised around $166.50-$166.75, establishing a well-delineated trading corridor that suggests constructive price discovery following the antecedent 24-hour advance, positioning SOL for potential continuation of its broader upward trajectory upon completion of this consolidation phase.
Disclaimer: Parts of this article were generated with the assistance from AI tools and reviewed by our editorial team to ensure accuracy and adherence to our standards. For more information, see CoinDesk’s full AI Policy.

Good Morning, Asia. Here’s what’s making news in the markets:
Welcome to Asia Morning Briefing, a daily summary of top stories during U.S. hours and an overview of market moves and analysis. For a detailed overview of U.S. markets, see CoinDesk’s Crypto Daybook Americas.
Bitcoin (BTC) traded just above $115k in Asia Tuesday morning, slipping slightly after a strong start to the week.
The modest pullback followed a run of inflows into U.S. spot ETFs and lingering optimism that the Federal Reserve will cut rates next week. The moves left traders divided: is this recovery built on fragile foundations, or is crypto firmly back on track after last week’s CPI-driven jitters?
That debate is playing out across research desks. Glassnode’s weekly pulse emphasizes fragility. While ETF inflows surged nearly 200% last week and futures open interest jumped, the underlying spot market looks weak.
Buying conviction remains shallow, Glassnode writes, funding rates have softened, and profit-taking is on the rise with more than 92% of supply in profit.
Options traders have also scaled back downside hedges, pushing volatility spreads lower, which Glassnode warns leaves the market exposed if risk returns. The core message: ETFs and futures are supporting the rally, but without stronger spot flows, BTC remains vulnerable.
QCP takes the other side.
The Singapore-based desk says crypto is “back on track” after CPI confirmed tariff-led inflation without major surprises. They highlight five consecutive days of sizeable BTC ETF inflows, ETH’s biggest inflow in two weeks, and strength in XRP and SOL even after ETF delays.
Traders, they argue, are interpreting regulatory postponements as inevitability rather than rejection. With the Altcoin Season Index at a 90-day high, QCP sees BTC consolidation above $115k as the launchpad for rotation into higher-beta assets.
The divide underscores how Bitcoin’s current range near $115k–$116k is a battleground. Glassnode calls it fragile optimism; QCP calls it momentum. Which side is right may depend on whether ETF inflows keep offsetting profit-taking in the weeks ahead.
")
Market Movement
BTC: Bitcoin is consolidating near the $115,000 level as traders square positions ahead of expected U.S. Fed policy moves; institutional demand via spot Bitcoin ETFs is supporting upside
ETH: ETH is trading near $4500 in a key resistance band; gains are being helped by renewed institutional demand, tightening supply (exchange outflows), and positive technical setups.
Gold: Gold continues to hold near record highs, underpinned by expectations of Fed interest rate cuts, inflation risk, and investor demand for safe havens; gains tempered somewhat by profit‑taking and a firmer U.S. dollar
Nikkei 225: Japan’s Nikkei 225 topped 45,000 for the first time Monday, leading Asia-Pacific gains as upbeat U.S.-China trade talks and a TikTok divestment framework lifted sentiment.
S&P 500: The S&P 500 rose 0.5% to close above 6,600 for the first time on Monday as upbeat U.S.-China trade talks and anticipation of a Fed meeting lifted stocks.
Elsewhere in Crypto

Wall Street giant Citigroup (C) has launched new ether (ETH) forecasts, calling for $4,300 by year-end, which would be a decline from the current $4,515.
That’s the base case though. The bank’s full assessment is wide enough to drive an army regiment through, with the bull case being $6,400 and the bear case $2,200.
The bank analysts said network activity remains the key driver of ether’s value, but much of the recent growth has been on layer-2s, where value “pass-through” to Ethereum’s base layer is unclear.
Citi assumes just 30% of layer-2 activity contributes to ether’s valuation, putting current prices above its activity-based model, likely due to strong inflows and excitement around tokenization and stablecoins.
A layer 1 network is the base layer, or the underlying infrastructure of a blockchain. Layer 2 refers to a set of off-chain systems or separate blockchains built on top of layer 1s.
Exchange-traded fund (ETF) flows, though smaller than bitcoin’s (BTC), have a bigger price impact per dollar, but Citi expects them to remain limited given ether’s smaller market cap and lower visibility with new investors.
Macro factors are seen adding only modest support. With equities already near the bank’s S&P 500 6,600 target, the analysts do not expect major upside from risk assets.
Read more: Ether Bigger Beneficiary of Digital Asset Treasuries Than Bitcoin or Solana: StanChart

Stellar’s XLM token endured sharp swings over the past 24 hours, tumbling 3% as institutional selling pressure dominated order books. The asset declined from $0.39 to $0.38 between September 14 at 15:00 and September 15 at 14:00, with trading volumes peaking at 101.32 million—nearly triple its 24-hour average. The heaviest liquidation struck during the morning hours of September 15, when XLM collapsed from $0.395 to $0.376 within two hours, establishing $0.395 as firm resistance while tentative support formed near $0.375.
Despite the broader downtrend, intraday action highlighted moments of resilience. From 13:15 to 14:14 on September 15, XLM staged a brief recovery, jumping from $0.378 to a session high of $0.383 before closing the hour at $0.380. Trading volume surged above 10 million units during this window, with 3.45 million changing hands in a single minute as bulls attempted to push past resistance. While sellers capped momentum, the consolidation zone around $0.380–$0.381 now represents a potential support base.
Market dynamics suggest distribution patterns consistent with institutional profit-taking. The persistent supply overhead has reinforced resistance at $0.395, where repeated rally attempts have failed, while the emergence of support near $0.375 reflects opportunistic buying during liquidation waves. For traders, the $0.375–$0.395 band has become the key battleground that will define near-term direction.
")
Technical Indicators
- XLM retreated 3% from $0.39 to $0.38 during the previous 24-hours from 14 September 15:00 to 15 September 14:00.
- Trading volume peaked at 101.32 million during the 08:00 hour, nearly triple the 24-hour average of 24.47 million.
- Strong resistance established around $0.395 level during morning selloff.
- Key support emerged near $0.375 where buying interest materialized.
- Price range of $0.019 representing 5% volatility between peak and trough.
- Recovery attempts reached $0.383 by 13:00 before encountering selling pressure.
- Consolidation pattern formed around $0.380-$0.381 zone suggesting new support level.
Disclaimer: Parts of this article were generated with the assistance from AI tools and reviewed by our editorial team to ensure accuracy and adherence to our standards. For more information, see CoinDesk’s full AI Policy.


Asia Morning Briefing: Fragility or Back on Track? BTC Holds the Line at $115K

Wall Street Bank Citigroup Sees Ether Falling to $4,300 by Year-End

XLM Sees Heavy Volatility as Institutional Selling Weighs on Price
-

 Business11 месяцев ago
3 Ways to make your business presentation more relatable
-
Fashion11 месяцев ago
According to Dior Couture, this taboo fashion accessory is back
-
Entertainment11 месяцев ago
10 Artists who retired from music and made a comeback
-
Entertainment11 месяцев ago
\’Better Call Saul\’ has been renewed for a fourth season
-
Entertainment11 месяцев ago
New Season 8 Walking Dead trailer flashes forward in time
-
Business11 месяцев ago
15 Habits that could be hurting your business relationships
-
Entertainment11 месяцев ago
Meet Superman\’s grandfather in new trailer for Krypton
-
Entertainment11 месяцев ago
Disney\’s live-action Aladdin finally finds its stars