Uncategorized
Revolut to Strengthen Crypto Fraud Protections With Added Security, Risk Scores

Fintech giant Revolut plans to extend its battle-tested security wrapper, Revolut Pay, to crypto customers from the start of 2025 to improve protection against fraudulent attacks.
As it stands, Revolut says, there is limited visibility into card transactions and bank transfers its crypto customers make with exchanges, potentially exposing them to higher levels of fraud due to card mechanisms having limited anti-scam protections.
A 12-month pilot of firms using Revolut Pay’s enhanced due diligence, direct API integration and end-to-end control over the payment process showed crypto customers were exposed to about 50% fewer attempts to defraud them, Revolut said in a statement.
These enhancements include know-your-customer (KYC) name matching, fraud warning screens, proof of crypto delivery and the ability for crypto merchants to receive transaction risk scores.
Crypto has more than its fair share of fraudulent activity and scams, whether that involves identity theft, phishing scams and even the involvement of AI deep fakes and so on.
“In the crypto space, there’s a little bit of an issue with fraud outcomes,” said Alex Codina, general manager for merchant payments at Revolut in an interview. “Now, crypto firms, either exchanges or on-rampers, can integrate Revolut Pay as a payment method and by doing that we allow our users to directly buy crypto on those checkouts in a safer manner.”
Match your customer
Under the hood, the integration with third-party exchanges or on-ramps starts with KYC matching, so validating that the person who is buying on Revolut side is the same person who is KYC’d on the exchange’s side.
“If those names don’t match the transaction is rejected. In the card world, this would be the equivalent of a stolen card or something like that,” Codina said.
Beyond that, firms are in a running battle to combat a sophisticated array of investment scams, whereby customers are duped into thinking they need to perform some transaction or other to qualify for a fictitious reward of some kind, he added.
“These are the hardest ones to deal with,” Codina said. “Basically what we do is assess the risk score of the transaction based on information on our users, like if they have traded crypto in the past or not with Revolut, with a third party, and assess the probability of that transaction being part of an investment scam.”
Obviously, a balance has to be struck when it comes to user experience and safety, Codina said. The safety measures put in place by Revolut could be a question or two about the transaction, or in some cases the customer could be referred to a customer services manager to briefly chat about the transaction.
“We have a pretty robust model and framework where we can add some friction, depending on how risky we think the transaction is,” he said.
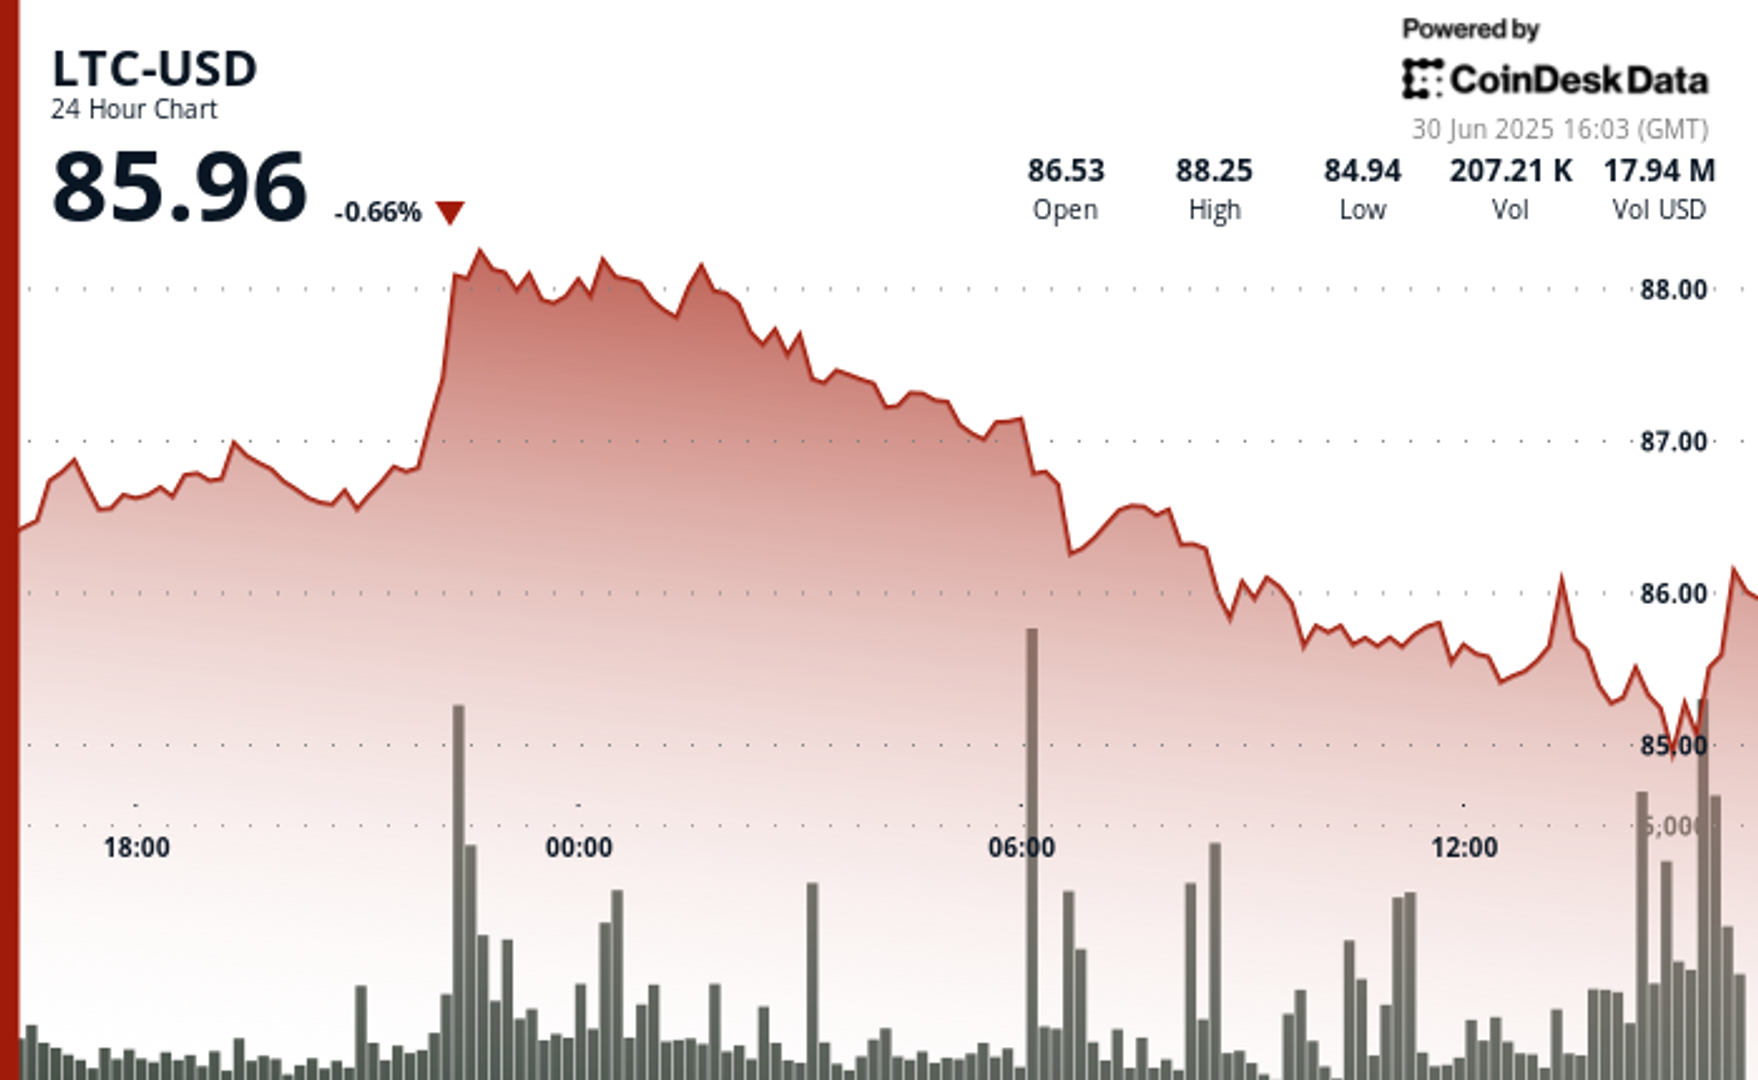
Litecoin (LTC) tried to punch above $88 during Monday’s trading session, but met a wall of sell orders near that level.
The token has since retreated to $85.21, down 3.17% since the session’s peak and 1.5% in the last 24-hour period. That stumble erased the week’s slim gains and set a new line in the sand for bulls.
The drop came at a time in which bitcoin (BTC) has been its dominance increase, while its volatility dropped below the 40 mark in a potential sign of incoming action.
Technical Analysis Overview
Litecoin’s price swung significantly in the last 24-hour period, covering a $3.05 range, or roughly 3.5%. The token encountered stiff resistance between $88.00 and $88.42, where sellers stepped in heavily, particularly during late evening trading hours, according to CoinDesk Research’s technical analysis data model.
After peaking, LTC reversed lower and found new support at $85.37. The steepest drop was accompanied by the session’s highest trading volume of over 180,000 tokens, signaling strong bearish sentiment.
Short-term trading saw additional volatility. In the last few hours of trading, LTC spiked from $85.65 to $86.05, a 0.47% jump, on a burst of buying. But momentum quickly reversed, sending prices back down to $85.53 on another volume spike.
This cemented resistance near $86.05 and reinforced the new support level at $85.37, leaving Litecoin at $85.42 as the session ended. Traders are watching these levels closely for clues on whether the asset will stage a recovery or slip lower in the days ahead.
The crypto industry’s political-finance arm, the towering campaign-funding entity known as Fairshake, dropped another $1 million into the coffers of a special-election candidate hoping to replace a Virginia Democrat who died in office, Representative Gerald Connolly.
The candidate favored by the industry’s chief political action committee, James Walkinshaw, won the Democrats’ so-called firehouse primary over the weekend, in which the party conducted its own polling to determine its chosen candidate among a field of nine. The general election to formally select the Fairfax County region’s next member of Congress is set for Sept. 9, though the Democrat incumbent took about two thirds of the vote in the regular election last year, giving Walkinshaw a heavy advantage.
«We look forward to James joining the growing, bipartisan coalition in Congress that understands the importance of securing America’s leadership in the next generation of technology,» said Josh Vlasto, a Fairshake spokesman, in a statement. He argued that the race again demonstrated that the electorate isn’t moved by critics who attempt to tarnish candidates who show support for the sector and are backed by its campaign resources, as at least one of Walkinshaw’s opponents sought to do.
Fairshake (and its affiliate super PACs, Defend American Jobs and Protect Progress) rose into prominence in the 2024 congressional elections as it amassed a huge war chest from major digital assets businesses, including Coinbase, Ripple and a16z. It devoted its campaign spending in outsized chunks that in some cases dwarfed what was spent by the opponents of the group’s chosen candidates. As a result, Fairshake added a long list of winners to the ranks of Congress’ crypto supporters in those elections, but it has continued its strategy in special elections as one-off contests seek to fill vacated seats such as Connolly’s.
In the case of Walkinshaw, Connolly’s former chief of staff, the spending came from Protect Progress, which focuses on Democrat candidates. While his former boss had voted routinely against crypto issues, Walkinshaw’s campaign site says the candidate favors an «embrace of the next generation of technology,» including blockchain, which the campaign said «can reduce administrative costs for businesses and lower fees for consumers.»
«Congress should establish modern, risk-based regulatory frameworks that support responsible innovation and prevent abuse,» according to Walkinshaw’s website.
The super PAC still has about $116 million on hand as the 2026 congressional election cycle approaches next year, Vlasto said. Current members of Congress it supported in the past round are already at work on major crypto bills that have been advancing this year.
Fairshake makes massive «independent expenditures» in political races, meaning their outside money buys advertising without approval or communication from the candidate. Though it represents crypto interests, the advertising purchased by the group almost never mentions the topic of digital assets, instead focusing on whatever political points are most likely to garner a win.
Read More: Crypto’s Fairshake Notches Latest Wins in Florida Congressional Races

Ripple officially introduced the XRP Ledger’s Ethereum Virtual Machine (EVM) sidechain to the mainnet in an bid to improve the ecosystem’s interoperability and allow developers to deploy their Ethereum-based decentralized applications (dapps) with the XRPL.
The development adds EVM-compatible smart contracts while maintaining a connection to the XRPL, giving developers access to the ecosystem at a low cost, Ripple said in a blog post. It is designed to eliminate the trade-off between EVM compatibility and XRPL’s own advantages, opening the door for dapps to lean into XRP’s payments infrastructure.
“The XRPL EVM Sidechain introduces a flexible environment for developers to deploy EVM-based applications, while maintaining a connection to the XRPL’s efficiency,” David Schwartz, Ripple’s chief technology officer and a co-creater of XRPL, said in the post. “It extends the capabilities of the ecosystem without changing the fundamentals that make the XRPL reliable.”
The sidechain operates as a separate blockchain that is parallel and connected to the XRP Ledger over the Axelar bridge, an interoperability protocol. XRPL’s native token, XRP (XRP), will serve as the native gas token for the sidechain.
The chain is designed specifically for developers, as they can now build and deploy their EVM-based applications, while accessing XRPL’s network of over 6 million wallet holders, Ripple said. The sidechain is planned to eventually also integrate with Wormhole, another interoperability protocol, allowing even more developers to access the XRP ecosystem.
Read more: Ripple Integrates Wormhole With XRP Ledger to Power Institutional Multichain Moves


Litecoin Slips Below $86 as Resistance Holds; Traders Watch Bitcoin Dominance

Industry’s PAC Keeps Seeking to Add Allies as Congress Hashes Out Crypto Legislation

XRPL EVM Sidechain Goes Live, Unlocking Ethereum Dapps in XRP Ecosystem
-

 Business9 месяцев ago
3 Ways to make your business presentation more relatable
-
Entertainment9 месяцев ago
10 Artists who retired from music and made a comeback
-
Fashion9 месяцев ago
According to Dior Couture, this taboo fashion accessory is back
-
Entertainment9 месяцев ago
\’Better Call Saul\’ has been renewed for a fourth season
-
Business9 месяцев ago
15 Habits that could be hurting your business relationships
-
Entertainment9 месяцев ago
Disney\’s live-action Aladdin finally finds its stars
-
Entertainment9 месяцев ago
New Season 8 Walking Dead trailer flashes forward in time
-
Tech9 месяцев ago
5 Crowdfunded products that actually delivered on the hype