Uncategorized
Polymarket Embroiled in $160M Controversy Over Whether Zelensky Wore a Suit at NATO

Crypto-focused prediction market Polymarket is facing a fresh dose of criticism this week in relation to a market on whether Ukrainian President Volodymyr Zelenskyy would wear a suit before July.
More than $160 million worth of crypto was bet on the market, with the initial outcome of «yes» being disputed by the validators behind UMA, the oracle protocol that determines the results.
The price of «yes» has now plummeted to $0.04 from $0.19, giving an implied probability of outcome at just 4%. The «yes» voters are striking back, claiming that Zelenskyy did indeed wear a suit at the NATO summit on June 24 and that there could be foul play by UMA validators to swing the decision.
The validators are holders of UMA protocol tokens, who get to vote on the veracity of the real-world data that’s encoded in the protocol’s oracle. In theory, a large-enough swathe of token-holders could manipulate a result to their own choosing.
This is not the first time there has been a divide between Polymarket and UMA communities. In March another Ukrainian-themed market was disputed amid claims of manipulation from large holders of UMA.
«We all know the whales are trying to rig the UMA vote on the Zelensky suit market,» X user Atlantislq wrote. «But that doesn’t mean we should stay silent. This is a critical moment Polymarket claims to care about truth and decentralization so let’s hold them to it.»
AI chat bot Grok took the side of «yes» voters, saying that «Zelenskyy wore a suit in June 2025.»
On the other side, popular menswear influencer and writer who goes by the moniker «derek guy» bet $3.6 million on the market resolving as «no.» He stands to make $72,000 if the bet is successful.
A final resolution on the market will be made at 00:00 UTC on July 8.

Crypto trading firm Keyrock said it’s expanding into asset and wealth management by acquiring Turing Capital, a Luxembourg-registered alternative investment fund manager.
The deal, announced on Tuesday, marks the launch of Keyrock’s Asset and Wealth Management division, a new business unit dedicated to institutional clients and private investors.
Keyrock, founded in Brussels, Belgium and best known for its work in market making, options and OTC trading, said it will fold Turing Capital’s investment strategies and Luxembourg fund management structure into its wider platform. The division will be led by Turing Capital co-founder Jorge Schnura, who joins Keyrock’s executive committee as president of the unit.
The company said the expansion will allow it to provide services across the full lifecycle of digital assets, from liquidity provision to long-term investment strategies. «In the near future, all assets will live onchain,» Schnura said, noting that the merger positions the group to capture opportunities as traditional financial products migrate to blockchain rails.
Keyrock has also applied for regulatory approval under the EU’s crypto framework MiCA through a filing with Liechtenstein’s financial regulator. If approved, the firm plans to offer portfolio management and advisory services, aiming to compete directly with traditional asset managers as well as crypto-native players.
«Today’s launch sets the stage for our longer-term ambition: bringing asset management on-chain in a way that truly meets institutional standards,» Keyrock CSO Juan David Mendieta said in a statement.
Read more: Stablecoin Payments Projected to Top $1T Annually by 2030, Market Maker Keyrock Says
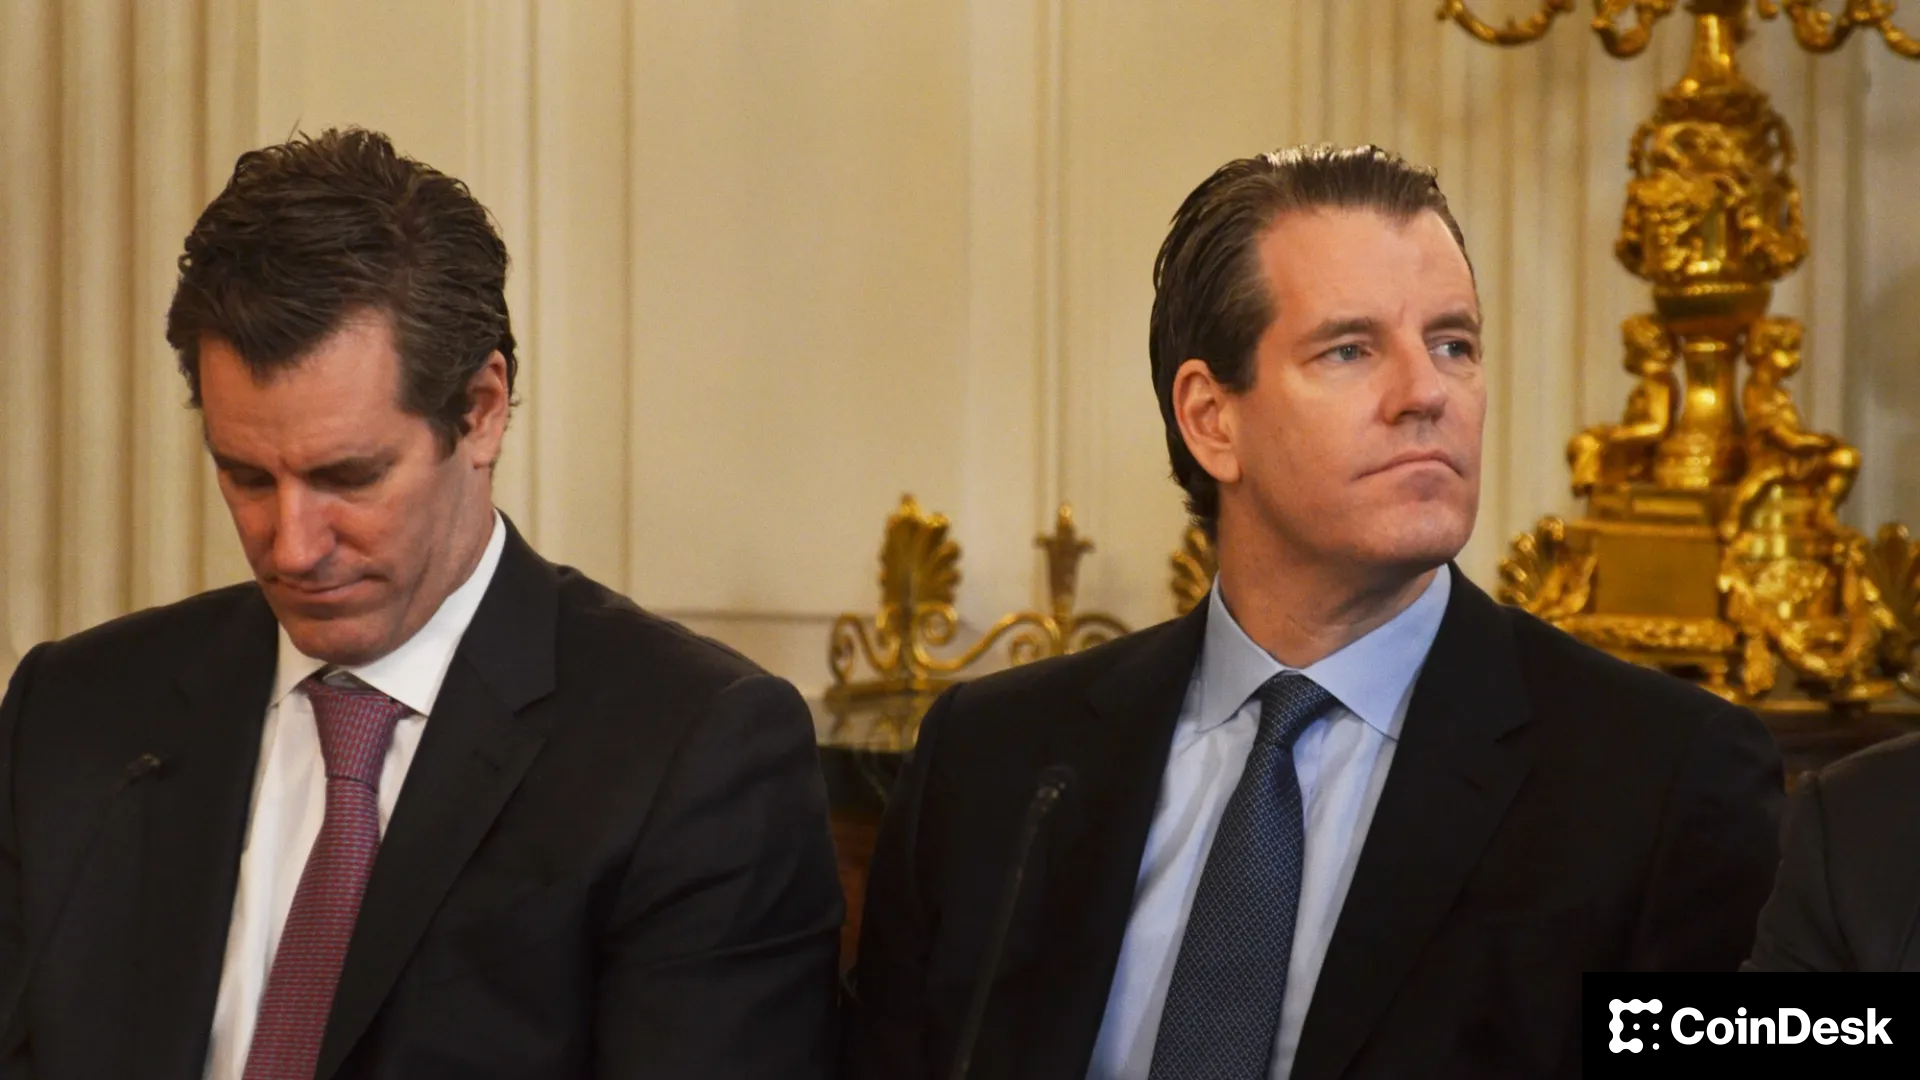
Gemini Space Station (GEMI), the crypto exchange founded by Cameron and Tyler Winklevoss, has seen its shares tumble by more than 20% since listing on the Nasdaq last Friday.
The stock is down around 6% on Tuesday, trading at $30.42, and has dropped nearly 24% over the past week. The sharp decline follows an initial surge after the company raised $425 million in its IPO, pricing shares at $28 and valuing the firm at $3.3 billion before trading began.
On its first day, GEMI spiked to $45.89 before closing at $32 — a 14% premium to its offer price. But since hitting that high, shares have plunged more than 34%, erasing most of the early enthusiasm from public market investors.
The broader crypto equity market has remained more stable. Coinbase (COIN), the largest U.S. crypto exchange, is flat over the past week. Robinhood (HOOD), which derives part of its revenue from crypto, is down 3%. Token issuer Circle (CRCL), on the other hand, is up 13% over the same period.
Part of the pressure on Gemini’s stock may stem from its financials. The company posted a $283 million net loss in the first half of 2025, following a $159 million loss in all of 2024. Despite raising fresh capital, the numbers suggest the business is still far from turning a profit.
Compass Point analyst Ed Engel noted that GEMI is currently trading at 26 times its annualized first-half revenue. That multiple — often used to gauge whether a stock is expensive — means investors are paying 26 dollars for every dollar the company is expected to generate in sales this year. For a loss-making company in a volatile sector, that’s a steep price, and could be fueling investor skepticism.


Crypto Trading Firm Keyrock Buys Luxembourg’s Turing Capital in Asset Management Push
Crypto Trading Firm Keyrock Buys Luxembourg’s Turing Capital in Asset Management Push

Gemini Shares Slide 6%, Extending Post-IPO Slump to 24%
-

 Business11 месяцев ago
3 Ways to make your business presentation more relatable
-
Fashion11 месяцев ago
According to Dior Couture, this taboo fashion accessory is back
-
Entertainment11 месяцев ago
10 Artists who retired from music and made a comeback
-
Entertainment11 месяцев ago
\’Better Call Saul\’ has been renewed for a fourth season
-
Entertainment11 месяцев ago
New Season 8 Walking Dead trailer flashes forward in time
-
Business11 месяцев ago
15 Habits that could be hurting your business relationships
-
Entertainment11 месяцев ago
Meet Superman\’s grandfather in new trailer for Krypton
-
Entertainment11 месяцев ago
Disney\’s live-action Aladdin finally finds its stars