Uncategorized
Long-Term Bitcoin Holders Have Sold 1M BTC Since September: Van Straten
Bitcoin (BTC) is currently trading 13% below its record high of around $108,000, the most since President-elect Donald Trump won the U.S. election in early November.
Since then, the largest cryptocurrency has spent several periods at 10% below the record, a level that some investors term a correction.

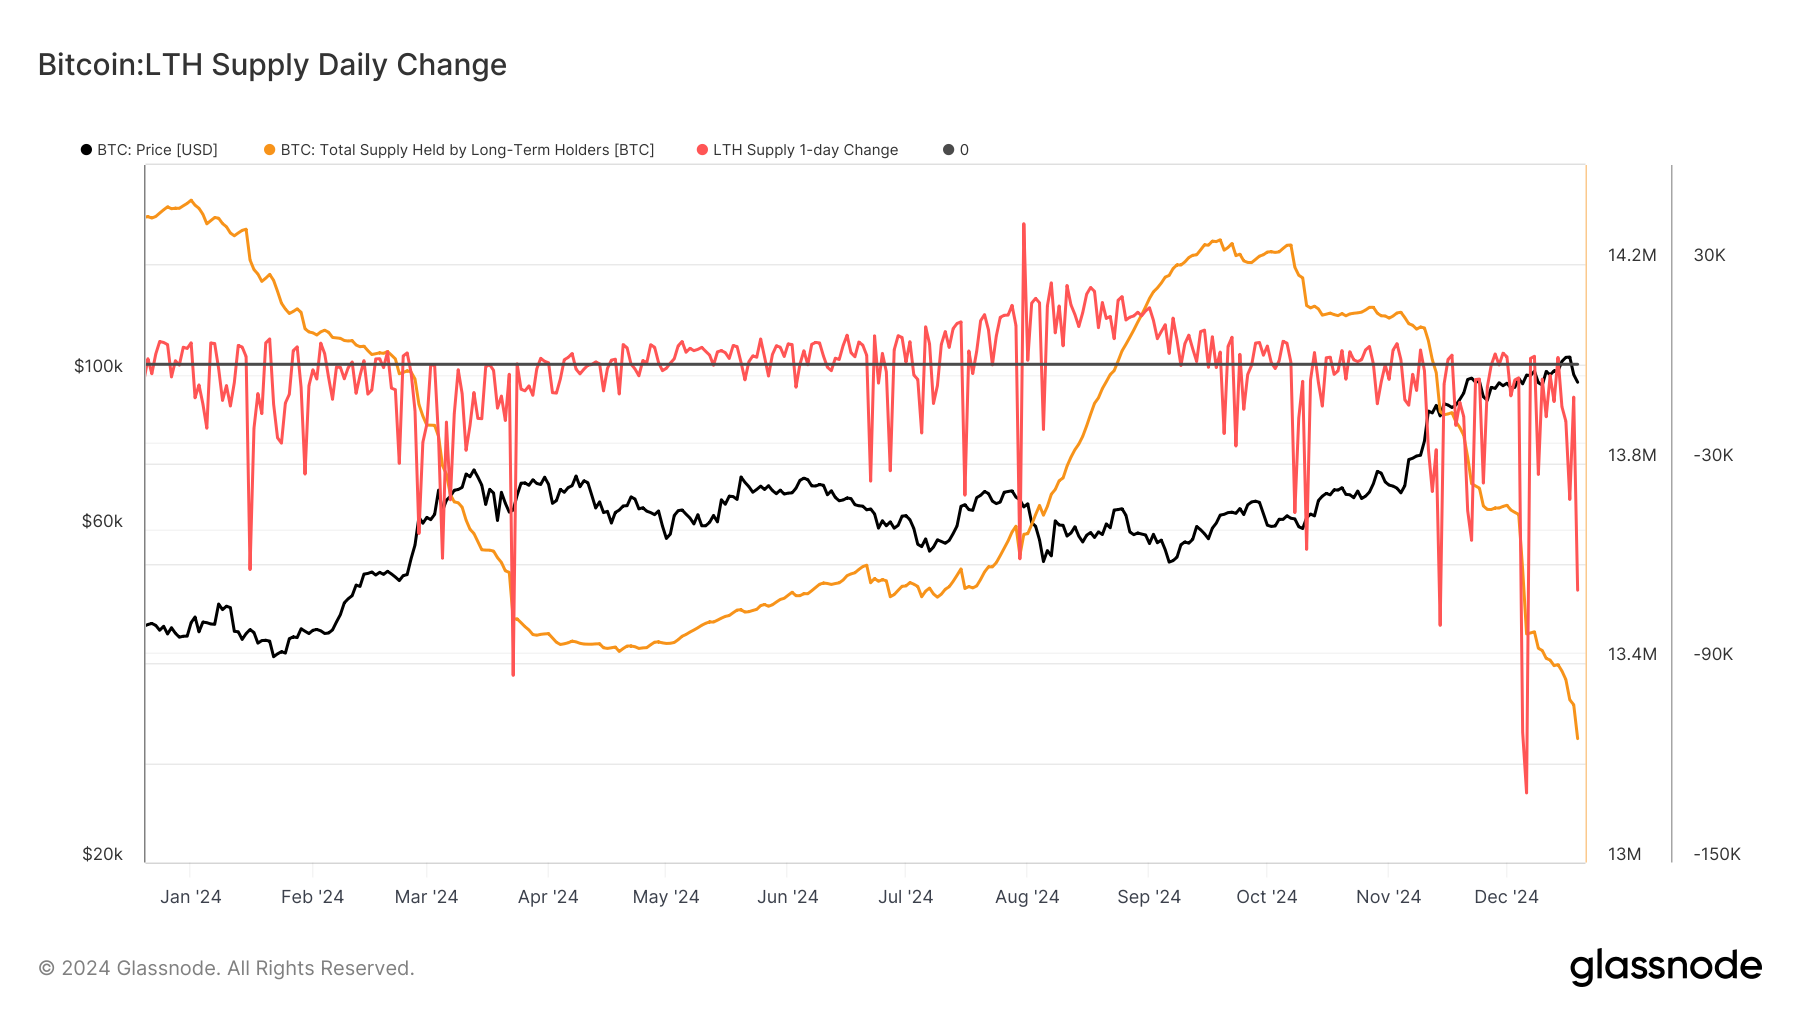
The selling pressure originates with long-term holders (LTHs), which Glassnode defines as investors who have held bitcoin for at least 155 days. They tend to sell into price strength after accumulating bitcoin when prices are depressed.
LTHs were already distributing a significant amount of BTC about a week ago, previous CoinDesk research showed. Since then, they’ve picked up the pace and have reduced their total holdings to about 13.2 million BTC from around 14.2 million in mid-September.
On Thursday, they sold almost 70,000 BTC, the fourth-biggest one-day sell-off this year, according to Glassnode data.
On the flip side, for every seller, there has to be a buyer. In this case, it’s the short-term holders (STHs) who have accumulated approximately 1.3 million BTC in the same time period. The number indicates they picked up coins from the LTHs and more.
In the past few days the narrative has changed and LTHs are looking to sell more than short-term traders are looking to buy. That imbalance has contributed to the price decline of around $94,500.
There are 19.8 million tokens in circulating supply and another 2.8 million sitting on exchanges, though that balance continues to fall: about 200,000 bitcoin has left exchanges in the past few months.
These cohorts are key to monitoring bitcoin’s price activity in the next few days.

Global economic tensions and trade disputes continue to influence cryptocurrency markets, with ETH showing resilience despite broader market uncertainty.
The second-largest cryptocurrency is currently navigating a critical technical zone between $2,500-$2,530, which analysts identify as immediate resistance that must be overcome for continued upward movement.
Institutional interest remains strong, with spot Ethereum ETFs recording consecutive days of positive inflows, signaling growing confidence from larger investors despite the recent volatility.
Technical Analysis Highlights
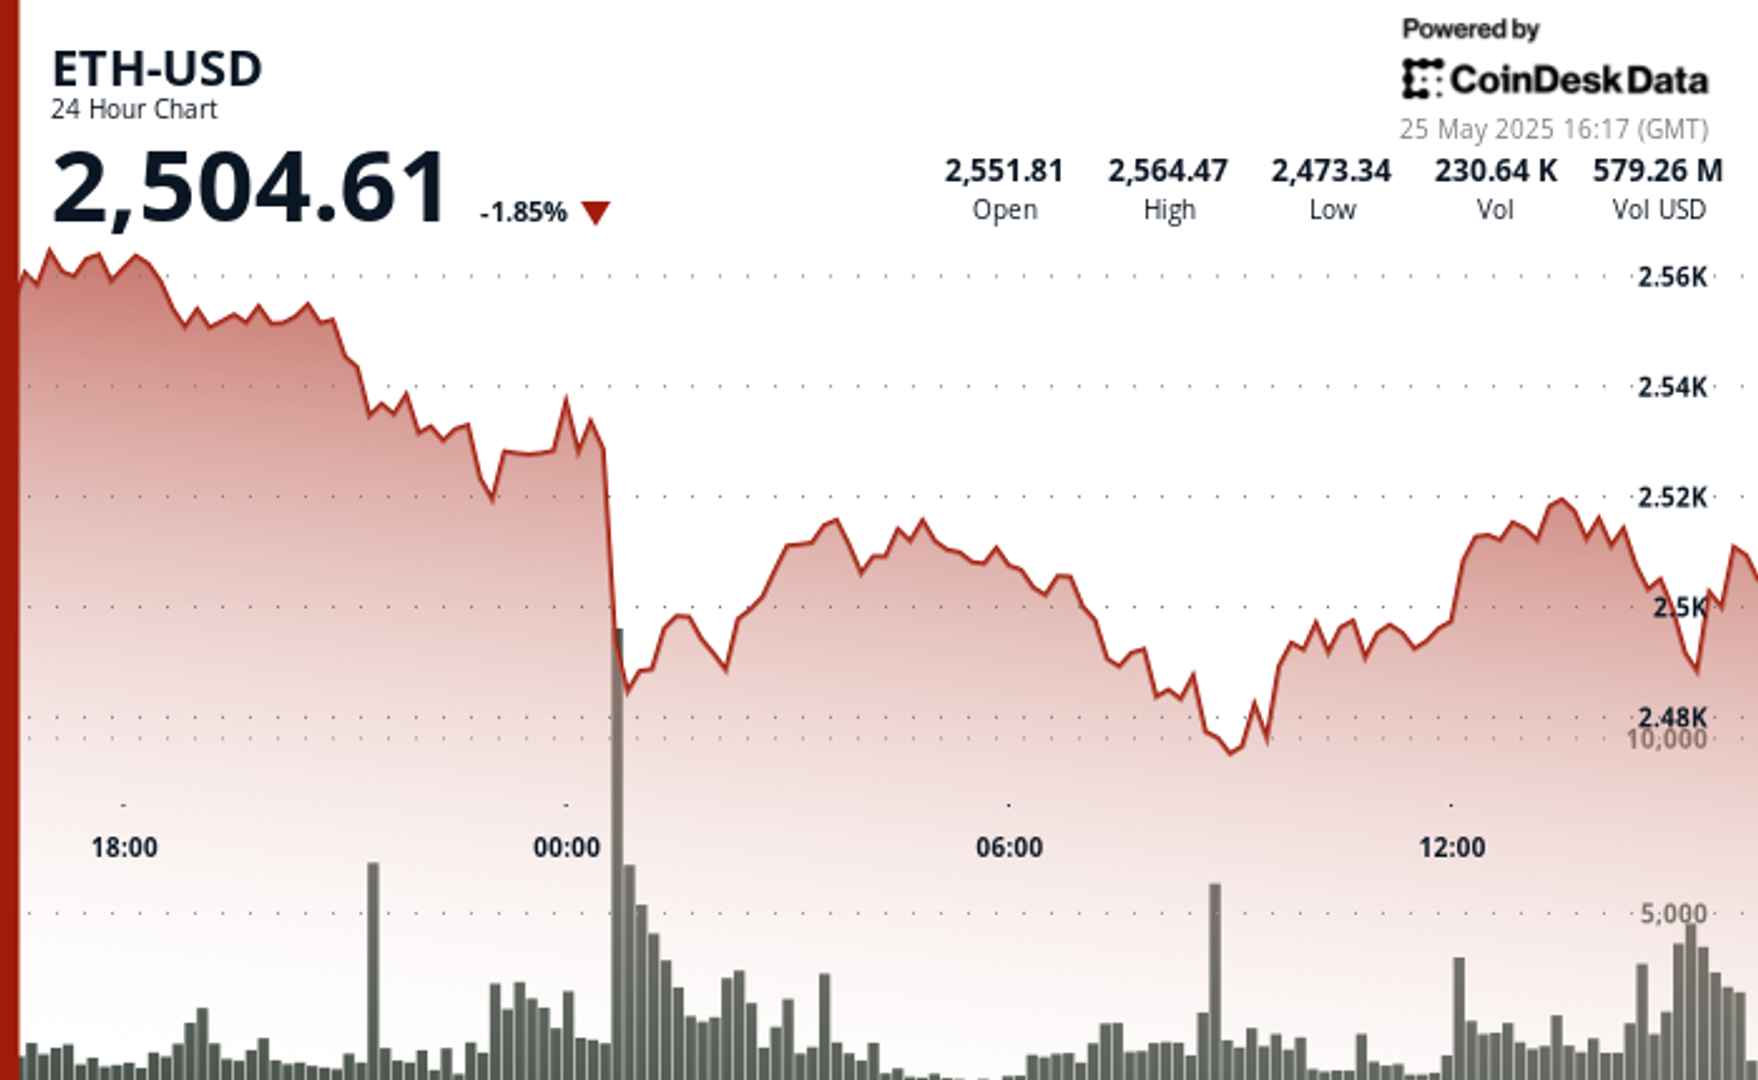
- 24-hour ETH price action revealed a substantial 3.5% range ($99.85).
- Sharp sell-off during midnight hour saw price plummet to $2,477.40, establishing a key support zone.
- Extraordinary volume (291,395 units, nearly 3x average) confirmed the significance of the support level.
- Buyers stepped in at the $2,467-$2,480 support band, confirmed by high-volume accumulation during the 08:00-09:00 period.
- Recent price action shows bullish momentum with ETH reclaiming the $2,515 level.
- Potential higher low pattern suggests the correction may have found its bottom.
- $2,520-$2,530 area remains the immediate resistance to overcome for continued upward movement.
- Significant bullish surge at 13:35 saw price jump from $2,515.85 to $2,521.79, accompanied by exceptional volume (5,839 units).
- Sharp reversal occurred at 14:00, with price dropping 5.07 points to $2,508.02 on heavy volume (4,043 units).
- Hourly range of 14.46 points ($2,508.02-$2,522.48) demonstrates market indecision.
External References
- «Ethereum Holds Above Key Prices – Data Points To $2,900 Level As Bullish Trigger«, NewsBTC, published May 24, 2025.
- «Ethereum Forms Inverse H&S – Bulls Eye Breakout Above $2,700 Level«, Bitcoinist, published May 25, 2025.
- «Ethereum Price Analysis: Is ETH Primed for a ‘Healthy’ Correction?«, CryptoPotato, published May 25, 2025.
Global economic tensions are weighing heavily on cryptocurrency markets as XRP experiences a significant correction amid heavy selling pressure.
The recent announcement of potential 50% tariffs on European Union imports by the US government has triggered widespread market uncertainty, with XRP falling alongside most major cryptocurrencies despite Bitcoin recently reaching new all-time highs.
Technical analysts point to critical support at the $2.25-$2.26 range, with market watchers warning that a break below this level could trigger deeper corrections toward the $1.55-$1.90 zone.
Meanwhile, institutional interest remains strong with Volatility Shares launching an XRP futures ETF and leveraged ETF inflows surging despite the price dip, suggesting Wall Street continues accumulating positions during market weakness.
Technical Analysis Highlights
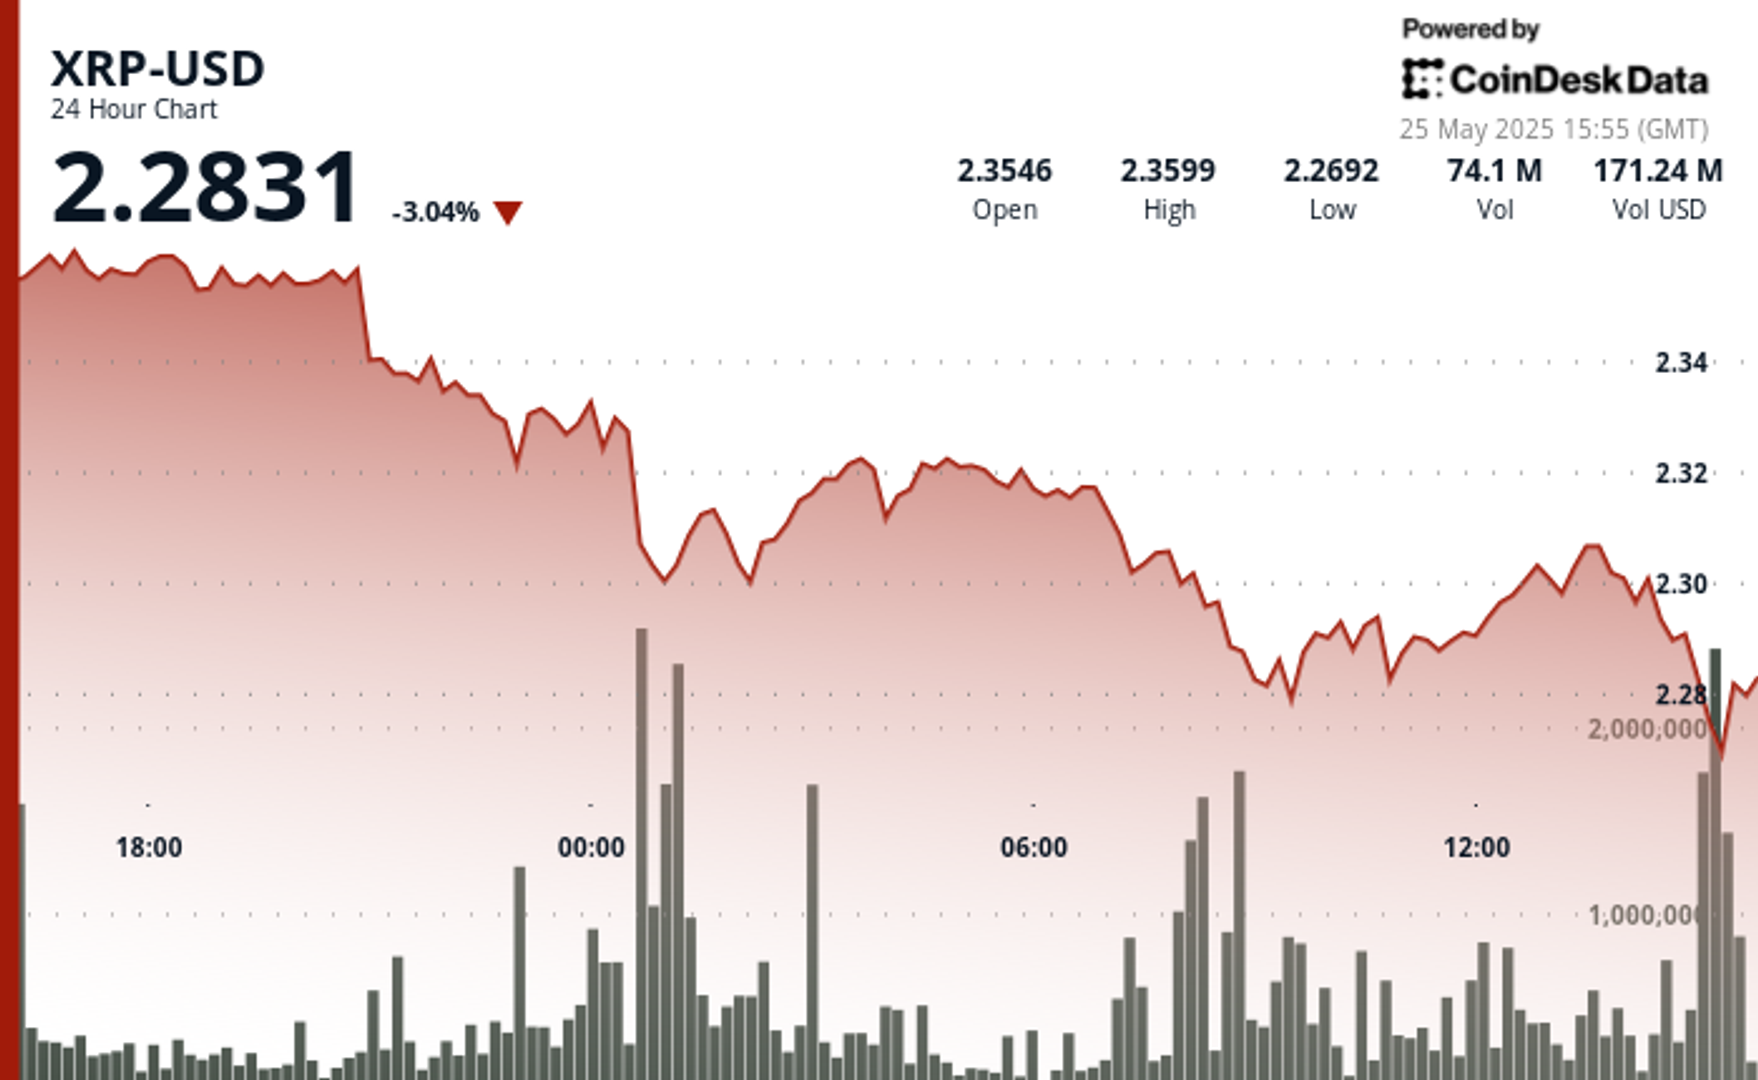
- XRP underwent a notable 3.46% correction over the 24-hour period, with price declining from $2.361 to $2.303, creating an overall range of $0.084 (3.57%).
- The most significant price action occurred during the midnight hour (00:00), when XRP plummeted to $2.297 on exceptionally high volume (37.1M), establishing a strong volume-based support zone.
- A secondary sell-off at 08:00 saw price touch the period low of $2.280 with the highest volume spike (39.9M), confirming a double-bottom formation.
- In the last hour, XRP experienced significant volatility with a recovery attempt following the earlier correction.
- After reaching a low of $2.297 at 13:11, price formed a base around $2.298 before staging a substantial rally beginning at 13:27, peaking at $2.307 at 13:36-13:39 with exceptionally high volume (627K-480K).
- This bullish momentum created a clear resistance zone at $2.307, which was tested multiple times.
- The final 15 minutes saw profit-taking pressure emerge, with price retracing to $2.300, establishing a short-term support level that aligns with the psychological $2.30 threshold.
External References
- «XRP Price Watch: Consolidation or Collapse? Market Holds Breath Near $2.35«, Bitcoin.com News, published May 24, 2025.
- «XRP Price Prediction For May 25«, CoinPedia, published May 25, 2025.
- «XRP Risks Fall To $1.55 If This Support Level Fails – Analyst«, NewsBTC, published May 25, 2025.
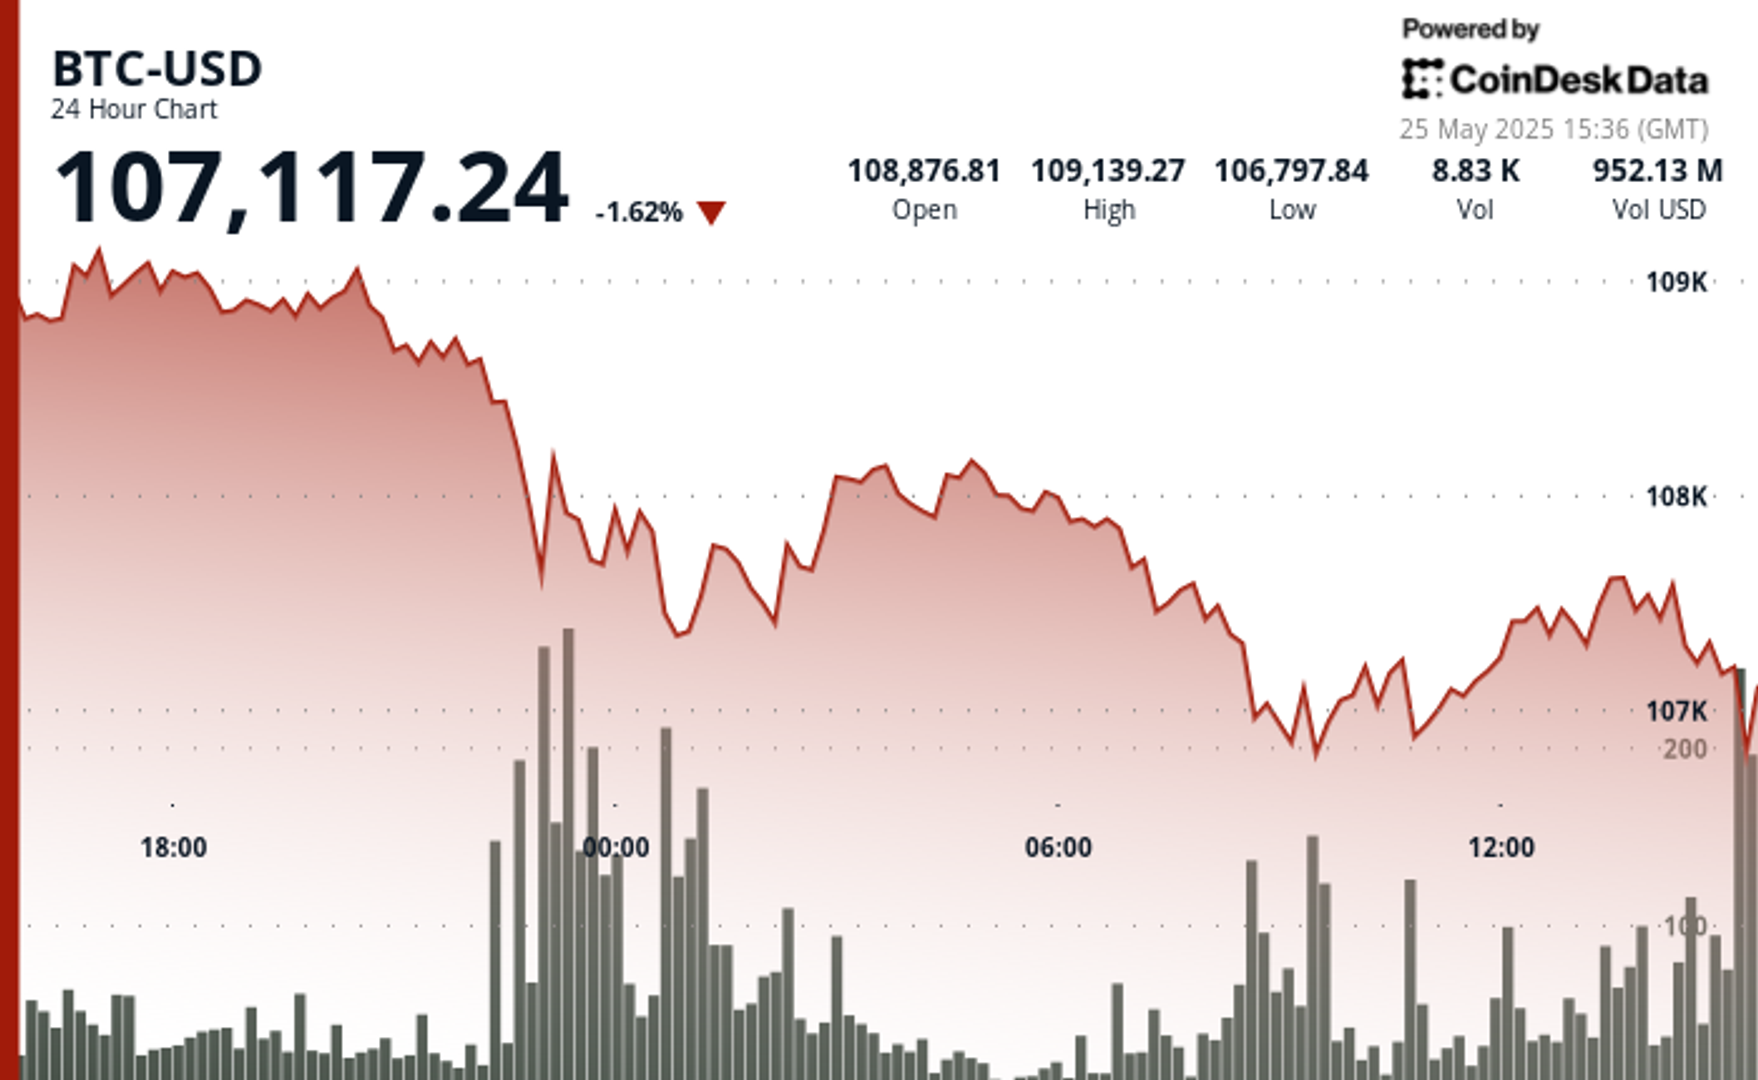
Bitcoin’s recent pullback has established strong volume-based resistance near $108,300, with support forming in the $106,700-$107,000 zone.
The correction accelerated with a notable price surge from $107,373 to $107,671 between 13:06-13:36, followed by a sharp reversal.
Technical analysis suggests Bitcoin is now trading within a compression zone, trapped between two major fair value gaps that will determine the upcoming market direction.
If bulls reclaim the $109K to $110K area, price could push toward resistance beyond $112K, while a break below $107,000 might test liquidity around $106K.
Technical Analysis Breakdown
- The decline accelerated during the 22:00-23:00 hour on May 24th with exceptionally high volume (16,335 BTC), establishing a strong volume-based resistance near $108,300.
- Support has formed in the $106,700-$107,000 zone where buyers emerged during the 09:00-10:00 period on May 25th, though recovery attempts have been modest with price consolidating around $107,500.
- The overall technical structure suggests a short-term bearish trend with potential for further consolidation before directional clarity emerges.
- Bitcoin experienced significant volatility with a notable price surge from $107,373 to $107,671 between 13:06-13:36, followed by a sharp reversal that saw prices decline to $107,393 by 14:00.
- The most substantial price movement occurred during the 13:35 minute candle where BTC jumped nearly $150 with exceptionally high volume (148.76 BTC), establishing temporary resistance around $107,630.
- Support formed near $107,400 where buyers emerged during the final minutes of the period, though the overall technical structure suggests continued consolidation within the broader correction from the $109,239 high.
External References
- «Bitcoin Price Prediction for May 25: Will Bulls Defend $108K or Is a Deeper Drop Ahead?«, Coin Edition, published May 24, 2025.
- «Why is Bitcoin Price Dropping Now? Will BTC Price Go Down to $100K?«, CoinPedia, published May 24, 2025.
- «Bitcoin Price Analysis: BTC Displays Signs of Weakness Following New All-Time High«, CryptoPotato, published May 25, 2025.


Ethereum Surges After Holding $2,477, Fueled by Very Heavy Trading Volume

XRP Plunges Below $2.30 Amid Heavy Selling Pressure

Bitcoin Drops Below $107.5K as Trump Tariff Threat Triggers Crypto Sell-Off
-

 Fashion7 месяцев ago
These \’90s fashion trends are making a comeback in 2017
-
Entertainment7 месяцев ago
The final 6 \’Game of Thrones\’ episodes might feel like a full season
-
Fashion7 месяцев ago
According to Dior Couture, this taboo fashion accessory is back
-
Entertainment7 месяцев ago
The old and New Edition cast comes together to perform
-
Business7 месяцев ago
Uber and Lyft are finally available in all of New York State
-
Sports7 месяцев ago
Phillies\’ Aaron Altherr makes mind-boggling barehanded play
-
Entertainment7 месяцев ago
\’Better Call Saul\’ has been renewed for a fourth season
-
Sports7 месяцев ago
Steph Curry finally got the contract he deserves from the Warriors