Uncategorized
FLOKI Lists on Webull Pay, Unlocking Access to 24M Users Amid Volatile Trading
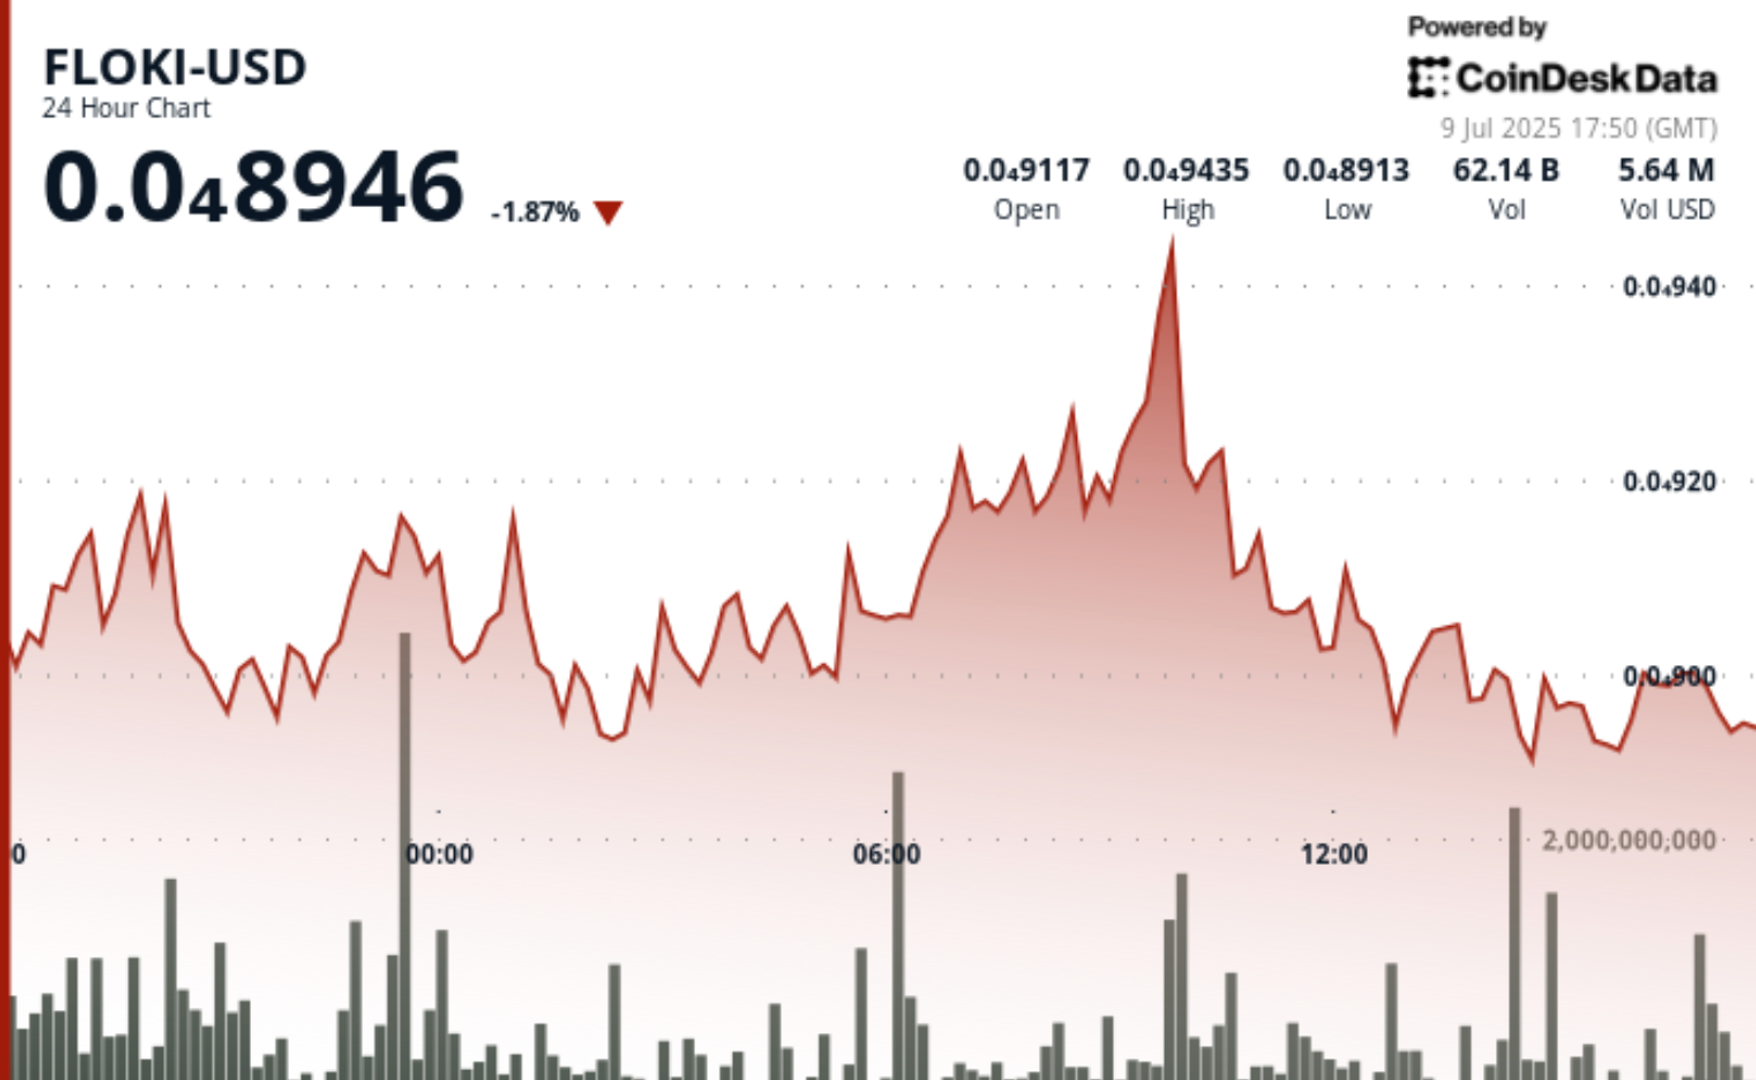
FLOKI FLOKI traded in a wide $0.00005422 range over the past 24 hours, swinging from a high of $0.00009435 to a low of $0.00008913 before settling at $0.00008946, down 1.87%, according to CoinDesk Research’s technical analysis model.
The token’s volatile session was marked by a sharp 4% rally during the U.S. morning hours, followed by aggressive profit-taking as resistance formed near the $0.00009400 level. Trading volume spiked to 95.85 billion tokens at the height of the rally — more than 56% above FLOKI’s daily average — before declining steadily into the U.S. afternoon.
FLOKI’s price action coincided with a key milestone announced by the project earlier today. The team revealed that FLOKI has been listed on Webull Pay, a popular U.S. retail crypto trading platform operated by Webull, which boasts over 24 million users. According to the team, the listing significantly increases liquidity and expands access to millions of potential new holders, positioning FLOKI to advance its stated goal of becoming the most recognized and widely used cryptocurrency.
Despite intraday weakness and a late-session fade, FLOKI remained above session lows. A failed recovery attempt around $0.00009016 confirmed that sellers continue to dominate at higher levels, but the token’s ability to hold above $0.00008900 may suggest underlying support near this area as the market digests the implications of the Webull listing.
Technical Analysis Highlights
- FLOKI showed sharp directional shifts around key psychological levels between $0.00008900 and $0.00009400.
- Early session gains unraveled quickly as volume dried up post-09:00 UTC rally.
- Selling pressure became dominant above $0.00009350 with repeated rejection.
- Final selloff broke below temporary intraday support at $0.00009000.
- Volume during pullback phases remained elevated, indicating distribution.
- Despite downside close, price avoided deeper breakdown below $0.00008900.
Disclaimer: Parts of this article were generated with the assistance from AI tools and reviewed by our editorial team to ensure accuracy and adherence to our standards. For more information, see CoinDesk’s full AI Policy.

Good Morning, Asia. Here’s what’s making news in the markets:
Welcome to Asia Morning Briefing, a daily summary of top stories during U.S. hours and an overview of market moves and analysis. For a detailed overview of U.S. markets, see CoinDesk’s Crypto Daybook Americas.
Bitcoin (BTC) traded just above $115k in Asia Tuesday morning, slipping slightly after a strong start to the week.
The modest pullback followed a run of inflows into U.S. spot ETFs and lingering optimism that the Federal Reserve will cut rates next week. The moves left traders divided: is this recovery built on fragile foundations, or is crypto firmly back on track after last week’s CPI-driven jitters?
That debate is playing out across research desks. Glassnode’s weekly pulse emphasizes fragility. While ETF inflows surged nearly 200% last week and futures open interest jumped, the underlying spot market looks weak.
Buying conviction remains shallow, Glassnode writes, funding rates have softened, and profit-taking is on the rise with more than 92% of supply in profit.
Options traders have also scaled back downside hedges, pushing volatility spreads lower, which Glassnode warns leaves the market exposed if risk returns. The core message: ETFs and futures are supporting the rally, but without stronger spot flows, BTC remains vulnerable.
QCP takes the other side.
The Singapore-based desk says crypto is “back on track” after CPI confirmed tariff-led inflation without major surprises. They highlight five consecutive days of sizeable BTC ETF inflows, ETH’s biggest inflow in two weeks, and strength in XRP and SOL even after ETF delays.
Traders, they argue, are interpreting regulatory postponements as inevitability rather than rejection. With the Altcoin Season Index at a 90-day high, QCP sees BTC consolidation above $115k as the launchpad for rotation into higher-beta assets.
The divide underscores how Bitcoin’s current range near $115k–$116k is a battleground. Glassnode calls it fragile optimism; QCP calls it momentum. Which side is right may depend on whether ETF inflows keep offsetting profit-taking in the weeks ahead.
")
Market Movement
BTC: Bitcoin is consolidating near the $115,000 level as traders square positions ahead of expected U.S. Fed policy moves; institutional demand via spot Bitcoin ETFs is supporting upside
ETH: ETH is trading near $4500 in a key resistance band; gains are being helped by renewed institutional demand, tightening supply (exchange outflows), and positive technical setups.
Gold: Gold continues to hold near record highs, underpinned by expectations of Fed interest rate cuts, inflation risk, and investor demand for safe havens; gains tempered somewhat by profit‑taking and a firmer U.S. dollar
Nikkei 225: Japan’s Nikkei 225 topped 45,000 for the first time Monday, leading Asia-Pacific gains as upbeat U.S.-China trade talks and a TikTok divestment framework lifted sentiment.
S&P 500: The S&P 500 rose 0.5% to close above 6,600 for the first time on Monday as upbeat U.S.-China trade talks and anticipation of a Fed meeting lifted stocks.
Elsewhere in Crypto

Wall Street giant Citigroup (C) has launched new ether (ETH) forecasts, calling for $4,300 by year-end, which would be a decline from the current $4,515.
That’s the base case though. The bank’s full assessment is wide enough to drive an army regiment through, with the bull case being $6,400 and the bear case $2,200.
The bank analysts said network activity remains the key driver of ether’s value, but much of the recent growth has been on layer-2s, where value “pass-through” to Ethereum’s base layer is unclear.
Citi assumes just 30% of layer-2 activity contributes to ether’s valuation, putting current prices above its activity-based model, likely due to strong inflows and excitement around tokenization and stablecoins.
A layer 1 network is the base layer, or the underlying infrastructure of a blockchain. Layer 2 refers to a set of off-chain systems or separate blockchains built on top of layer 1s.
Exchange-traded fund (ETF) flows, though smaller than bitcoin’s (BTC), have a bigger price impact per dollar, but Citi expects them to remain limited given ether’s smaller market cap and lower visibility with new investors.
Macro factors are seen adding only modest support. With equities already near the bank’s S&P 500 6,600 target, the analysts do not expect major upside from risk assets.
Read more: Ether Bigger Beneficiary of Digital Asset Treasuries Than Bitcoin or Solana: StanChart

Stellar’s XLM token endured sharp swings over the past 24 hours, tumbling 3% as institutional selling pressure dominated order books. The asset declined from $0.39 to $0.38 between September 14 at 15:00 and September 15 at 14:00, with trading volumes peaking at 101.32 million—nearly triple its 24-hour average. The heaviest liquidation struck during the morning hours of September 15, when XLM collapsed from $0.395 to $0.376 within two hours, establishing $0.395 as firm resistance while tentative support formed near $0.375.
Despite the broader downtrend, intraday action highlighted moments of resilience. From 13:15 to 14:14 on September 15, XLM staged a brief recovery, jumping from $0.378 to a session high of $0.383 before closing the hour at $0.380. Trading volume surged above 10 million units during this window, with 3.45 million changing hands in a single minute as bulls attempted to push past resistance. While sellers capped momentum, the consolidation zone around $0.380–$0.381 now represents a potential support base.
Market dynamics suggest distribution patterns consistent with institutional profit-taking. The persistent supply overhead has reinforced resistance at $0.395, where repeated rally attempts have failed, while the emergence of support near $0.375 reflects opportunistic buying during liquidation waves. For traders, the $0.375–$0.395 band has become the key battleground that will define near-term direction.
")
Technical Indicators
- XLM retreated 3% from $0.39 to $0.38 during the previous 24-hours from 14 September 15:00 to 15 September 14:00.
- Trading volume peaked at 101.32 million during the 08:00 hour, nearly triple the 24-hour average of 24.47 million.
- Strong resistance established around $0.395 level during morning selloff.
- Key support emerged near $0.375 where buying interest materialized.
- Price range of $0.019 representing 5% volatility between peak and trough.
- Recovery attempts reached $0.383 by 13:00 before encountering selling pressure.
- Consolidation pattern formed around $0.380-$0.381 zone suggesting new support level.
Disclaimer: Parts of this article were generated with the assistance from AI tools and reviewed by our editorial team to ensure accuracy and adherence to our standards. For more information, see CoinDesk’s full AI Policy.


Asia Morning Briefing: Fragility or Back on Track? BTC Holds the Line at $115K

Wall Street Bank Citigroup Sees Ether Falling to $4,300 by Year-End

XLM Sees Heavy Volatility as Institutional Selling Weighs on Price
-

 Business11 месяцев ago
3 Ways to make your business presentation more relatable
-
Fashion11 месяцев ago
According to Dior Couture, this taboo fashion accessory is back
-
Entertainment11 месяцев ago
10 Artists who retired from music and made a comeback
-
Entertainment11 месяцев ago
\’Better Call Saul\’ has been renewed for a fourth season
-
Entertainment11 месяцев ago
New Season 8 Walking Dead trailer flashes forward in time
-
Business11 месяцев ago
15 Habits that could be hurting your business relationships
-
Entertainment11 месяцев ago
Meet Superman\’s grandfather in new trailer for Krypton
-
Entertainment11 месяцев ago
Disney\’s live-action Aladdin finally finds its stars