Uncategorized
Ether Is Set to Explode as Traders Pump Millions Into $6K ETH Bets

Crypto traders are betting big on ether ETH in the wake of the recent rally.
Last week, block traders, typically institutions and large players, executed bull call spreads on ether, purchasing the $3,500 call options while simultaneously shorting an equal number of calls at the $6,000 strike, both set to expire on Dec. 26.
Traders executed the strategy via over-the-counter platform Paradigm, which was later listed on crypto exchange Deribit. Traders executed 30,000 contracts of the $3,500/$6,000 call spreads across 10 separate trades, spending just over $7 million in initial debt/cost.
The strategy will yield the highest profit if ether rises to or beyond $6,000 by Dec. 26. On Paradigm and Deribit, one options contract represents one ETH.
Therefore, the large volume of the $3,500/$6,000 call spreads indicates a strong expectation of a bullish move to $6,000 by the end of the year. As of writing, ether changed hands at $2,510, according to CoinDesk data.
Note that if ETH stays below $3,600, the strategy will expire worth less, limiting the loss to the initial cost of $7 million. Another downside of this strategy is that traders stand to lose out on potential upside above $6,000 due to the short position at that strike level.
Ether’s price has risen over 80% to $2,500 since early April, when the broader market panic saw ETH hit a low of around $1,390 on several exchanges.
Magadini said there is no reason to call tops in ETH right now.
«I continue to like these upside trades, especially for the beat-up Ethereum, as risk assets continue to rally. There’s a good argument for ETH «catching-up» as spot ETFs with staking rewards could be a catalyst for institutional participation and sentiment turns around. No reason to be calling tops right now,» Magadini said.

Good Morning, Asia. Here’s what’s making news in the markets:
Welcome to Asia Morning Briefing, a daily summary of top stories during U.S. hours and an overview of market moves and analysis. For a detailed overview of U.S. markets, see CoinDesk’s Crypto Daybook Americas.
Bitcoin is trading below $110,000, changing hands at $109.7K, as Asia continues its trading week.
The move challenges a prevailing market narrative of summer stagnation, coming on the heels of a note from QCP Capital that emphasized suppressed volatility and a lack of immediate catalysts.
A recent Telegram note from QCP pointed to one-year lows in implied volatility and a pattern of subdued price action, noting that BTC had been “stuck in a tight range” as summer approaches.
A clean break below $100K or above $110K, they wrote, would be needed to “reawaken broader market interest.”
Even so, QCP warned that recent macro developments had failed to spark directional conviction.
“Even as US equities rallied and gold sold off in the wake of Friday’s stronger-than-expected jobs report, BTC remained conspicuously unmoved, caught in the cross-currents without a clear macro anchor,” the note said. “Without a compelling narrative to spark the next leg higher, signs of fatigue are emerging. Perpetual open interest is softening, and spot BTC ETF inflows have started to taper.”
That context makes the current move all the more surprising.
Over the weekend, Bitcoin surged 3.26% from $105,393 to $108,801, with hourly volume spiking to 2.5x the 24-hour average, according to CoinDesk Research’s technical analysis model. BTC broke decisively above $106,500, establishing new support at $107,600, and continued upward into Monday’s session, reaching $110,169.
The breakout coincides with a tense macro backdrop: US-China trade talks in London and a $22 billion U.S. Treasury bond auction later this week have injected uncertainty into global markets. While these events could drive fresh volatility, QCP cautioned that recent headlines have mostly led to “knee-jerk reactions” that quickly fade.
The question now is whether BTC’s move above $110K has true staying power, or whether the rally is running ahead of the fundamentals.
")
A ‘Massive Shift’ in Institutional Staking May Drive ETH’s Next Rally
Ethereum’s critics have long highlighted centralization risks, but that narrative is fading as institutional adoption accelerates, infrastructure matures, and recent protocol upgrades directly address past limitations.
“Market participants will pay for decentralization because it’s in their economic interest from a security and principal protection standpoint,” Mara Schmiedt, CEO of institutional Ethereum staking platform Alluvial, told CoinDesk. “If you look at [decentralization metrics] all of these things have massively improved over the last couple of years.»
There’s currently $492 million worth of ETH staked by Liquid Collective – a protocol co-founded by Alluvial to facilitate institutional staking
While this figure may appear modest compared to Ethereum’s total staked volume of around $93 billion, what’s interesting is that it originates predominantly from institutional investors.
«We’re really on the cusp of a truly massive shift for Ethereum, driven by regulatory momentum and the ability to unlock the advantages of secure staking,» she noted.
Central to Ethereum’s institutional readiness is the recent Pectra upgrade, a significant development Schmiedt describes as both «massive» and «underappreciated.»
«I think Pectra has been a massive upgrade. I actually think it’s been underappreciated, just in terms of the tremendous amount of change it introduces into the staking mechanics,» Schmiedt said.
Additionally, Execution Layer triggerable withdrawals—a key component of Pectra—provide institutional participants, including ETF issuers, a crucial compatibility upgrade.
This feature enables partial validator exits directly from Ethereum’s execution layer, aligning with institutional operational requirements such as T+1 redemption timelines.
«EL triggerable withdrawals create a much more effective path to exit for large-scale market participants,» Schmiedt added.
Ultimately, Schmiedt said, «I think we’ll see that a lot more [ETH] in institutional portfolios going forward.”
News Roundup
Trump Media May Be the Cheapest Bitcoin Play Among Public Stocks, NYDIG Says
Trump Media (DJT) may be one of the cheapest ways to get bitcoin exposure in public markets, according to a new report from NYDIG, CoinDesk recently reported.
As a growing number of companies adopt MicroStrategy’s strategy of stacking BTC on their balance sheets, analysts are rethinking how to value these so-called bitcoin treasury firms.
While the commonly used modified net asset value (mNAV) metric suggests that investors are paying a premium for BTC exposure, NYDIG’s Greg Cipolaro argues mNAV alone is “woefully deficient.” Instead, he points to the equity premium to NAV, which factors in debt, cash, and enterprise value, as a more accurate gauge.
By that measure, Trump Media and Semler Scientific (SMLR) rank as the most undervalued of eight companies analyzed, trading at equity premiums of -16% and -10% respectively, despite both showing mNAVs above 1.1. In other words, their shares are worth less than the value of the bitcoin they hold.
That’s in stark contrast to MicroStrategy (MSTR), which rose nearly 5% Monday as bitcoin crossed $110,000, while DJT and SMLR remained mostly flat—making them potentially overlooked vehicles for BTC exposure.
Circle Stock Nearly Quadruples Post-IPO as Bitwise and ProShares File Competing ETFs
Two major ETF issuers, Bitwise and ProShares, filed proposals on June 6 to launch exchange-traded funds tied to Circle (CRCL), whose stock has nearly quadrupled since its IPO late last week, CoinDesk previously reported.
ProShares is aiming for a leveraged product that delivers 2x the daily performance of CRCL. At the same time, Bitwise plans a covered call fund that generates income by selling options against held shares, two very different ways to capitalize on the stock’s explosive rise.
CRCL surged another 9% Monday in volatile trading, continuing to draw interest from both traditional finance and crypto investors. The proposed ETFs have an effective date of August 20, pending SEC approval. If approved, they would further blur the lines between crypto and conventional finance, giving investors new tools to play one of the hottest post-IPO names of the year.
Market Movements:
- BTC: Bitcoin is trading at $109,795 after a 3.26% breakout fueled by institutional buying, elevated volume, and macro uncertainty from US-China trade talks and an upcoming $22B Treasury auction.
- ETH: Ethereum rebounded 4.46% from a low of $2,480 to close at $2,581, with strong buying volume confirming support at $2,580 and setting up a potential breakout above $2,590.
- Gold: Gold is trading at $3,314.45, edging up 0.08% as investors watch US-China trade talks in London and a subdued dollar keeps prices attractive.
- Nikkei 225: Asia-Pacific markets rose Tuesday, with Japan’s Nikkei 225 up 0.51%, as investors awaited updates from ongoing U.S.-China trade talks.
- S&P 500: The S&P 500 closed slightly higher Monday, boosted by Amazon and Alphabet, as investors monitored U.S.-China trade talks.
Elsewhere in Crypto

Bitcoin’s BTC quiet climb on Monday accelerated to its strongest price in June, rebounding from last week’s decline to near all-time high levels.
The largest crypto advanced by 3.7% over the past 24 hours, topping $110,000, and it’s changing hands by only 2% from its record prices observed in May. Ethereum’s ether ETH kept pace with a 3.8% gain during the same period, bouncing above $2,620. Native tokens of Hyperliquid HYPE and SUI SUI outperformed most large-cap cryptocurrencies, rising 7% and 4.5%, respectively.
Bitcoin’s move higher caught leveraged traders off-guard, liquidating over $110 million worth of short positions within an hour, CoinGlass data shows. Across all crypto assets, some $330 million of shorts were liquidated during the day, the most in a month. Shorts are seeking to profit from declining asset prices.
The move happened while traditional markets showed muted action, with the S&P 500 and Nasdaq indexes flat on the day. Crypto-related stocks bounced during the session to catch up with BTC’s recovery over the weekend.
«A ‘peaceful rally’ is a perfect way to describe this price action,» said well-followed analyst Caleb Franzen, founder of Cubic Analytics. «Just a consistent development of higher highs and higher lows. Any signs of weakness? Buyers step in and defend the trend.»
The crypto market is now on steadier footing for a potential next leg higher after bitcoin’s 10% decline to near $100,000 and with more than $1.9 billion in liquidations across crypto derivatives over the past week, having flushed excessive leverage, Bitfinex analysts noted in a Monday report.
However, on-chain data indicates rising sell pressure from long-term holders that could overwhelm demand, the analysts added.
“Bitcoin is now at a crossroads—balanced between structural support and waning bullish momentum, waiting for its next macro cue,” the Bitfinex note added.
Those macro catalysts may come later this week, noted Jake O, OTC trader at crypto trading firm Wintermute.
«U.S. and Chinese trade representatives are scheduled to meet today, with markets likely sensitive to any headlines following last week’s positive momentum, and the data calendar remains light until Wednesday, when CPI will offer fresh insight into U.S. inflation,» he said.
UPDATE (June 9, 21:51 UTC): Adds short liquidation data from CoinGlass.
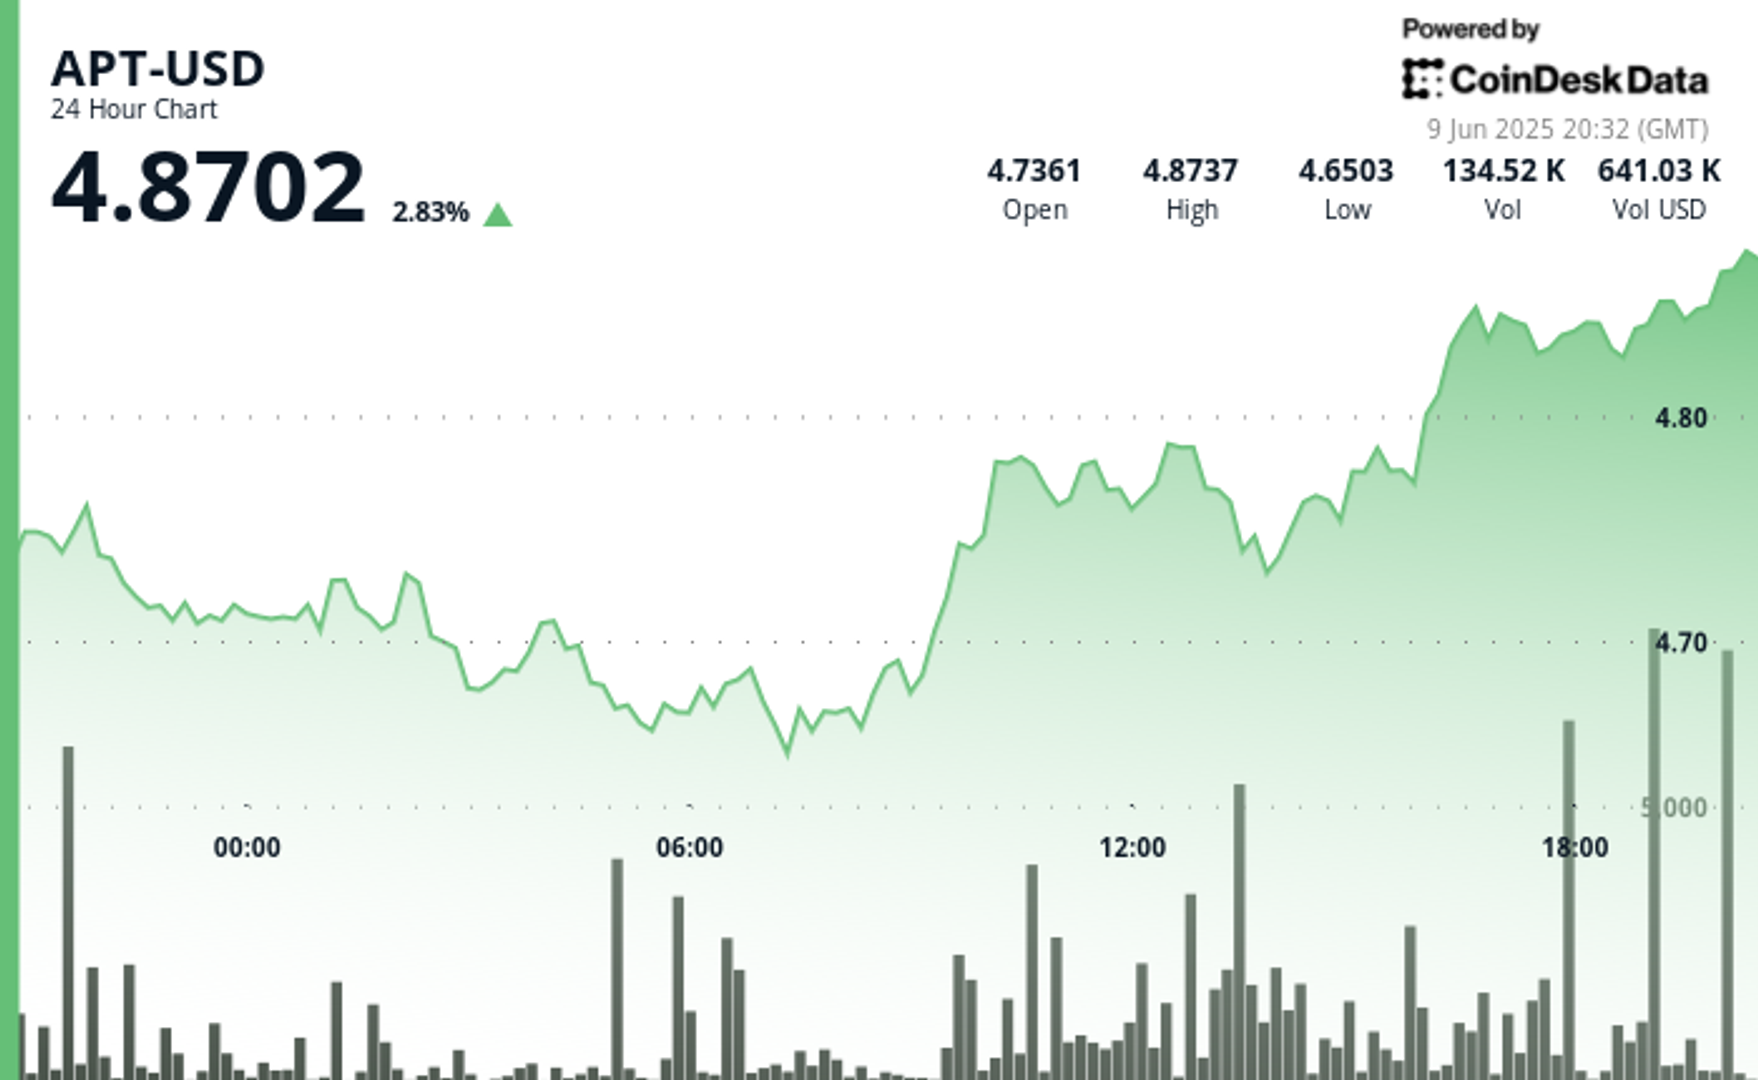
Aptos’ APT token rallied more than 4% on significant volume, with momentum indicators suggesting more potential upside, according to CoinDesk Research’s technical analysis model.
The digital asset broke out of its consolidation phase between $4.65-$4.73, establishing strong support at $4.73 before pushing through previous resistance levels to establish a new local high, according to the model.
The token is currently 2.6% higher, trading around $4.86.
The broader market gauge, the CoinDesk CD20 was 1.75% higher at publication time.
Technical Analysis:
- APT rallied from $4.65 to $4.85, representing a 4.3% gain with significant volume confirmation.
- Price formed a clear consolidation pattern between $4.65-$4.73 before experiencing a decisive breakout at 09:00 with volume nearly doubling the 24-hour average.
- Strong support established at $4.73 with subsequent price action forming an ascending channel with resistance at $4.85.
- Substantial volume spike during the 16:00 candle (884,397 units) confirmed buyer conviction as APT pushed through previous resistance levels.
- Price formed a distinct pattern of higher lows while encountering resistance at $4.85, which was breached during the 20:01 candle with significant volume (10,126 units).
- Key technical development occurred at when price surged from $4.84 to $4.85 with strong volume confirmation (9,094 units).
- Support at $4.84 held through subsequent retests, with final minutes showing decisive momentum suggesting potential continuation of the uptrend.


Asia Morning Briefing: BTC Slips Below $110K as ‘Signs of Fatigue’ Emerging

Bitcoin Climbs Above $110K, ‘At Crossroads’ for Next Major Move

Aptos’ APT Gains 4% on Significant Volume, Has More Potential Upside
-

 Business8 месяцев ago
3 Ways to make your business presentation more relatable
-
Entertainment8 месяцев ago
10 Artists who retired from music and made a comeback
-
Fashion8 месяцев ago
According to Dior Couture, this taboo fashion accessory is back
-
Entertainment8 месяцев ago
\’Better Call Saul\’ has been renewed for a fourth season
-
Business8 месяцев ago
15 Habits that could be hurting your business relationships
-
Entertainment8 месяцев ago
Disney\’s live-action Aladdin finally finds its stars
-
Tech8 месяцев ago
5 Crowdfunded products that actually delivered on the hype
-
Entertainment8 месяцев ago
New Season 8 Walking Dead trailer flashes forward in time