Uncategorized
Crypto Daybook Americas: It May Not Feel Like It, but the Market Correction Is Normal
By James Van Straten (All times ET unless indicated otherwise)
Two contradictory philosophies jump to mind when considering bitcoin’s (BTC) price action of late.
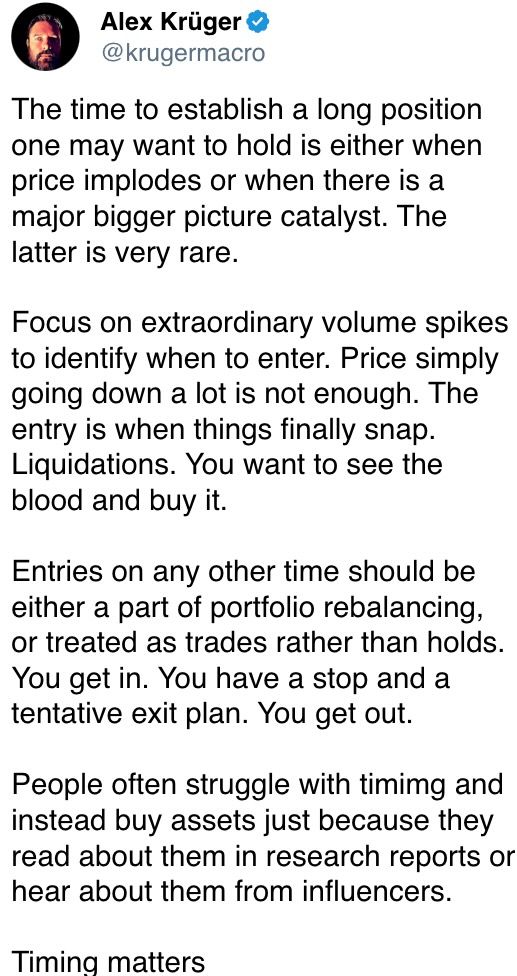
Do you «buy when there is blood in the streets»? Or perhaps «don’t catch a falling knife.»?
Which applies in today’s market, the day after the largest cryptocurrency posted its steepest three-day decline since the collapse of FTX in 2022? The drop left BTC 25% below January’s all-time high, despite the advent of President Donald Trump’s pro-crypto administration.
It’s no surprise the largest hack in crypto history has shaken investor sentiment. Add to that the memecoin frenzy, which pulled liquidity out of the broader market.
That said, in previous cycles so-called bull-market corrections have sent bitcoin tumbling as much as 35%. Given that BTC hasn’t had a meaningful pullback since the yen carry trade unwind last August, the current situation is almost normal.
CoinDesk research showed that bitcoin was trading in an extremely tight range for a meaningful period, and a break in the channel was inevitable. On-chain data tells us that bitcoin recently bounced off its 200-day-moving average or roughly $81,800. While short-term holders are selling — panic sales, perhaps? — at the highest level since August, because they have held BTC for 155 days or less they are usually seen as a signal of some form of capitulation in the market.
BlackRock’s IBIT saw record outflows on Wednesday. However, it’s not all bad news. A huge expansion deal was made for Core Scientific (CORZ), while MARA Holdings (MARA) reported strong earnings, with both stocks more than 10% before the open. Meanwhile, NVIDIA (NVDA) topped fourth-quarter estimates to calm investors’ nerves. Stay alert!
What to Watch
Crypto:
Feb. 27: Solana-based L2 Sonic SVM (SONIC) mainnet launch (“Mobius”).
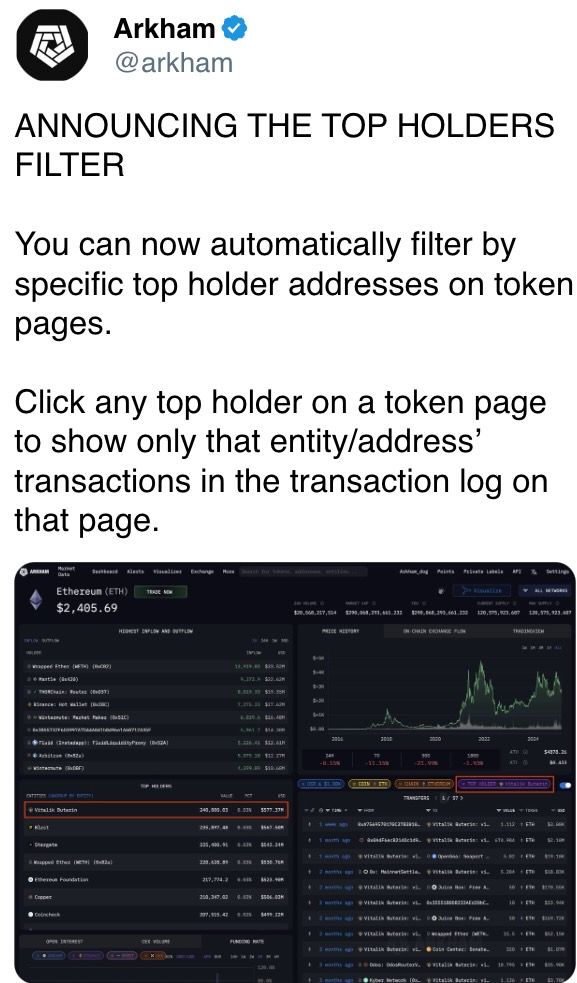
March 1: Spot trading on the Arkham Exchange goes live in 17 U.S. states.
March 5 (provisional): At epoch 222464, testing of Ethereum’s Pectra upgrade on the Sepolia testnet starts.
Macro
Day 2 of 2: 2025’s first G20 finance ministers and central bank governors meeting (Cape Town, South Africa).
Feb. 27, 7:00 a.m.: Brazil’s Institute of Geography and Statistics (IBGE) releases January employment data.
Unemployment Rate Est. 6.6% vs. Prev. 6.2%
Feb. 27, 7:00 a.m.: Mexico’s National Institute of Statistics and Geography releases January employment data
Unemployment Rate Est. 2.7% vs. Prev. 2.4%
Feb. 27, 8:30 a.m.: The U.S. Bureau of Economic Analysis releases Q4 GDP (2nd estimate).
Core PCE Prices QoQ Est. 2.5% vs. Prev. 2.2%
PCE Prices QoQ Est. 2.3% vs. Prev. 1.5%
GDP Growth Rate QoQ Est. 2.3% vs. Prev. 3.1%
Feb. 27, 8:30 a.m.: The U.S. Department of Labor releases Unemployment Insurance Weekly claims for the week ended Feb. 22.
Initial Jobless Claims Est. 221K vs. Prev. 219K
Feb. 28, 8:30 a.m.: The U.S. Bureau of Economic Analysis releases January personal consumption data.
Core PCE Price Index MoM Est. 0.3% vs. Prev. 0.2%
Core PCE Price Index YoY Est. 2.6% vs. Prev. 2.8%
PCE Price Index MoM Est. 0.3% vs. Prev. 0.3%
PCE Price Index YoY Est. 2.5% vs. Prev. 2.6%
Personal Income MoM Est. 0.3% vs. Prev. 0.4%
Personal Spending MoM Est. 0.1% vs. Prev. 0.7%
Earnings
March 6 (TBC): Bitfarms (BITF), $-0.04
March 17 (TBC): Bit Digital (BTBT), $-0.05
March 18 (TBC): TeraWulf (WULF), $-0.03
March 24 (TBC): Galaxy Digital Holdings (TSE: GLXY), C$0.38
Token Events
Governances votes & calls
DYdX DAO is voting on distributing $1.5 million in DYDX tokens from the community treasury to qualifying users in trading season 9 as part of its incentives program.
Feb. 27, 11 a.m.: IOTA (IOTA) to host an Ask Me Anything (AMA) session with co-founder Dominik Schiener and Thoralf, senior software engineer for its smart contract platform and dev tools.
Feb. 27, 2 p.m.: VeChain (VET) to cover its monthly updates in a community call.
Unlocks
Feb. 28: Optimism (OP) to unlock 2.32% of circulating supply worth $36.67 million.
Mar. 1: DYdX to unlock 1.14% of circulating supply worth $6.13 million.
Mar. 1: ZetaChain (ZETA) to unlock 6.48% of circulating supply worth $13.58 million.
Mar. 1: Sui (SUI) to unlock 0.74% of circulating supply worth $67.52 million.
Mar. 2: Ethena (ENA) to unlock 1.3% of circulating supply worth $17.79 million.
Mar. 7: Kaspa (KAS) to unlock 0.63% of circulating supply worth $14.23 million.
Mar. 8: Berachain (BERA) to unlock 9.28% of circulating supply worth $77.80 million.
Token Listings
Feb. 27: Venice token (VVV) to be listed on Kraken.
Feb. 28: Worldcoin (WLD) to be listed on Kraken.
Feb. 28: Zcash (ZEC) and Dash (DASH) are being delisted from Bybit
Conferences
CoinDesk’s Consensus to take place in Toronto on May 14-16. Use code DAYBOOK and save 15% on passes.
Day 5 of 8: ETHDenver 2025 (Denver)
March 2-3: Crypto Expo Europe (Bucharest)
March 8: Bitcoin Alive (Sydney)
March 10-11: MoneyLIVE Summit (London)
March 13-14: Web3 Amsterdam ‘25 (Netherlands)
March 19-20: Next Block Expo (Warsaw)
March 26: DC Blockchain Summit 2025 (Washington)
March 28: Solana APEX (Cape Town)
Token Talk
By Shaurya Malwa
Pump.fun, a Solana-based memecoin launchpad, has seen a sharp decline in token launches and graduations amid a falling market.
The platform hit a peak in October 2024, creating over 36,000 tokens in a day and generating a record $3 billion market cap for its ecosystem, but activity has since plummeted, with daily token launches dropping more than 60%.
Data from Dune Analytics shows Pump.fun’s token graduation rate remains low at around 1%-2%, with many tokens failing to sustain value post-launch, contributing to the downturn.
The decline comes as Solana’s SOL has dropped more than 40% since the start of the year.
Derivatives Positioning
Open interest in perceptual futures tied to APT, one of the best-performing coins of the past 24 hours, has increased, but funding rates and the cumulative volume delta are negative. That’s a sign of traders hedging downside risks.
SOL and LTC have also seen increases in open interest, but with positive funding rates.
BTC and ETH options on Deribit now indicate downside concerns extending until the end of March, while later expirations continue to show a preference for call options.
Block flows on Paradigm have been mixed, with puts and OTM call spreads lifted. The SOL March 7 expiry put option at the $120 strike was purchased.
Market Movements:
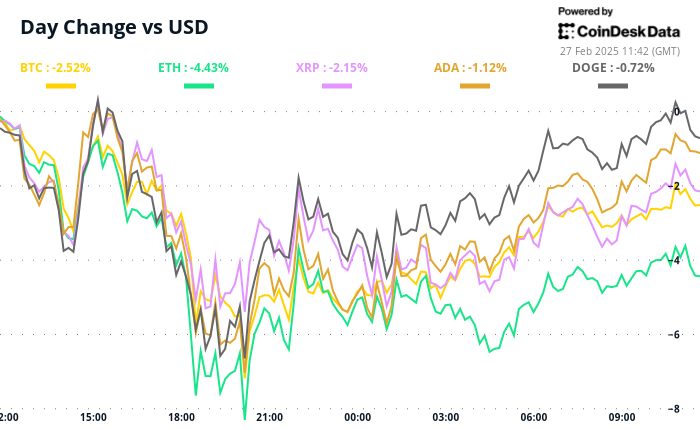
BTC is up 3% from 4 p.m. ET Wednesday at $86,735.19 (24hrs: -2.12%)
ETH is up 1.98% at $2,378.49 (24hrs: -3.49%)
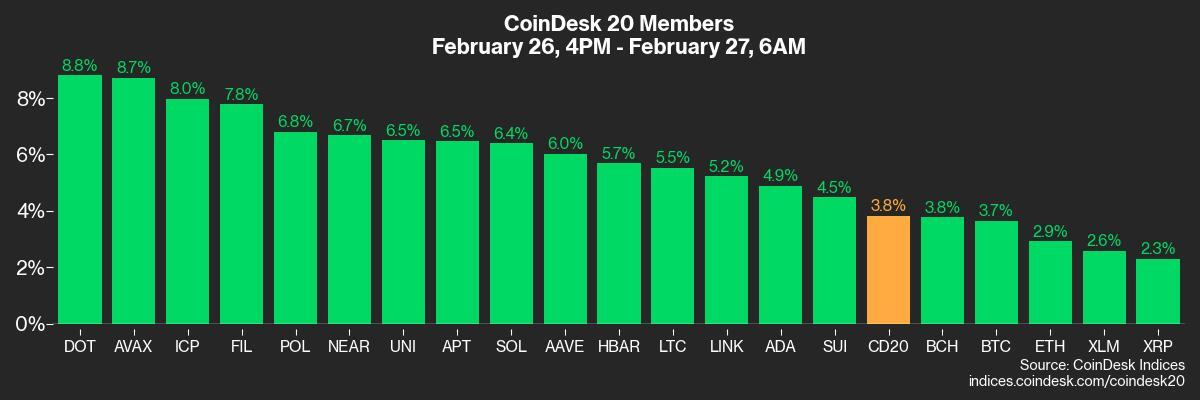
CoinDesk 20 is up 2.98% at 2,821.02 (24hrs: -1.13%)
Ether CESR Composite Staking Rate is down 26 bps at 3.02%
BTC funding rate is at 0.0039% (4.26% annualized) on Binance
DXY is up 0.23% 106.66
Gold is down 0.77% at $2,893.59/oz
Silver is down 0.27% at $31.83/oz
Nikkei 225 closed +0.3% at 38,256.17
Hang Seng closed -0.29% at 23,718.29
FTSE is up 0.19% at 8,748.36
Euro Stoxx 50 is down 0.72% at 5,487.97
DJIA closed on Wednesday -0.43% at 43,433.12
S&P 500 closed unchanged at 5,956.06
Nasdaq closed +0.26% at 19,075.26
S&P/TSX Composite Index closed +0.49% at 25,328.36
S&P 40 Latin America closed -0.46% at 2,379.84
U.S. 10-year Treasury rate is up 5 bps at 4.31%
E-mini S&P 500 futures are up 0.57% at 6,005.00
E-mini Nasdaq-100 futures are up 0.64% at 21,322.25
E-mini Dow Jones Industrial Average Index futures are up 0.24% at 43,612.00
Bitcoin Stats:
BTC Dominance: 60.77 (0.31%)
Ethereum to bitcoin ratio: 0.02744 (-1.05%)
Hashrate (seven-day moving average): 766 EH/s
Hashprice (spot): $50.5
Total Fees: 10.9 BTC / $915,415
CME Futures Open Interest: 155,270 BTC
BTC priced in gold: 29.6 oz
BTC vs gold market cap: 8.42%
Technical Analysis
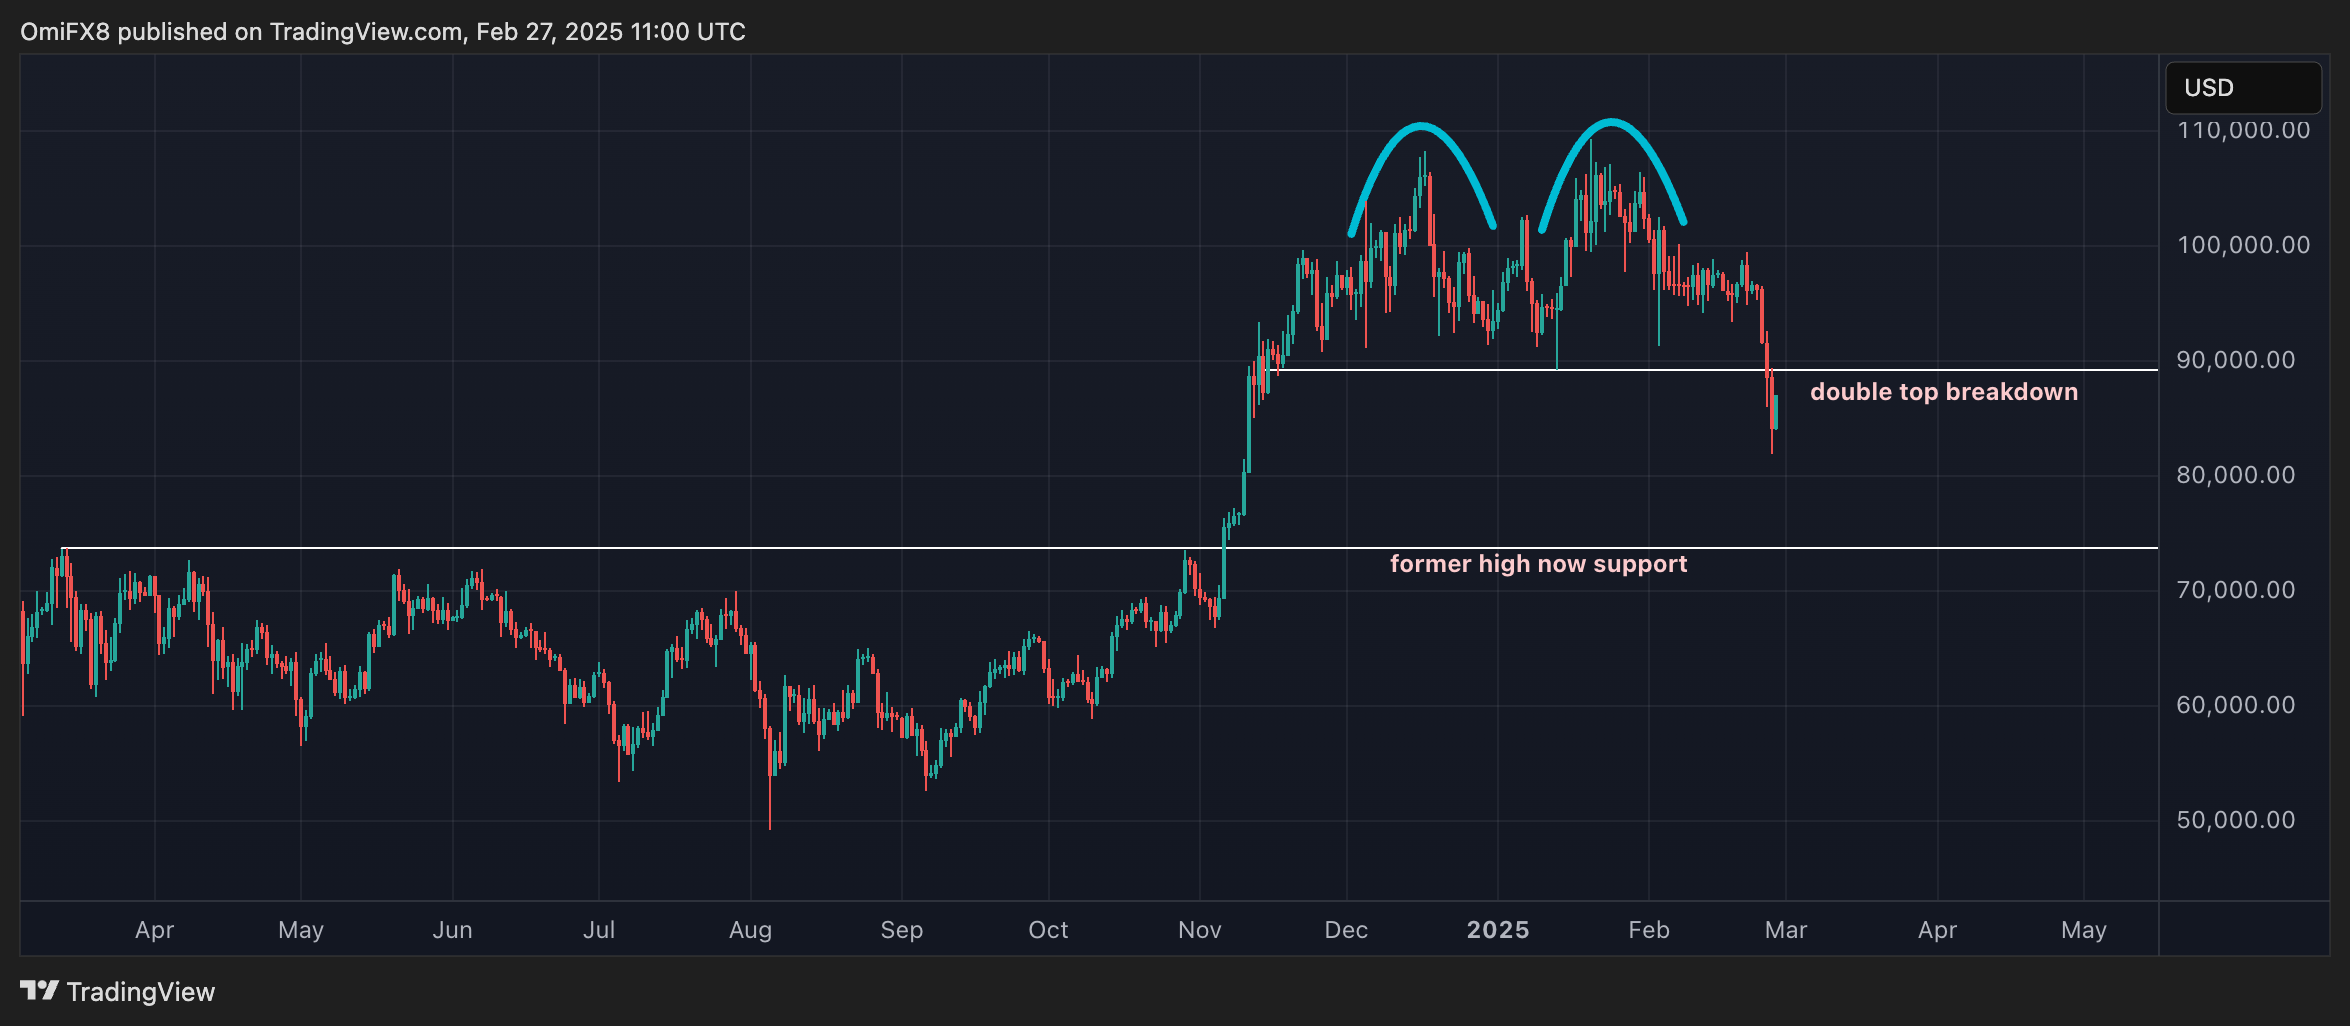
BTC’s double top breakdown has exposed the former resistance-turned-support below $74,000.
On the price chart, there is no other support between $90K and $74K.
Crypto Equities
MicroStrategy (MSTR): closed on Wednesday at $263.27 (+5.09%), up 2.82% at $270.70 in pre-market
Coinbase Global (COIN): closed at $212.96 (+0.22%), up 3.22% at $219.81
Galaxy Digital Holdings (GLXY): closed at C$20.16 (+0.35%)
MARA Holdings (MARA): closed at $12.45 (+0.28%), up 12.93% at $14.06
Riot Platforms (RIOT): closed at $8.94 (-4.08%), up 3.69% at $9.27
Core Scientific (CORZ): closed at $10.02 (+2.66%), up 18.46% at $11.87
CleanSpark (CLSK): closed at $7.88 (-3.31%), up 3.43% at $8.15
CoinShares Valkyrie Bitcoin Miners ETF (WGMI): closed at $17.22 (+1.06%)
Semler Scientific (SMLR): closed at $43.91 (+3.51%), up 1.41% at $44.53
Exodus Movement (EXOD): closed at $44.48 (+11.59%), up 8.48% at $48.25
ETF Flows
Spot BTC ETFs:
Daily net flow: -$754.6 million
Cumulative net flows: $37.13 billion
Total BTC holdings ~ 1,139 million.
Spot ETH ETFs
Daily net flow: -$94.3 million
Cumulative net flows: $2.93 billion
Total ETH holdings ~ 3.714 million.
Source: Farside Investors
Overnight Flows
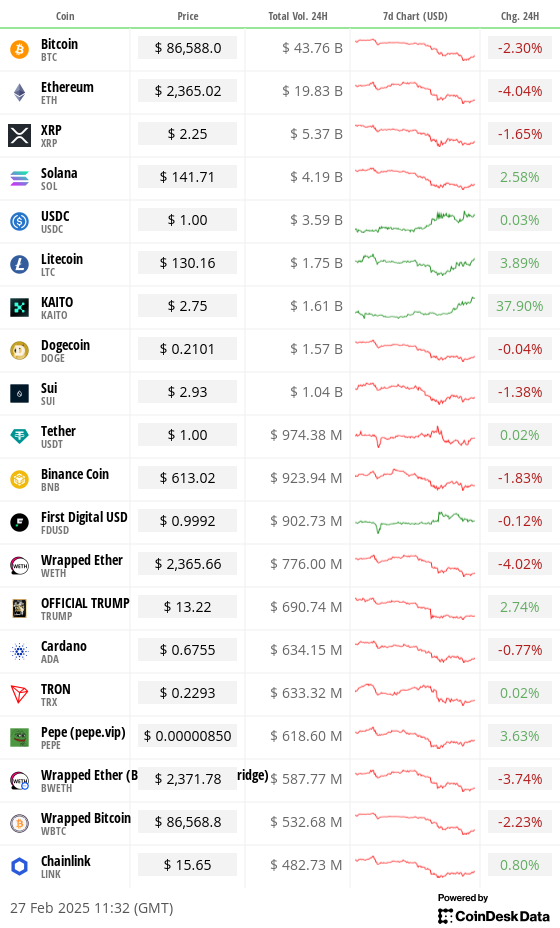
Chart of the Day
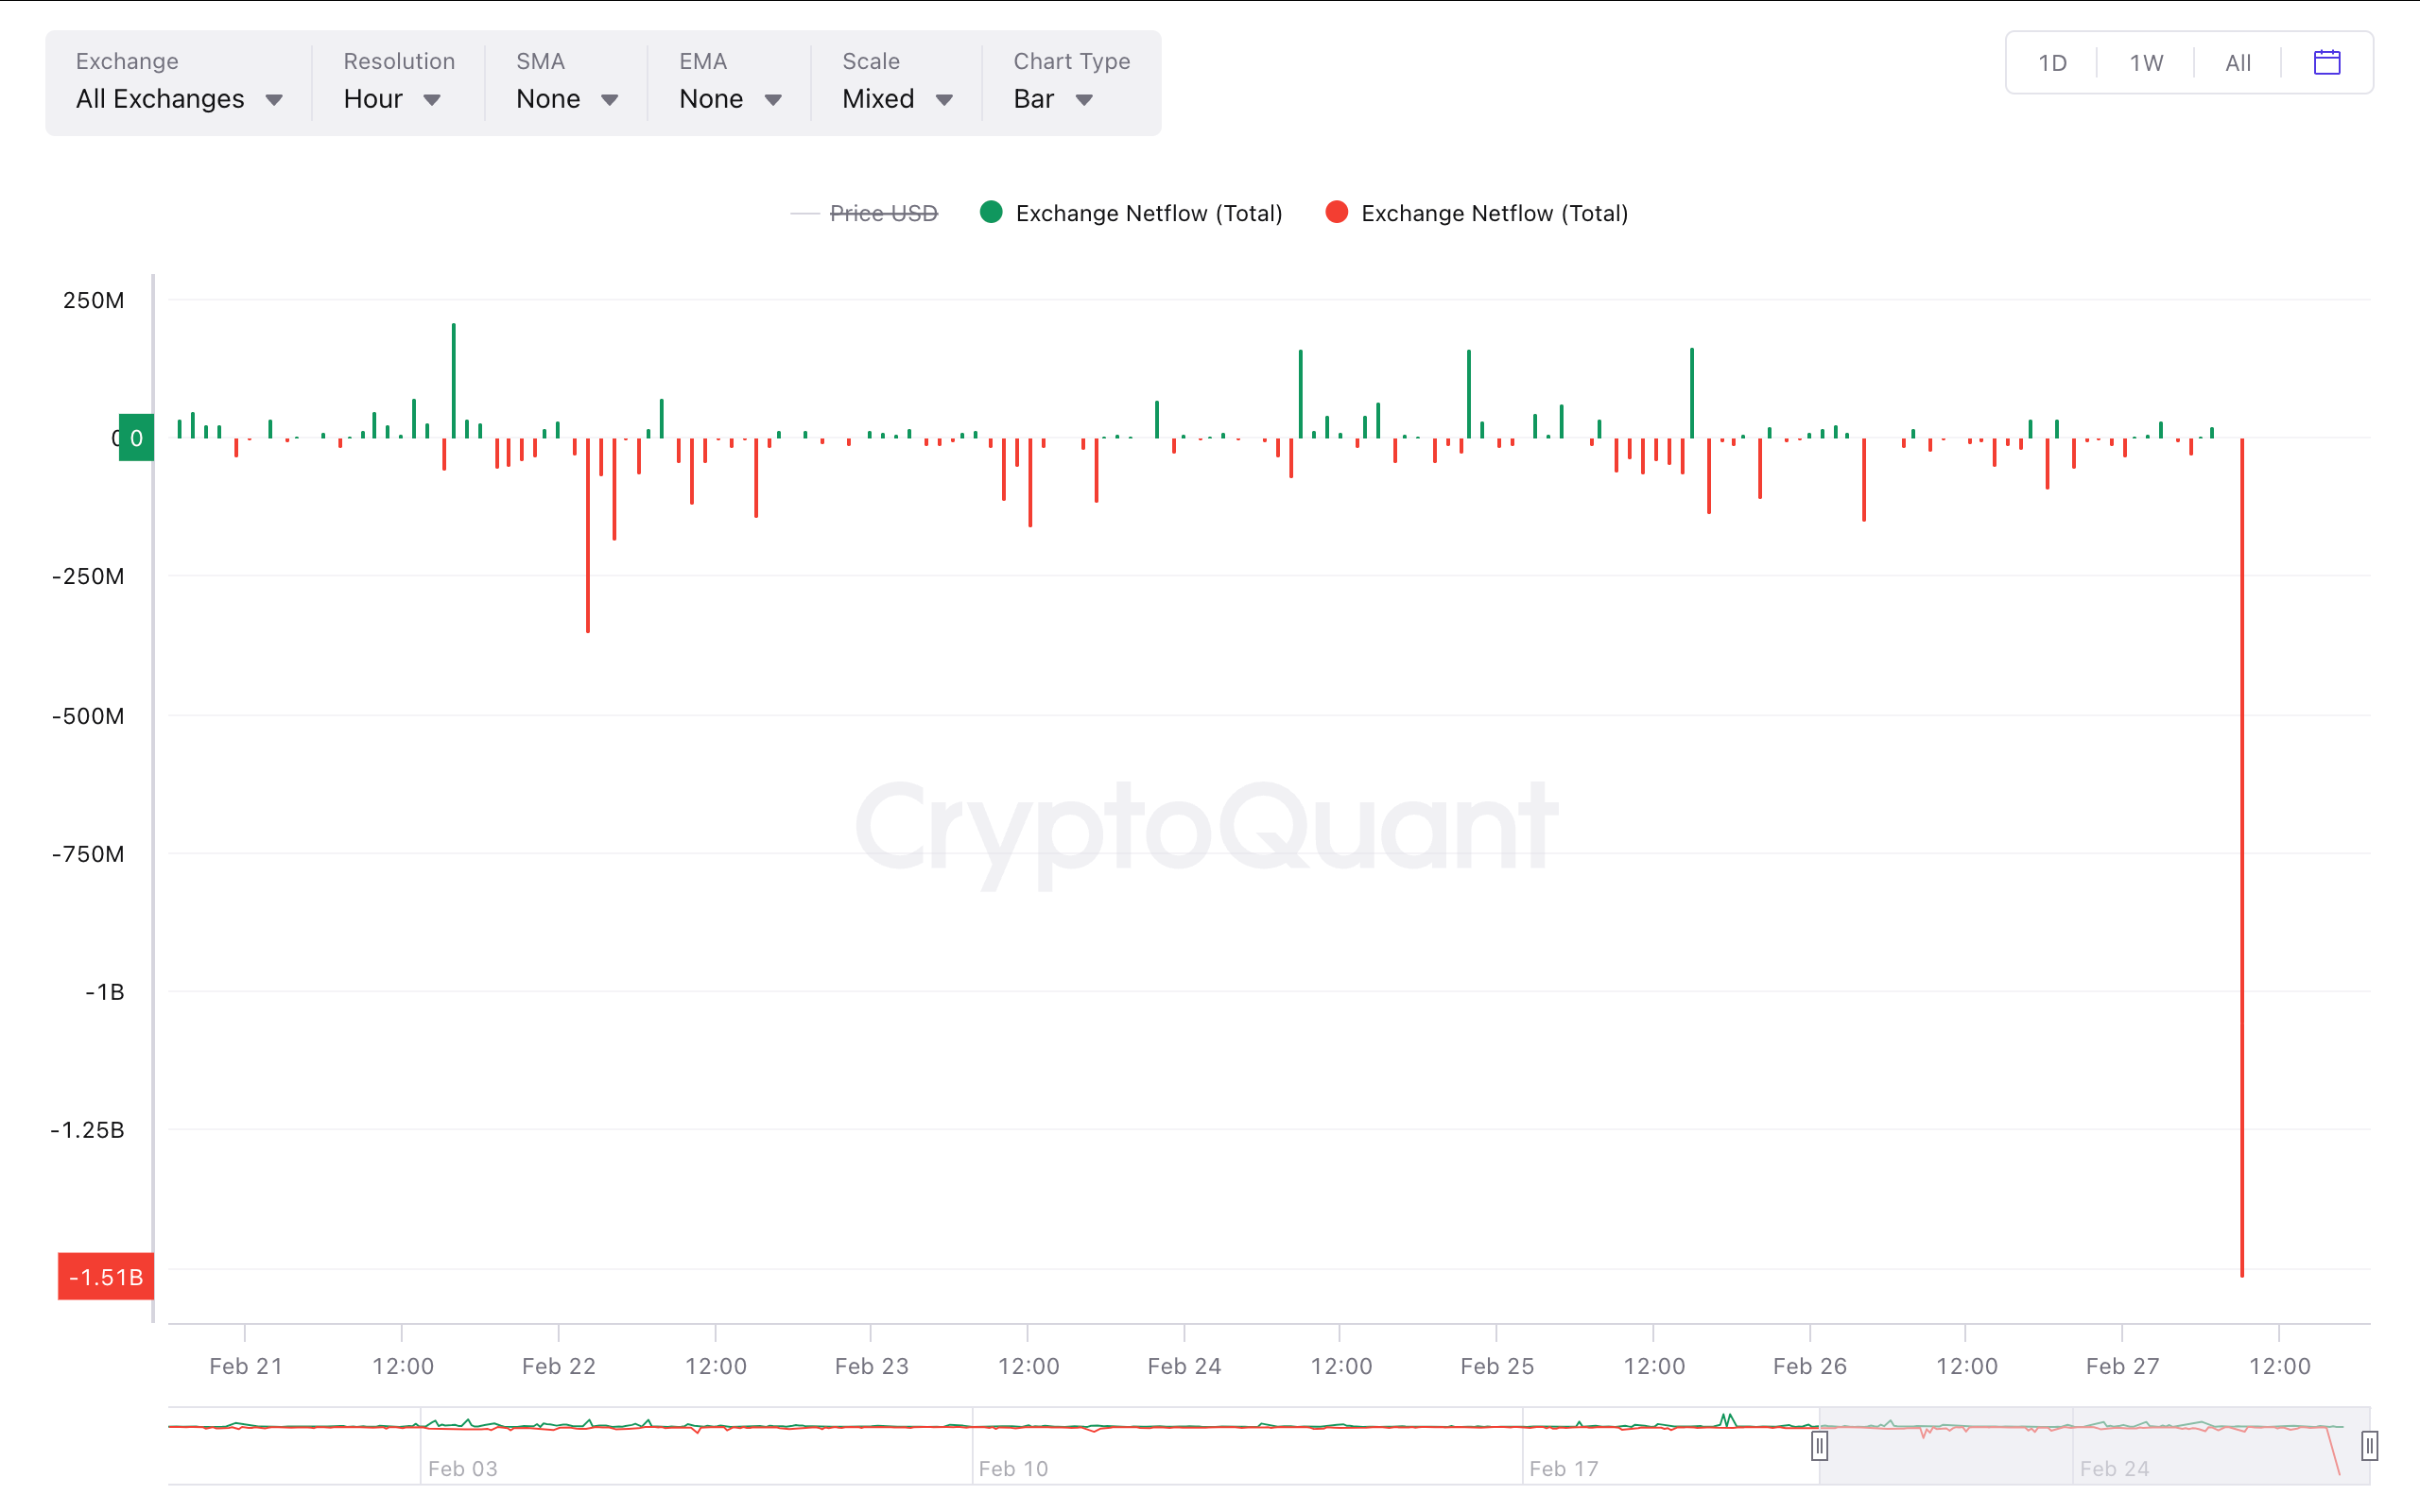
The chart shows a large outflow of the Tether’s dollar-pegged stablecoin USDT from centralized exchanges.
It may be a sign of traders preparing for deeper market downturns or rotation of liquidity out of centralized avenues into decentralized platforms.
While You Were Sleeping
Bitcoin Registers Biggest 3-Day Price Slide Since FTX Debacle. What Next? (CoinDesk): The slide was driven by tighter fiat liquidity and weakening institutional demand. Technical analysis shows the price could drop to around $70,000.
FBI Seeks Crypto Industry Help to Track, Block Laundering of Bybit Hack Funds (CoinDesk): In a public service announcement, the Federal Bureau of Investigation (FBI) listed Ethereum addresses tied to crypto assets recently stolen from Bybit.
Metaplanet Seeks to Raise Over $13M From Bond Sale to Buy More Bitcoin (CoinDesk): Japanese firm Metaplanet Inc (3350) said it is raising another 2 billion yen ($13.3 million) by selling additional ordinary bonds with a 0% interest.
Investors Bet on Sharpest U.S.-Europe Inflation Divergence Since 2022 (Reuters): Data from inflation swap markets suggests stronger growth and tariff pressures will keep U.S. inflation higher than in the eurozone, where falling energy costs will help keep prices in check.
Trump Shocks Europe Into Chasing Billions for Military Buildup (Bloomberg): European leaders are overhauling defense funding by revising fiscal rules, enabling joint borrowing and repurposing recovery funds to boost military capabilities amid rising security challenges.
Trump Axes Chevron’s Venezuela Oil License, Citing Lack of Electoral Reforms (Reuters): President Trump announced on Truth Social that he is reversing a two-year-old Biden-era license that allowed Chevron (CVX) to operate in Venezuela.
Argentina Memecoin Scandal Dents Milei’s Hunt for Election Allies (Reuters): President Milei’s promotion of the LIBRA token — which crashed shortly after launch — and the subsequent investigations have complicated his efforts to build political alliances ahead of midterm elections.
In the Ether
Strategy (MSTR), the world’s largest corporate owner of bitcoin (BTC), appeared to miss out on capitalizing on last week’s market rout to purchase the dip in prices.
According to Monday’s press release, the firm bought 220 BTC at an average price of $123,561. The company used the proceeds of selling its various preferred stocks (STRF, STRK, STRD), raising $27.3 million.
That purchase price was well above the prices the largest crypto changed hands in the second half of the week. Bitcoin nosedived from above $123,000 on Thursday to as low as $103,000 on late Friday during one, if not the worst crypto flash crash on record, liquidating over $19 billion in leveraged positions.
That move occurred as Trump said to impose a 100% increase in tariffs against Chinese goods as a retaliation for tightening rare earth metal exports, reigniting fears of a trade war between the two world powers.
At its lowest point on Friday, BTC traded nearly 16% lower than the average of Strategy’s recent purchase price. Even during the swift rebound over the weekend, the firm could have bought tokens between $110,000 and $115,000, at a 7%-10% discount compared to what it paid for.
With the latest purchase, the firm brought its total holdings to 640,250 BTC, at an average acquisition price of $73,000 since starting its bitcoin treasury plan in 2020.
MSTR, the firm’s common stock, was up 2.5% on Monday.
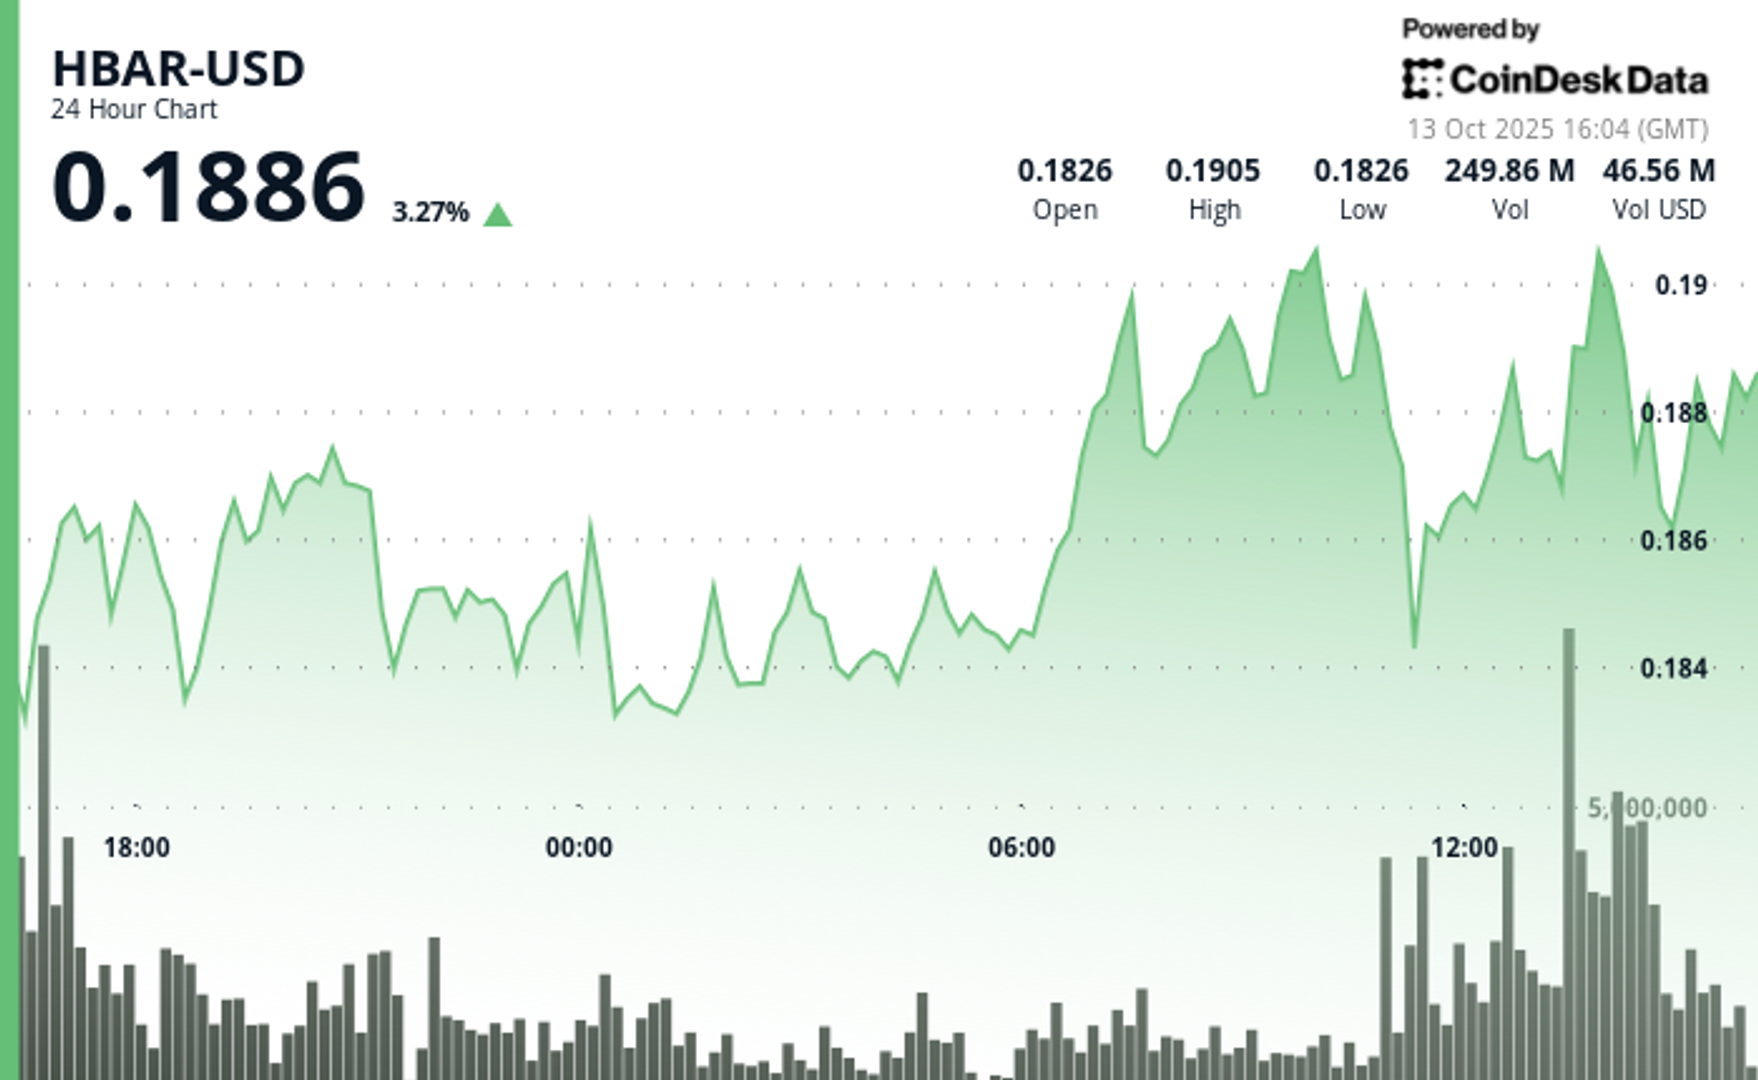
HBAR (Hedera Hashgraph) experienced pronounced volatility in the final hour of trading on Oct. 13, soaring from $0.187 to a peak of $0.191—a 2.14% intraday gain—before consolidating around $0.190.
The move was driven by a dramatic surge in trading activity, with a standout 15.65 million tokens exchanged at 13:31, signaling strong institutional participation. This decisive volume breakout propelled the asset beyond its prior resistance range of $0.190–$0.191, establishing a new technical footing amid bullish momentum.
The surge capped a broader 23-hour rally from Oct. 12 to 13, during which HBAR advanced roughly 9% within a $0.17–$0.19 bandwidth. This sustained upward trajectory was characterized by consistent volume inflows and a firm recovery from earlier lows near $0.17, underscoring robust market conviction. The asset’s ability to preserve support above $0.18 throughout the period reinforced confidence among traders eyeing continued bullish action.
Strong institutional engagement was evident as consecutive high-volume intervals extended through the breakout window, suggesting renewed accumulation and positioning for potential continuation. HBAR’s price structure now shows resilient support around $0.189–$0.190, signaling the possibility of further upside if momentum persists and broader market conditions remain favorable.
")
Technical Indicators Highlight Bullish Sentiment
- HBAR operated within a $0.017 bandwidth (9%) spanning $0.174 and $0.191 throughout the previous 23-hour period from 12 October 15:00 to 13 October 14:00.
- Substantial volume surges reaching 179.54 million and 182.77 million during 11:00 and 13:00 sessions on 13 October validated positive market sentiment.
- Critical resistance materialized at $0.190-$0.191 thresholds where price movements encountered persistent selling activity.
- The $0.183-$0.184 territory established dependable support through volume-supported bounces.
- Extraordinary volume explosion at 13:31 registering 15.65 million units signaled decisive breakout event.
- High-volume intervals surpassing 10 million units through 13:35 substantiated significant institutional engagement.
- Asset preserved support above $0.189 despite moderate profit-taking activity.
Disclaimer: Parts of this article were generated with the assistance from AI tools and reviewed by our editorial team to ensure accuracy and adherence to our standards. For more information, see CoinDesk’s full AI Policy.

The crypto market staged a recovery on Monday following the weekend’s $500 billion bloodbath that resulted in a $10 billion drop in open interest.
Bitcoin (BTC) rose by 1.4% while ether (ETH) outperformed with a 2.5% gain. Synthetix (SNX, meanwhile, stole the show with a 120% rally as traders anticipate «perpetual wars» between the decentralized trading venue and HyperLiquid.
Plasma (XPL) and aster (ASTER) both failed to benefit from Monday’s recovery, losing 4.2% and 2.5% respectively.
Derivatives Positioning
- The BTC futures market has stabilized after a volatile period. Open interest, which had dropped from $33 billion to $23 billion over the weekend, has now settled at around $26 billion. Similarly, the 3-month annualized basis has rebounded to the 6-7% range, after dipping to 4-5% over the weekend, indicating that the bullish sentiment has largely returned. However, funding rates remain a key area of divergence; while Bybit and Hyperliquid have settled around 10%, Binance’s rate is negative.
- The BTC options market is showing a renewed bullish lean. The 24-hour Put/Call Volume has shifted to be more in favor of calls, now at over 56%. Additionally, the 1-week 25 Delta Skew has risen to 2.5% after a period of flatness.
- These metrics indicate a market with increasing demand for bullish exposure and upside protection, reflecting a shift away from the recent «cautious neutrality.»
- Coinglass data shows $620 million in 24 hour liquidations, with a 34-66 split between longs and shorts. ETH ($218 million), BTC ($124 million) and SOL ($43 million) were the leaders in terms of notional liquidations. Binance liquidation heatmap indicates $116,620 as a core liquidation level to monitor, in case of a price rise.
Token Talk
By Oliver Knight
- The crypto market kicked off Monday with a rebound in the wake of a sharp weekend leverage flush. According to data from CoinMarketCap, the total crypto market cap climbed roughly 5.7% in the past 24 hours, with volume jumping about 26.8%, suggesting those liquidated at the weekend are repurchasing their positions.
- A total of $19 billion worth of derivatives positions were wiped out over the weekend with the vast majority being attributed to those holding long positions, in the past 24 hours, however, $626 billion was liquidated with $420 billion of that being on the short side, demonstrating a reversal in sentiment, according to CoinGlass.
- The recovery has been tentative so far; the dominance of Bitcoin remains elevated at about 58.45%, down modestly from recent highs, which implies altcoins may still lag as capital piles back into safer large-cap names.
- The big winner of Monday’s recovery was synthetix (SNX), which rose by more than 120% ahead of a crypto trading competition that will see it potentially start up «perpetual wars» with HyperLiquid.


Strategy Bought $27M in Bitcoin at $123K Before Crypto Crash

HBAR Rises Past Key Resistance After Explosive Decline

Crypto Markets Today: Bitcoin and Altcoins Recover After $500B Crash
-

 Business12 месяцев ago
3 Ways to make your business presentation more relatable
-
Fashion12 месяцев ago
According to Dior Couture, this taboo fashion accessory is back
-
Entertainment12 месяцев ago
10 Artists who retired from music and made a comeback
-
Entertainment12 месяцев ago
\’Better Call Saul\’ has been renewed for a fourth season
-
Entertainment12 месяцев ago
New Season 8 Walking Dead trailer flashes forward in time
-

 Uncategorized4 месяца ago
Robinhood Launches Micro Bitcoin, Solana and XRP Futures Contracts
-
Business12 месяцев ago
15 Habits that could be hurting your business relationships
-
Entertainment12 месяцев ago
Meet Superman\’s grandfather in new trailer for Krypton