Uncategorized
Bitcoin Traders Eye Upside as BTC Holds Above $110K: Crypto Daybook Americas

By James Van Straten (All times ET unless indicated otherwise)
As August draws toward a close, bitcoin (BTC) bulls may welcome the end of a modest pullback, with the largest cryptocurrency down around 4% for the month and 12% off its all-time high of $124,500.
For now, it’s little changed around $110,580, up less than 0.5% over 24 hours while ether (ETH) has added 3.4%. The CoinDesk 20 index, a measure of the broader market, rose 2.7% in the same period.
A negative end to August would halt a streak of four consecutive green months, the longest run since March last year. Encouragingly, August has held up better than in the past three years, and September should bring a pickup in trading activity as the holiday season winds down.
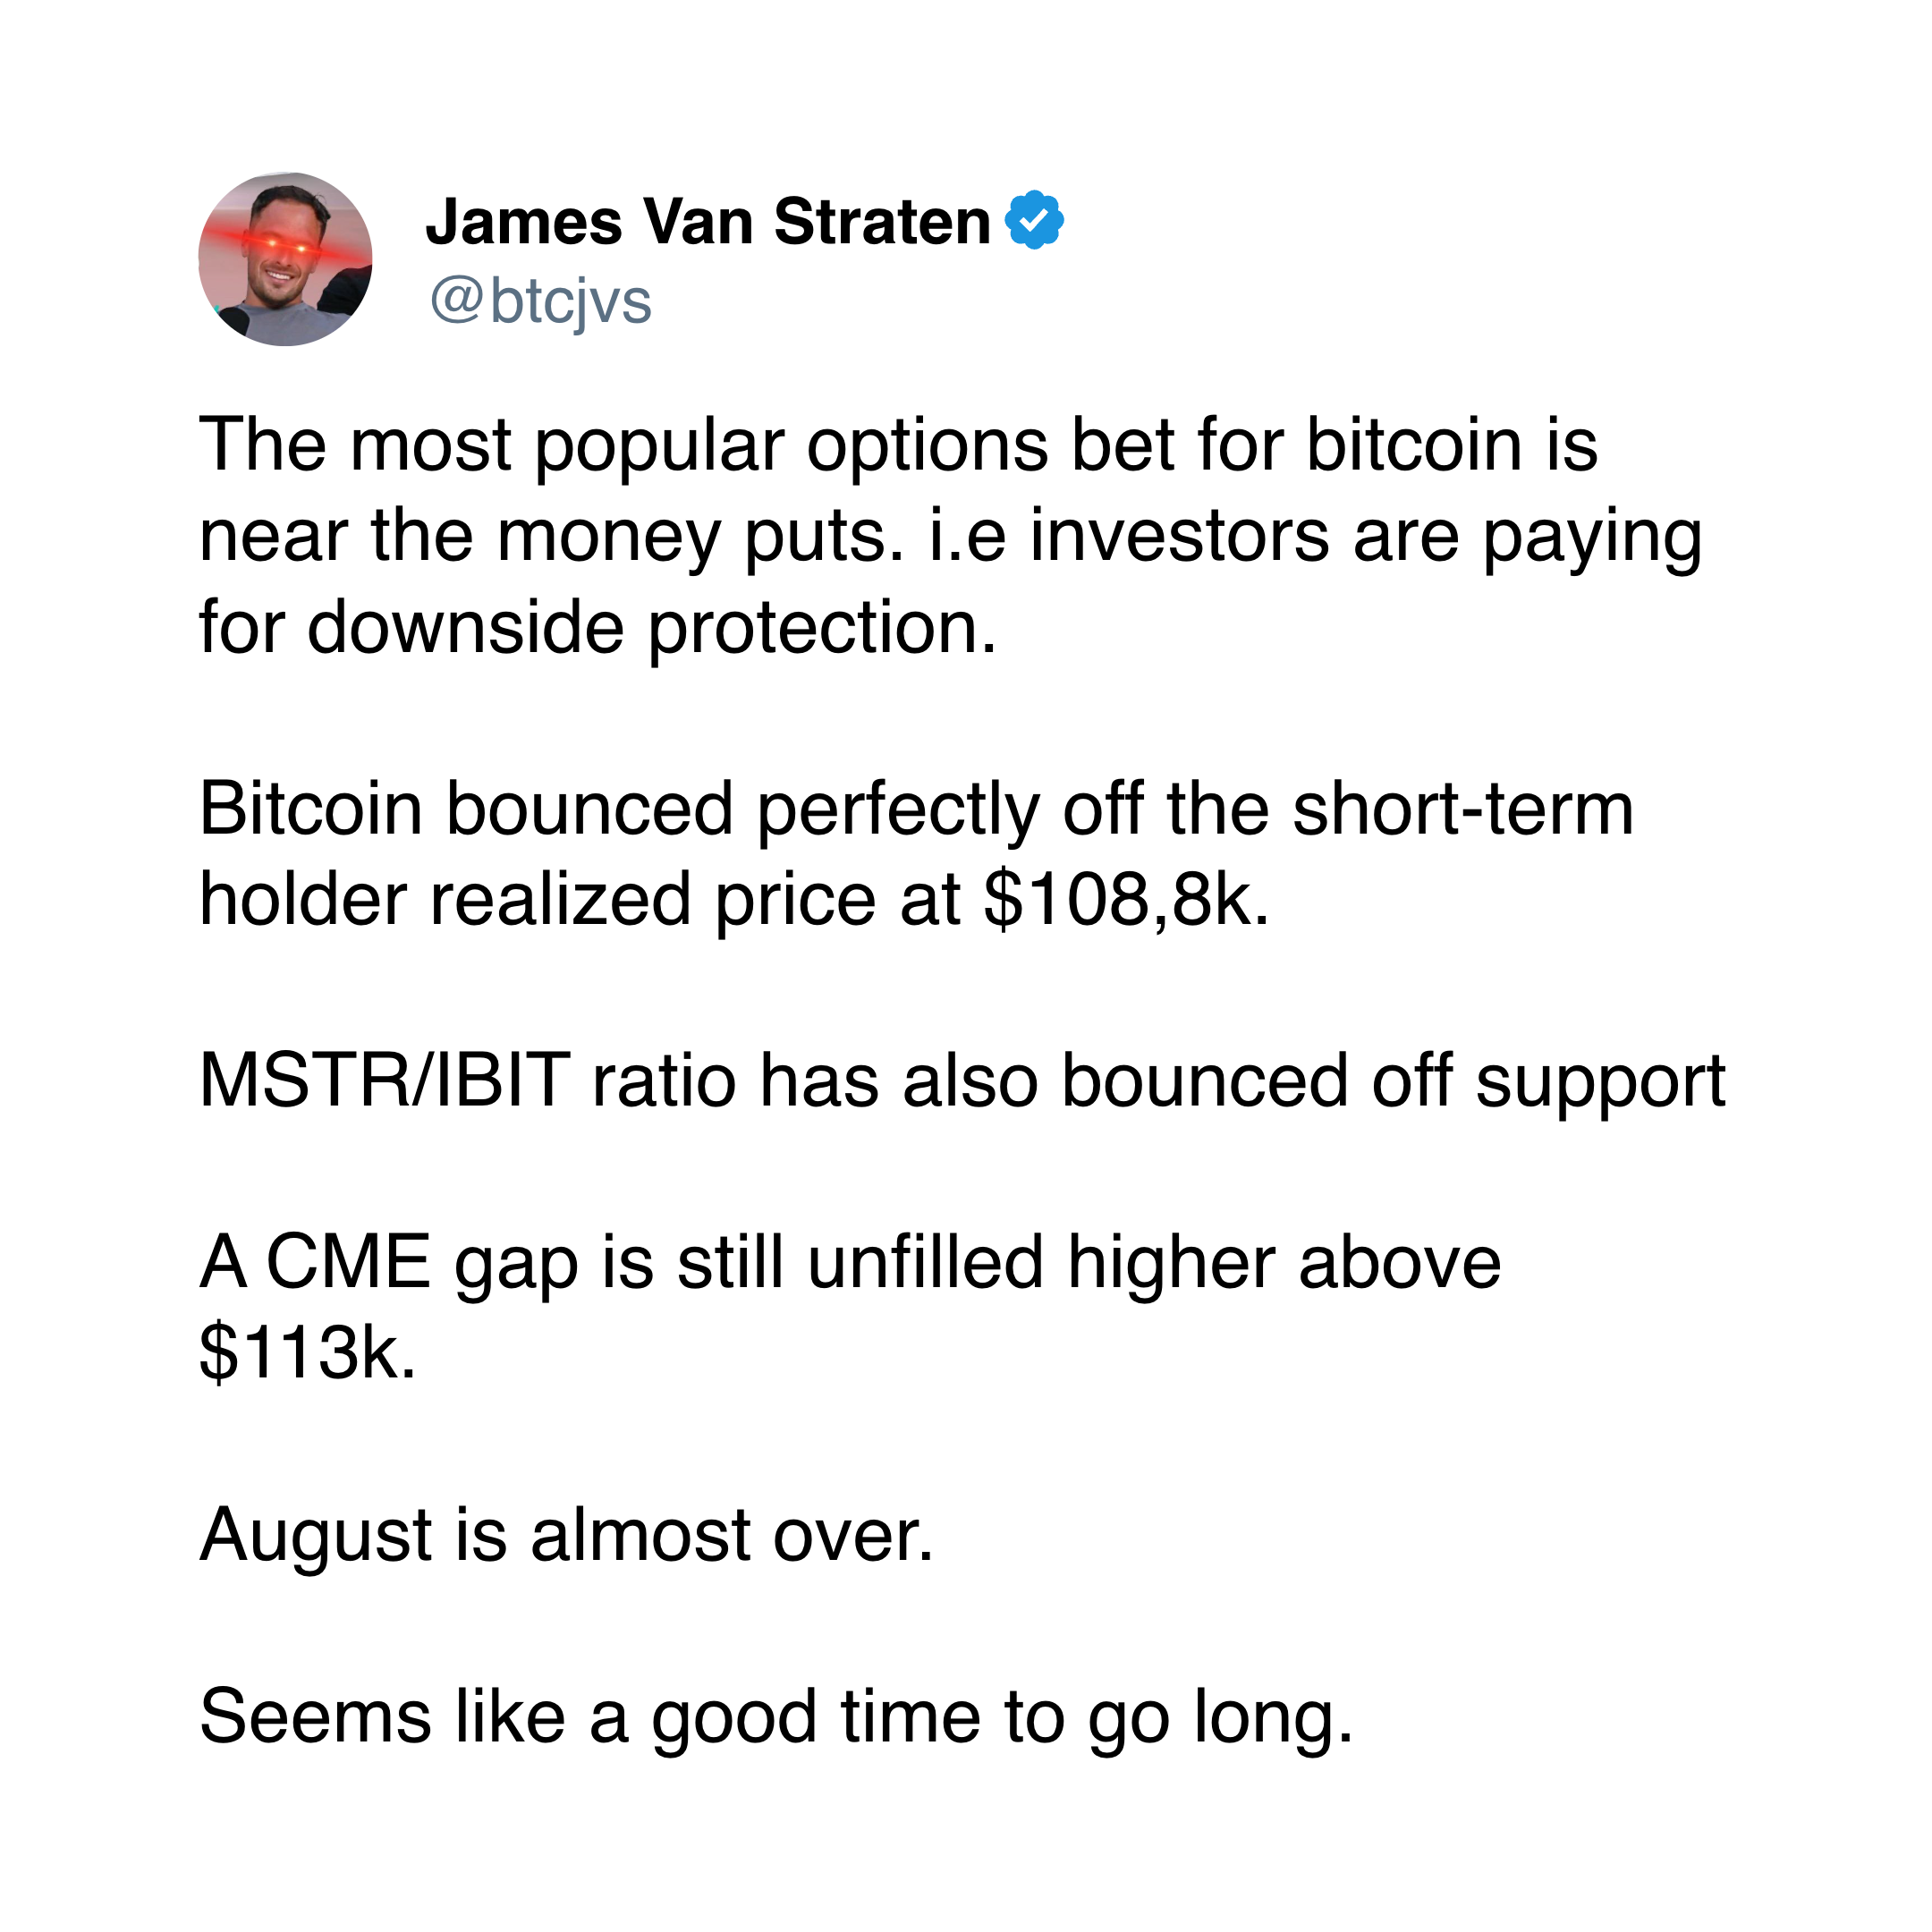
On-chain data shows bitcoin traders used the Short-Term Holder Realized Price (STH-RP), currently $108,800, as support. This metric tracks the average acquisition price of coins moved on-chain in the past 155 days and excludes exchange reserves. In bull markets, the STH RP often acts as a key support level.
The Short-Term Holder Spent Output Profit Ratio (STH-SOPR), which measures profits or losses on coins younger than 155 days, indicates that short-term investors are currently selling at a loss. Historically, this behavior tends to appear near local market bottoms. But capitulation has yet to be seen.
Meanwhile, the options market points to a “max pain” level at $116,000. Max pain is the strike price at which the largest number of options expire worthless, generally causing the greatest financial pain to option holders and greatest benefit to options sellers. With this level above the spot price, it suggests upside relief could be on the horizon.
Beyond crypto, U.S. trade tensions escalated again as Washington imposed 50% tariffs on India, doubling earlier duties after talks broke down. The move, aimed at curbing India’s purchases of Russian oil, highlights strained ties between President Donald Trump and Indian Prime Minister Narendra Modi. Analysts warn of falling exports, job losses and a potential 1% drag on GDP growth.
For bitcoin traders, the key range to watch is $113,500 to $117,200, where the CME futures gap remains open. Historically, such gaps tend to be filled, making this zone one to monitor closely. Stay alert.
What to Watch
- Crypto
- Aug. 27, 3 a.m.: Mantle Network (MNT), an Ethereum layer-2 blockchain, will roll out its mainnet upgrade to version 1.3.1, enabling support for Ethereum’s Prague update and introducing new features for platform users and developers.
- Macro
- Aug. 28, 8 a.m.: Mexico’s National Institute of Statistics and Geography releases July unemployment rate data.
- Unemployment Rate Est. 2.9% vs. Prev. 2.7%
- Aug. 28, 8:30 a.m.: The U.S. Bureau of Economic Analysis (BEA) releases (2nd Estimate) Q2 GDP data.
- Core PCE Prices QoQ st. 2.6% vs. Prev. 3.5%
- GDP Growth Rate QoQ Est. 3.1% vs. Prev. -0.5%
- GDP Price Index QoQ Est. 2% vs. Prev. 3.8%
- GDP Sales QoQEst. 6.3% vs. Prev. -3.1%
- PCE Prices QoQ Est. 2.1% vs. Prev. 3.7%
- Real Consumer Spending QoQ Est. 1.4% vs. Prev. 0.5%
- Aug. 28, 1:30 p.m.: Uruguay’s National Statistics Institute releases July unemployment rate data.
- Unemployment Rate Prev. 7.3%
- Aug. 28, 6:00 p.m.: Fed Governor Christopher J. Waller will speak on “Payments” at the Economic Club of Miami Dinner, Miami, Fla. Watch live.
- Aug. 29, 8:30 a.m.: Statistics Canada releases Q2 GDP data.
- GDP Growth Rate Annualized Est. -0.6% vs. Prev. 2.2%
- GDP Growth Rate QoQ Prev. 0.5%
- Aug. 29, 8:30 a.m.: The U.S. Bureau of Economic Analysis (BEA) releases July consumer income and expenditure data.
- Core PCE Price Index MoM Est. 0.3% vs. Prev. 0.3%
- Core PCE Price Index YoY Est. 2.9% vs. Prev. 2.8%
- PCE Price Index MoM Est. 0.2% vs. Prev. 0.3%
- PCE Price Index YoY Est. 2.6% vs. Prev. 2.6%
- Personal Income MoM Est. 0.4% vs. Prev. 0.3%
- Personal Spending MoM Est. 0.5% vs. Prev. 0.3%
- Aug. 29, 11 a.m.: Colombia’s National Administrative Department of Statistics (DANE) releases July unemployment rate data.
- Unemployment Rate Est. 8.9% vs. Prev. 8.6%
- Aug. 28, 8 a.m.: Mexico’s National Institute of Statistics and Geography releases July unemployment rate data.
- Earnings (Estimates based on FactSet data)
- Aug. 27: NVIDIA (NVDA), post-market, $1.00
- Aug. 28: IREN (IREN), post-market, $0.18
Token Events
- Governance votes & calls
- Aug. 27: Flux (FLUX) to host ask me anything on progress of ArcaneOS, FluxAI Agents, and FusionX beta.
- Aug. 27: Sui (SUI) to host ecosystem X spaces with Ledger at 11 a.m.
- Aug. 27: Helium (HNT) to host community call on Discord at 12 p.m.
- Aug. 27: Sushi (SUSHI) to host ask me anything on X spaces at 1 p.m.
- Unlocks
- Aug. 28: Jupiter (JUP) to unlock 1.78% of its circulating supply worth $26.36 million.
- Sep. 1: Sui (SUI) to release 1.25% of its circulating supply worth $153.1 million.
- Sep. 2: Ethena (ENA) to release 0.64% of its circulating supply worth $25.64 million.
- Sep. 5: Immutable (IMX) to unlock 1.27% of its circulating supply worth $13.26 million.
- Token Launches
- Aug. 27: Bitlayer (BTR) to list on Kraken, KuCoin and LBank
- Aug. 27: sBTC (SBTC) to list on Moso.
Conferences
The CoinDesk Policy & Regulation conference (formerly known as State of Crypto) is a one-day boutique event held in Washington on Sept. 10 that allows general counsels, compliance officers and regulatory executives to meet with public officials responsible for crypto legislation and regulatory oversight. Space is limited. Use code CDB15 for 15% off your registration through Sept. 1.
- Aug. 27: Blockchain Leaders Summit 2025 (Tokyo)
- Aug. 27-28: Stablecoin Conference 2025 (Mexico City)
- Aug. 28-29: Bitcoin Asia 2025 (Hong Kong)
- Sept. 3-5: bitcoin++ (Istanbul)
Token Talk
By Oliver Knight
- Cronos (CRO) defied Tuesday’s bearish crypto sentiment, rallying more than 56% after Crypto.com and Trump Media (DJT) said they planned to create a $6.4 billion CRO treasury company.
- Crypto treasury announcements have occurred almost daily over the past month as companies begin to adopt and adapt the approach pioneered by Michael Saylor’s Strategy (MSTR).
- Still, the price action often fails to match what might be perceived as a bullish event. When Verb Technology Co. (VERB) announced a $558 million private placement to establish a toncoin (TON) treasury, TON almost immediately fell by around 10%.
- This CRO deal is different. Firstly it is tied to Trump Media, a company linked to President Donald Trump, but secondly — and arguably more importantly — it gives a use case to the cronos token that was previously used predominately as an exchange token for Crypto.com.
- The deal includes the creation of a new rewards system on Truth Social that will allow users to convert the platform’s “gems” into CRO tokens, with further plans to enable subscription payments and discounted services using CRO.
- Bloomberg noted that Crypto.com CEO Kris Marszalek donated $1 million to Trump’s inaugural committee and also visited Trump’s Mar-a-Lago home after the election victory.
- CRO currently trades at $0.225 despite being down at $0.141 last week, the news lifted 24 hour trading volume up by 1,300% to more than $1 billion as it became a market outlier while bitcoin and ether languished near critical levels of support.
Derivatives Positioning
- Bitcoin open interest (OI) across top derivatives venues has started to slip, which is in line with the downward price action over the past few days, implying traders are actively exiting their leveraged positions.
- BTC OI now stands at $30.3 billion, just shy of the all time high at $32.6 billion, Velo data shows. Three-month annualized basis is still rising, and is currently 8%- 9% across all exchanges, implying that the basis trade is still profitable.
- In options, bitcoin’s upward-sloping implied volatility curve suggests the market expects long-term volatility to be higher than short-term, while other metrics point to a more immediate bearish outlook.
- Specifically, the recent move of the 25 delta skew into negative territory for near-term maturities indicates a clear shift in market sentiment, with traders paying a premium for puts over calls to gain downside protection.
- The bearish sentiment is confirmed by the 24-hour put/call volume, which shows a significant skew towards puts, another sign traders are actively hedging against or speculating on a price decline.
- Funding rate APRs across major perpetual swap venues are starting to bounce back at around 8%-10% annualized, according to Velo data.
- BTC annualized funding on Binance turned negative (-0.39%) for a short period today before bouncing back to around 10%. This indicates that while there may have been pockets of bearish sentiment, the overall market trend is starting to be more supportive by traders willing to pay a premium to bet on a price increase.
- Coinglass data shows $266 million in 24 hour liquidations, skewed 58% towards shorts. ETH ($99 million), BTC ($47 million) and SOL ($20 million) were the leaders in terms of notional liquidations. The Binance liquidation heatmap indicates $111,593 as a core liquidation level to monitor in case of a price rise.
Market Movements
- BTC is down 0.34% from 4 p.m. ET Tuesday at $110,981.61 (24hrs: +0.72%)
- ETH is up 0.41% at $4,605.94 (24hrs: +3.56%)
- CoinDesk 20 is up 0.11% at 4,130.44 (24hrs: +3.15%)
- Ether CESR Composite Staking Rate is down 2 bps at 2.93%
- BTC funding rate is at 0.0076% (8.3297% annualized) on Binance

- DXY is up 0.37% at 98.59
- Gold futures are unchanged at $3,431.20
- Silver futures are down 0.65% at $38.35
- Nikkei 225 closed up 0.3% at 42,520.27
- Hang Seng closed down 1.27% at 25,201.76
- FTSE is unchanged at 9,273.12
- Euro Stoxx 50 is up 0.16% at 5,392.10
- DJIA closed on Tuesday up 0.3% at 45,418.07
- S&P 500 closed up 0.41% at 6,465.94
- Nasdaq Composite closed up 0.44% at 21,544.27
- S&P/TSX Composite closed up 0.6% at 28,339.88
- S&P 40 Latin America closed down 0.43% at 2,715.37
- U.S. 10-Year Treasury rate is up 1.5 bps at 4.271%
- E-mini S&P 500 futures are unchanged at 6,485.25
- E-mini Nasdaq-100 futures are unchanged at 23,596.00
- E-mini Dow Jones Industrial Average Index are unchanged at 45,516.00
Bitcoin Stats
- BTC Dominance: 58.03% (-0.29%)
- Ether-bitcoin ratio: 0.04129 (0.32%)
- Hashrate (seven-day moving average): 960 EH/s
- Hashprice (spot): $54.07
- Total fees: 3.19 BTC / $351,661
- CME Futures Open Interest: 137,600 BTC
- BTC priced in gold: 32.8 oz.
- BTC vs gold market cap: 9.28%
Technical Analysis
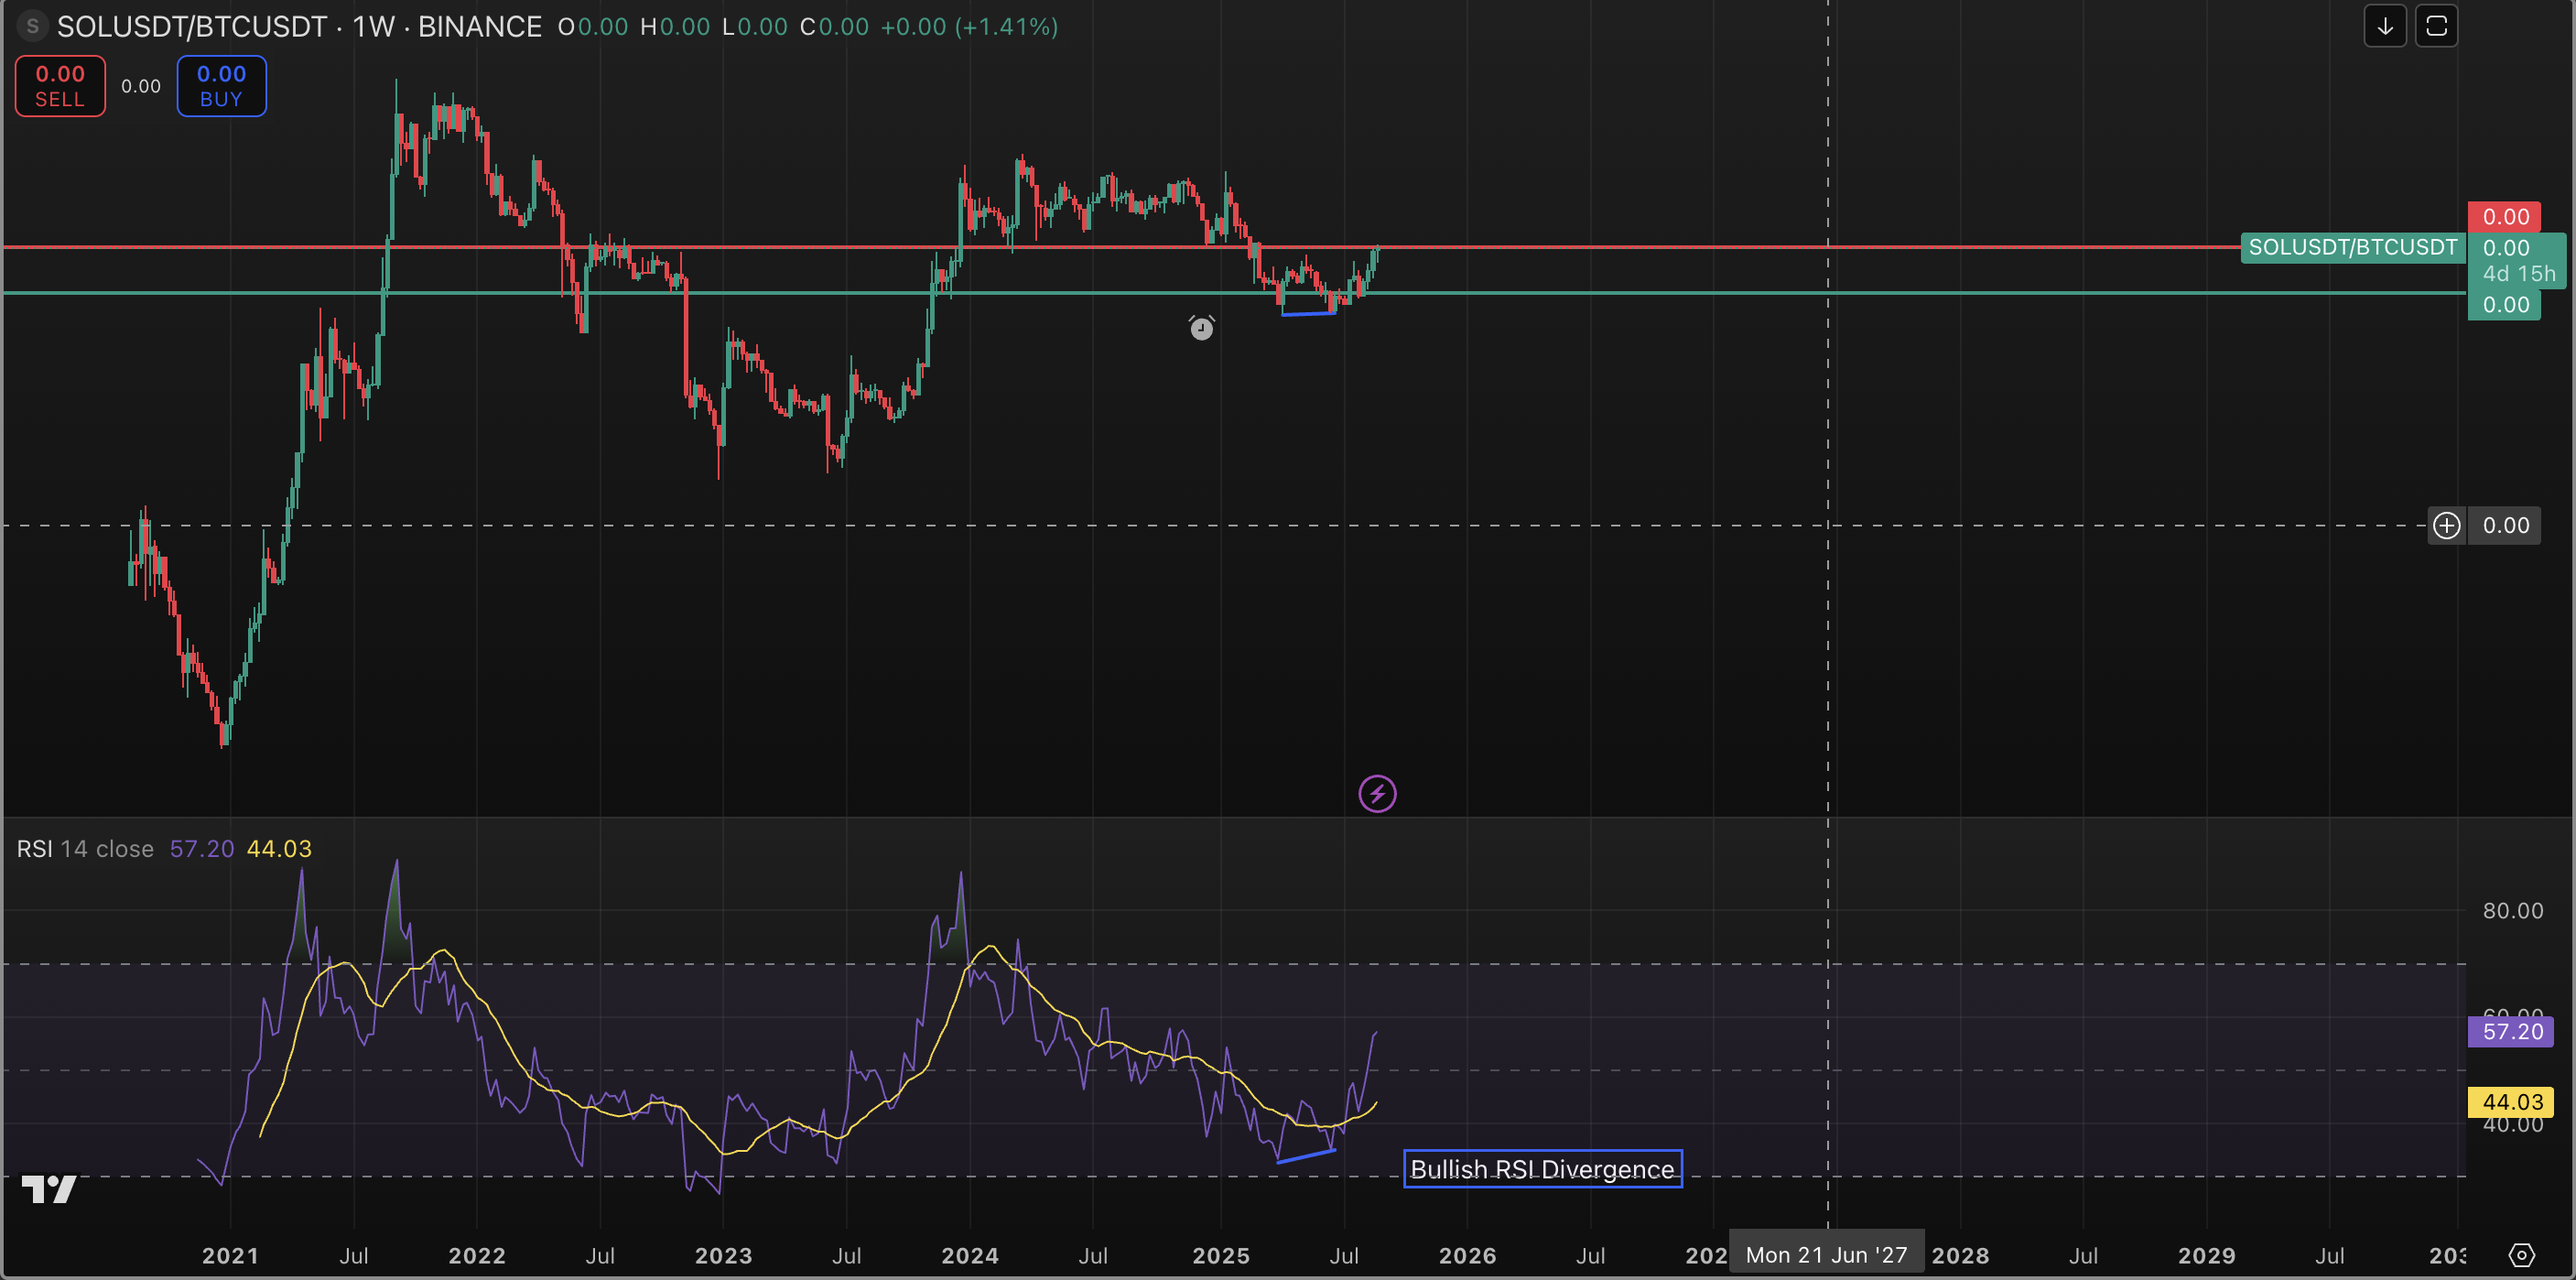
- The SOL-BTC weekly chart is approaching a key resistance level that, at the moment, is looking likely to be broken.
- This SOL strength is more of a result of a bullish RSI divergence that seems to be already in play, as confirmed by the magnitude of the move.
- The ratio acts as a good proxy for the strength of altcoins in general, and a confirmed break in the pair would signal continued strength in select altcoins relative to BTC.
Crypto Equities
- Strategy (MSTR): closed on Tuesday at $351.36 (+2.38%), -0.6% at $349.26 in pre-market
- Coinbase Global (COIN): closed at $308.48 (+0.81%), -0.28% at $307.62
- Circle (CRCL): closed at $129.05 (+3.04%), -0.46% at $128.45
- Galaxy Digital (GLXY): closed at $24.72 (+0.69%), +0.36% at $24.81
- Bullish (BLSH): closed at $66.08 (+1.38%), -0.42% at $65.80
- MARA Holdings (MARA): closed at $15.84 (+2.86%), -0.63% at $15.74
- Riot Platforms (RIOT): closed at $13.69 (+3.09%), -0.88% at $13.57
- Core Scientific (CORZ): closed at $14.04 (+2.63%), +0.36% at $14.09
- CleanSpark (CLSK): closed at $9.68 (+2.43%), -0.41% at $9.64
- CoinShares Valkyrie Bitcoin Miners ETF (WGMI): closed at $29.39 (+2.73%)
- Semler Scientific (SMLR): closed at $30.79 (+2.56%)
- Exodus Movement (EXOD): closed at $26.98 (+2.74%)
- SharpLink Gaming (SBET): closed at $19.92 (+3.91%), -1.2% at $19.68
ETF Flows
Spot BTC ETFs
- Daily net flows: $88.1 million
- Cumulative net flows: $54.08 billion
- Total BTC holdings ~1.29 million
Spot ETH ETFs
- Daily net flows: $455 million
- Cumulative net flows: $13.34 billion
- Total ETH holdings ~6.43 million
Source: Farside Investors
Chart of the Day
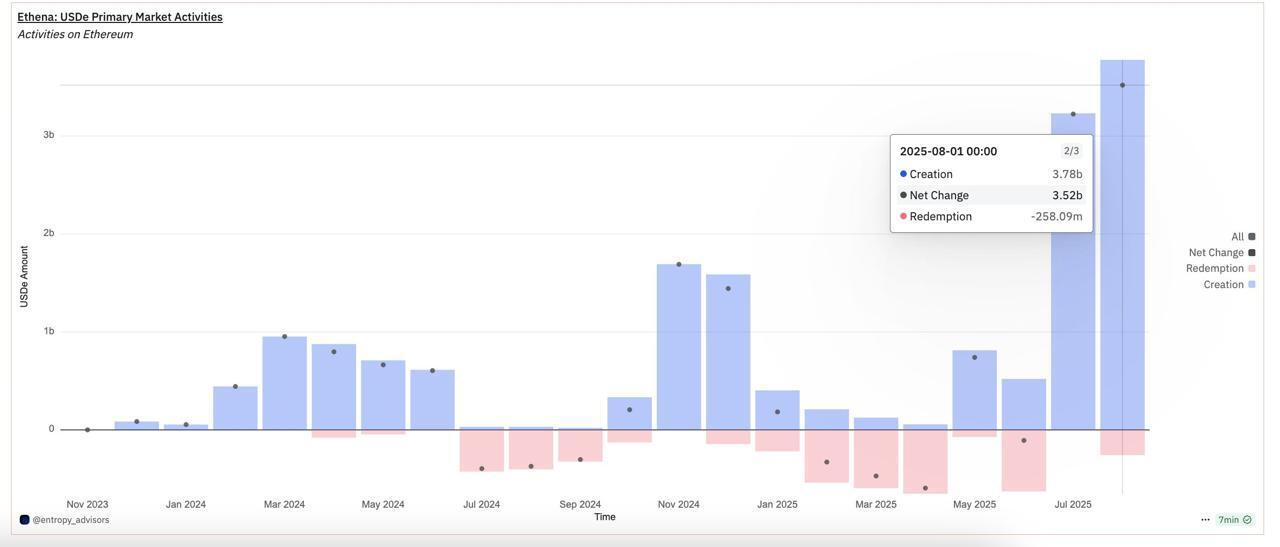
- In August, creation of Ethena’s USDe stablecoin reached a record high, with over $3.78 billion in new supply.
- USDe’s total circulating supply has now climbed past $12 billion, solidifying its position as the third-largest stablecoin by market capitalization.
- The monthly growth notably outpaced the $3.4 billion issuance of Tether’s market-leading USDT for the same period.
While You Were Sleeping
- Unified Crypto Lobbyists: Protect Software Developers, Senate, or We’re Out (CoinDesk): Over 110 organizations, builders and investors told U.S. senators they can’t support the Clarity Act unless software developers and non-custodial service providers are shielded from liability when bad actors misuse their technology.
- Health-Care Firm KindlyMD Plans $5B Equity Raise for Bitcoin Treasury (CoinDesk): Shares of the company, which recently merged with bitcoin treasury firm Nakamoto, slid 12% Tuesday after unveiling plans to raise up to $5 billion through an at-the-money equity sale.
- Metaplanet Shares Jump 6% on International Stock Sale, Financing Moves (CoinDesk): The Japanese firm will seek 130.3 billion yen ($880 million) from an international share sale, primarily for bitcoin purchases, while suspending warrant exercises and redeeming bonds early to bolster its balance sheet.
- Markets Need Rules — Crypto Is No Different (Financial Times): Scott Duke Kominers, a professor at Harvard Business School, says crypto markets need rules to ensure predictability, property rights, transparency and fair competition, arguing that without them innovation falters and speculation dominates.
- Putin Acts Like He Doesn’t Care About Peace. Russia’s Economy Could Depend on It (CNBC): Military spending has propped up Russia’s economy, but falling oil revenues, a swelling deficit and renewed inflation risks are fueling analyst warnings of stagnation and even recession.
- Trump Wants European Troops in Ukraine. Europe’s Voters Aren’t Convinced. (The Wall Street Journal): Public opposition reflects a desire to avoid repeating past military failures, fears of national armies getting overstretched and anxieties about being drawn into a war with Russia.
In the Ether


Uncategorized
Elon Musk vs. the regulators
Welcome back to TechCrunch Mobility, your hub for all things “future of transportation.”
Uncategorized
Nvidia’s AI empire: A look at its top startup investments
Over the last two years, Nvidia has used its ballooning fortunes to invest in over 100 AI startups. Here are the giant semiconductor’s largest investments.
Uncategorized
Dating app Cerca will show how Gen Z really dates at TechCrunch Disrupt 2025
Cerca is a dating app that sets users up with mutual friends.
-

 Business12 месяцев ago
3 Ways to make your business presentation more relatable
-

 Fashion12 месяцев ago
According to Dior Couture, this taboo fashion accessory is back
-

 Entertainment12 месяцев ago
10 Artists who retired from music and made a comeback
-

 Entertainment12 месяцев ago
\’Better Call Saul\’ has been renewed for a fourth season
-

 Entertainment12 месяцев ago
New Season 8 Walking Dead trailer flashes forward in time
-

 Business12 месяцев ago
15 Habits that could be hurting your business relationships
-

 Uncategorized4 месяца ago
Robinhood Launches Micro Bitcoin, Solana and XRP Futures Contracts
-

 Entertainment12 месяцев ago
Meet Superman\’s grandfather in new trailer for Krypton


