Uncategorized
Bitcoin, Stocks Hit By $400B Liquidity Drain From U.S. Treasury Account, Not Jackson Hole: Analysts

Move over Jackson Hole and inflation fears. The real driver behind the recent swoon in crypto and stock markets is likely the impending liquidity drain stemming from the U.S. government’s Treasury General Account (TGA), a checking account held at the Federal Reserve that is poised for a significant buildup.
Bitcoin (BTC) has declined by over 8% to $113,500 since hitting record highs above $124,000 last Thursday, according to CoinDesk data. Prices for other major tokens such as ether (ETH), XRP (XRP), and solana’s SOL (SOL) have also corrected, dragging the broader market lower. The CoinDesk 80 Index has dropped 13% since last Thursday.
The bullish momentum has also weakened on Wall Street, where the tech-heavy Nasdaq index fell by nearly 1.40% to $23,384 on Tuesday, having hit a record high of $23,969 a week ago.
Most market commentary has attributed the losses on Wall Street and in crypto markets to investor de-risking ahead of Federal Reserve (Fed) Chair Jerome Powell’s scheduled speech at this week’s Jackson Hole event. The prevailing view is that persistent inflation data may prevent Powell from meeting the market’s dovish expectations.
However, David Duong argues that the primary driver of the sell-off is the fear of a liquidity drain from the expected TGA refill.
«Jackson Hole and PPI are just excuses for market players to trim risk ahead of the U.S. Treasury’s TGA liquidity drain (~$400B) in the weeks ahead. This explains why bitcoin has lost trend alongside many equity names. But we think the path forward looks clearer in September,» David Duong, head of institutional research at Coinbase, said on X.
What is the Treasury General Account?
The Treasury General Account is the U.S. government’s operating account at the Federal Reserve, which is used to collect taxes, customs duties, proceeds from the sale of securities, and public debt receipts, while facilitating government payments.
Just as our savings bank accounts, the TGA balance fluctuates daily, rising with receipts and falling with payments.
The Treasury typically spends the cash balance during periods of fiscal uncertainty, such as the evergreen debt ceiling saga, to ensure the government meets its obligations. The so-called TGA spend typically adds to liquidity in the system, greasing risk assets, as seen in early 2023 and early this year.
The opposite occurs when the Treasury seeks to rebuild its balance by issuing more debt than necessary to fund its obligations. This tends to suck out liquidity from the system.
The TGA refill is happening under fragile conditions
The TGA balance has risen from roughly $320 billion to over $500 billion since late July, according to data source MacroMicro. Seeking Alpha estimates that the Treasury may need to issue new debt worth $500-$600 billion in the next two to four months to restore the TGA to healthy levels.
The rebuild is happening against the backdrop of fragile conditions than in previous years, according to Delphi Digital.
«Compared to 2023, the financial system now faces fewer liquidity buffers, tighter balance sheet capacity, and a diminished foreign bid for Treasuries. The structural ability to absorb large-scale issuance has weakened across all major channels. If the Federal Reserve maintains its tightening stance or delays a pivot, the resulting mismatch between supply and available demand could drive up funding rates and spill over into broader risk assets, including crypto,» Marcus Wu, research analyst at Delphi Digital, said in an explainer.
Wu added that the last large-scale rebuild, which happened in the second half of 2024, was compensated by other pro-liquidity developments such as the $2 trillion in the Fed’s RRP facility, healthy bank reserves and strong foreign demand for the debt.
However, these factors have eroded over time, «leaving the current liquidity environment ripe for disruption,» Wu noted.
To cut a long story short, liquidity constraints pose a significant challenge for BTC bulls looking to engineer a steep uptrend well into the year-end.
Read more: Cardano, Dogecoin Lead Crypto Losses as Bitcoin Traders Fear Pullback to $100K
Strategy (MSTR), the world’s largest corporate owner of bitcoin (BTC), appeared to miss out on capitalizing on last week’s market rout to purchase the dip in prices.
According to Monday’s press release, the firm bought 220 BTC at an average price of $123,561. The company used the proceeds of selling its various preferred stocks (STRF, STRK, STRD), raising $27.3 million.
That purchase price was well above the prices the largest crypto changed hands in the second half of the week. Bitcoin nosedived from above $123,000 on Thursday to as low as $103,000 on late Friday during one, if not the worst crypto flash crash on record, liquidating over $19 billion in leveraged positions.
That move occurred as Trump said to impose a 100% increase in tariffs against Chinese goods as a retaliation for tightening rare earth metal exports, reigniting fears of a trade war between the two world powers.
At its lowest point on Friday, BTC traded nearly 16% lower than the average of Strategy’s recent purchase price. Even during the swift rebound over the weekend, the firm could have bought tokens between $110,000 and $115,000, at a 7%-10% discount compared to what it paid for.
With the latest purchase, the firm brought its total holdings to 640,250 BTC, at an average acquisition price of $73,000 since starting its bitcoin treasury plan in 2020.
MSTR, the firm’s common stock, was up 2.5% on Monday.
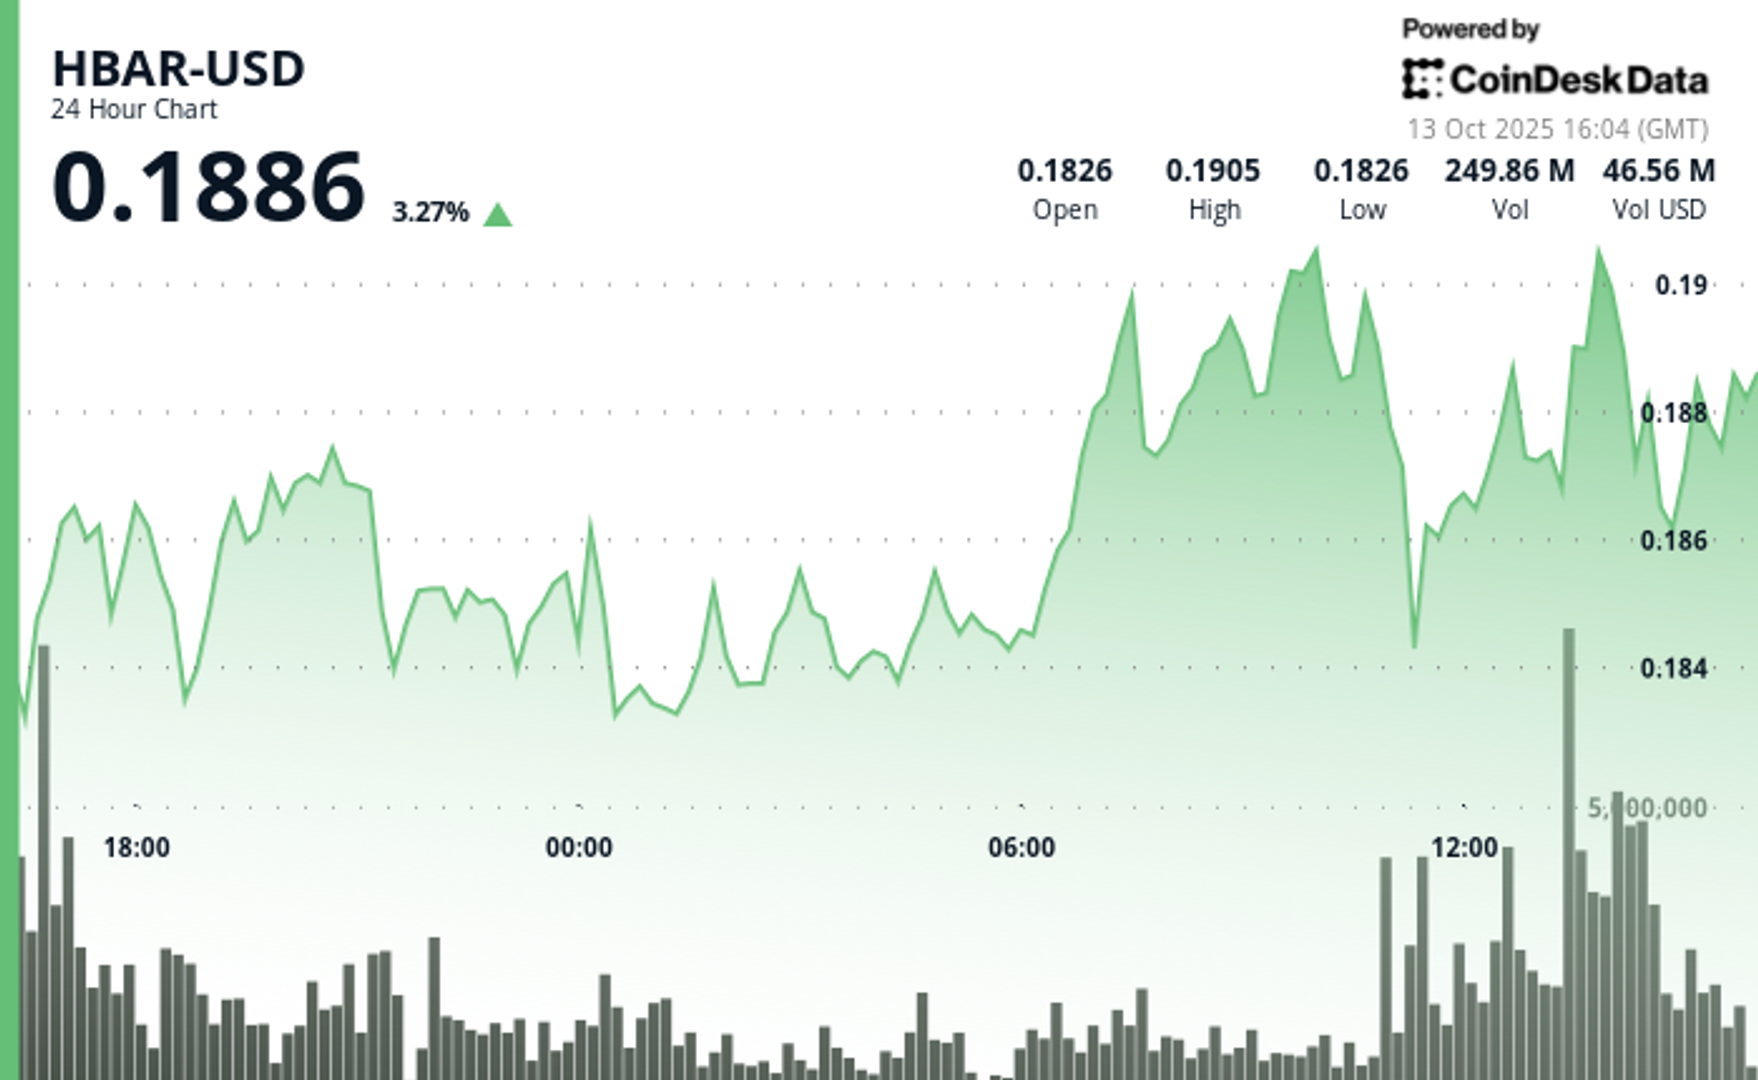
HBAR (Hedera Hashgraph) experienced pronounced volatility in the final hour of trading on Oct. 13, soaring from $0.187 to a peak of $0.191—a 2.14% intraday gain—before consolidating around $0.190.
The move was driven by a dramatic surge in trading activity, with a standout 15.65 million tokens exchanged at 13:31, signaling strong institutional participation. This decisive volume breakout propelled the asset beyond its prior resistance range of $0.190–$0.191, establishing a new technical footing amid bullish momentum.
The surge capped a broader 23-hour rally from Oct. 12 to 13, during which HBAR advanced roughly 9% within a $0.17–$0.19 bandwidth. This sustained upward trajectory was characterized by consistent volume inflows and a firm recovery from earlier lows near $0.17, underscoring robust market conviction. The asset’s ability to preserve support above $0.18 throughout the period reinforced confidence among traders eyeing continued bullish action.
Strong institutional engagement was evident as consecutive high-volume intervals extended through the breakout window, suggesting renewed accumulation and positioning for potential continuation. HBAR’s price structure now shows resilient support around $0.189–$0.190, signaling the possibility of further upside if momentum persists and broader market conditions remain favorable.
")
Technical Indicators Highlight Bullish Sentiment
- HBAR operated within a $0.017 bandwidth (9%) spanning $0.174 and $0.191 throughout the previous 23-hour period from 12 October 15:00 to 13 October 14:00.
- Substantial volume surges reaching 179.54 million and 182.77 million during 11:00 and 13:00 sessions on 13 October validated positive market sentiment.
- Critical resistance materialized at $0.190-$0.191 thresholds where price movements encountered persistent selling activity.
- The $0.183-$0.184 territory established dependable support through volume-supported bounces.
- Extraordinary volume explosion at 13:31 registering 15.65 million units signaled decisive breakout event.
- High-volume intervals surpassing 10 million units through 13:35 substantiated significant institutional engagement.
- Asset preserved support above $0.189 despite moderate profit-taking activity.
Disclaimer: Parts of this article were generated with the assistance from AI tools and reviewed by our editorial team to ensure accuracy and adherence to our standards. For more information, see CoinDesk’s full AI Policy.

The crypto market staged a recovery on Monday following the weekend’s $500 billion bloodbath that resulted in a $10 billion drop in open interest.
Bitcoin (BTC) rose by 1.4% while ether (ETH) outperformed with a 2.5% gain. Synthetix (SNX, meanwhile, stole the show with a 120% rally as traders anticipate «perpetual wars» between the decentralized trading venue and HyperLiquid.
Plasma (XPL) and aster (ASTER) both failed to benefit from Monday’s recovery, losing 4.2% and 2.5% respectively.
Derivatives Positioning
- The BTC futures market has stabilized after a volatile period. Open interest, which had dropped from $33 billion to $23 billion over the weekend, has now settled at around $26 billion. Similarly, the 3-month annualized basis has rebounded to the 6-7% range, after dipping to 4-5% over the weekend, indicating that the bullish sentiment has largely returned. However, funding rates remain a key area of divergence; while Bybit and Hyperliquid have settled around 10%, Binance’s rate is negative.
- The BTC options market is showing a renewed bullish lean. The 24-hour Put/Call Volume has shifted to be more in favor of calls, now at over 56%. Additionally, the 1-week 25 Delta Skew has risen to 2.5% after a period of flatness.
- These metrics indicate a market with increasing demand for bullish exposure and upside protection, reflecting a shift away from the recent «cautious neutrality.»
- Coinglass data shows $620 million in 24 hour liquidations, with a 34-66 split between longs and shorts. ETH ($218 million), BTC ($124 million) and SOL ($43 million) were the leaders in terms of notional liquidations. Binance liquidation heatmap indicates $116,620 as a core liquidation level to monitor, in case of a price rise.
Token Talk
By Oliver Knight
- The crypto market kicked off Monday with a rebound in the wake of a sharp weekend leverage flush. According to data from CoinMarketCap, the total crypto market cap climbed roughly 5.7% in the past 24 hours, with volume jumping about 26.8%, suggesting those liquidated at the weekend are repurchasing their positions.
- A total of $19 billion worth of derivatives positions were wiped out over the weekend with the vast majority being attributed to those holding long positions, in the past 24 hours, however, $626 billion was liquidated with $420 billion of that being on the short side, demonstrating a reversal in sentiment, according to CoinGlass.
- The recovery has been tentative so far; the dominance of Bitcoin remains elevated at about 58.45%, down modestly from recent highs, which implies altcoins may still lag as capital piles back into safer large-cap names.
- The big winner of Monday’s recovery was synthetix (SNX), which rose by more than 120% ahead of a crypto trading competition that will see it potentially start up «perpetual wars» with HyperLiquid.


Strategy Bought $27M in Bitcoin at $123K Before Crypto Crash

HBAR Rises Past Key Resistance After Explosive Decline

Crypto Markets Today: Bitcoin and Altcoins Recover After $500B Crash
-

 Business12 месяцев ago
3 Ways to make your business presentation more relatable
-
Fashion12 месяцев ago
According to Dior Couture, this taboo fashion accessory is back
-
Entertainment12 месяцев ago
10 Artists who retired from music and made a comeback
-
Entertainment12 месяцев ago
\’Better Call Saul\’ has been renewed for a fourth season
-
Entertainment12 месяцев ago
New Season 8 Walking Dead trailer flashes forward in time
-

 Uncategorized4 месяца ago
Robinhood Launches Micro Bitcoin, Solana and XRP Futures Contracts
-
Business12 месяцев ago
15 Habits that could be hurting your business relationships
-
Entertainment12 месяцев ago
Meet Superman\’s grandfather in new trailer for Krypton