Uncategorized
Bitcoin Runs Into Resistance Cluster Above $88K. What Next?

This is a daily technical analysis by CoinDesk analyst and Chartered Market Technician Omkar Godbole.
Bitcoin’s (BTC) bullish advance has encountered a resistance zone above $88,000, marked by crucial levels that could make or break the ongoing recovery rally.
The resistance cluster’s first and perhaps most critical level is the 200-day simple moving average (SMA) at $88,356. The SMA is widely regarded as a key indicator of long-term momentum. Early this month, Coinbase institutional analysts called the downside break of the 200-day SMA in March a sign of the onset of a potential crypto winter.
So, a fresh move above the 200-day SMA could be taken to represent a renewed bullish shift in momentum.
Such a move would trigger a dual breakout, as the Ichimoku cloud’s upper end is located close to the 200-day SMA. A move above the Ichimoku cloud is also said to reflect a bullish shift in momentum.
Developed by a Japanese journalist in the 1960s, the Ichimoku cloud is a technical analysis indicator that offers a comprehensive view of market momentum, support, and resistance levels. The indicator comprises five lines: Leading Span A, Leading Span B, Conversion Line or Tenkan-Sen (T), Base Line or Kijun-Sen (K) and a lagging closing price line. The difference between Leading Span A and B forms the Ichimoku Cloud.
The third and final level forming the resistance cluster is the high of $88,804 on March 24, from where the market turned lower and fell back to $75,000.
")
A make-or-break resistance zone?
Behavioural aspects of trading come into play when an asset approaches a resistance zone, especially at key levels like the 200-day SMA and the Ichimoku cloud.
Prospect theory suggests that people are typically risk-averse with respect to gains and risk-seeking with respect to losses, known as the “reflection effect.» So, as traders, people tend to be risk-averse while locking in profits and keep losing trades open.
This tendency is amplified when an asset encounters a significant resistance zone. Traders who entered the bitcoin market around $75K, anticipating a rebound, may feel pressured to take profits as the price approaches this resistance. Such selling could, in turn, slow the price ascent or even trigger a new downturn.
Conversely, if bitcoin successfully breaks through the resistance zone, the fear of missing out could prompt more traders to make bullish bets, further fueling bullish momentum and pushing the price higher.
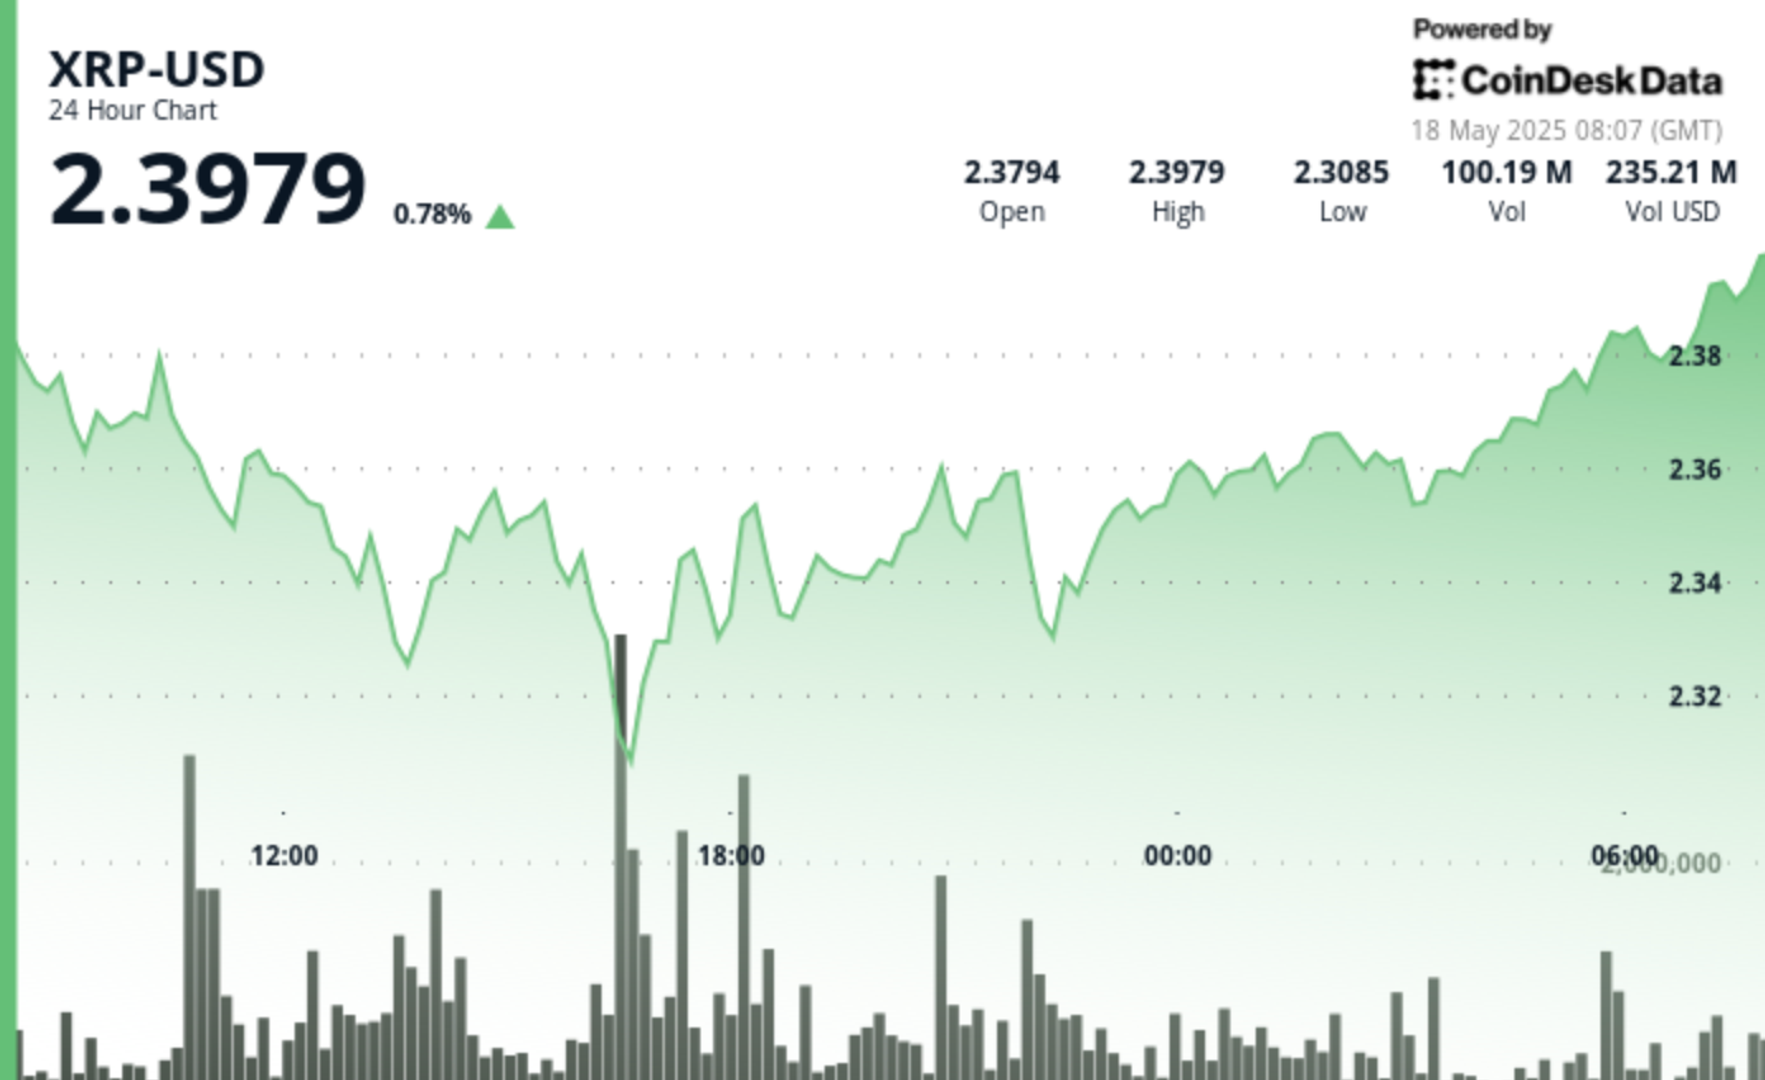
Global economic tensions and regulatory developments continue to influence XRP’s price action, with the digital asset showing remarkable resilience despite recent volatility.
After experiencing a significant dip to $2.307 on high volume, XRP has established an upward trajectory with a series of higher lows, suggesting continued momentum as it approaches resistance levels.
Technical indicators point to a potential bullish breakout, with multiple analysts highlighting critical support at $2.35-$2.40 that must hold for upward continuation.
Technical Analysis Highlights
- Price experienced a 3.76% range ($2.307-$2.396) over 24 hours with a sharp sell-off at 16:00 dropping to $2.307 on high volume (77.9M).
- Strong support emerged at $2.32 level with buyers stepping in during high-volume periods, particularly during the 13:00-14:00 recovery.
- Asset established upward trajectory, forming higher lows from the bottom, with resistance around $2.39 tested during 07:00 session.
- In the last hour, XRP climbed from $2.358 to $2.368, representing a 0.42% gain with notable volume spikes at 01:52 and 01:55.
- Price surged past resistance at $2.36 to reach $2.366, later establishing new local highs at $2.369 during 02:03 session on substantial volume (539,987).
- Currently maintaining strength above $2.368 support level with decreasing volatility suggesting potential continuation of upward trajectory.
Disclaimer: This article was generated with AI tools and reviewed by our editorial team to ensure accuracy and adherence to our standards. For more information, see CoinDesk’s full AI Policy. This article may include information from external sources, which are listed below when applicable.
External References
- «XRP price path to $3.40 remains intact — Here is why«, Cointelegraph, published May 16, 2025.
- «XRP Price Watch: Bulls Eye $2.60 as Long-Term Trend Holds«, Bitcoin.com News, published May 17, 2025.
- «XRP Price Explosion To $5.9: Current Consolidation Won’t Stop XRP From Growing«, NewsBTC, published May 17, 2025.
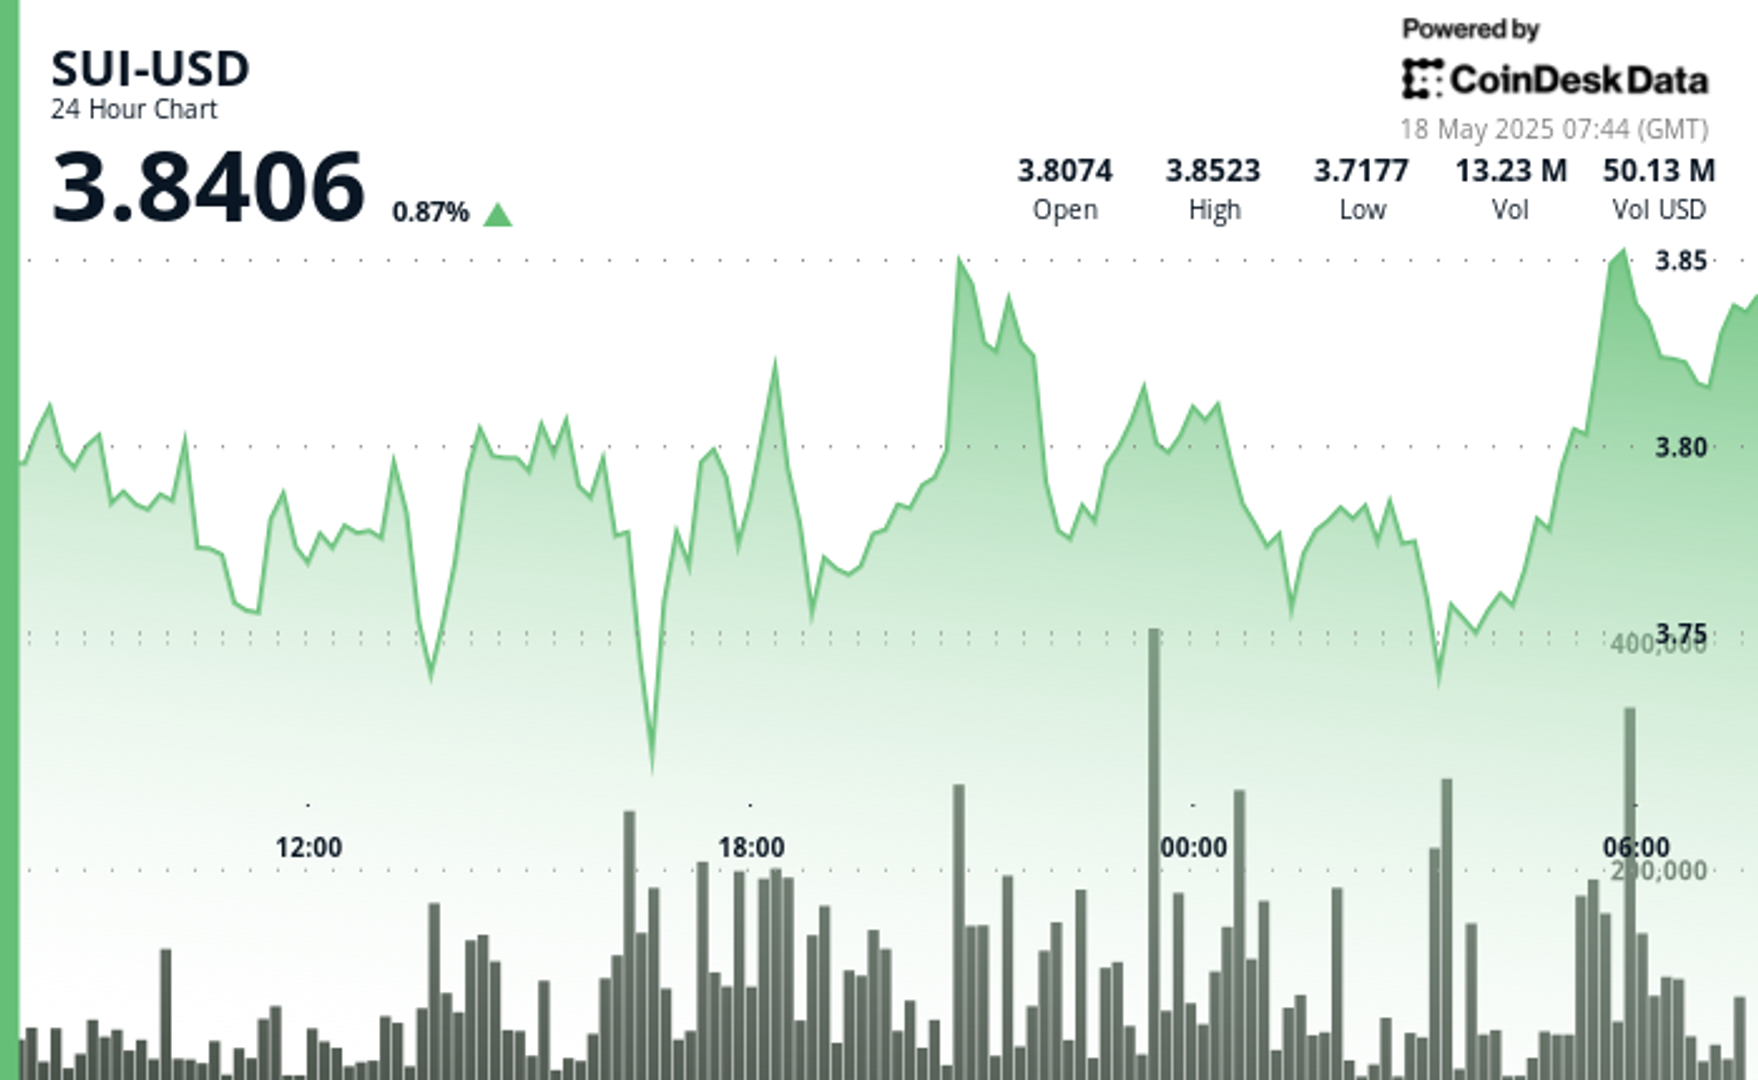
Global economic tensions and shifting trade policies continue to influence cryptocurrency markets, with SUI showing particular resilience.
The asset established a trading range of 4.46% between $3.70 and $3.86, finding strong volume support at the $3.755 level.
A notable bullish momentum emerged with price surging 1.9% on above-average volume, establishing resistance at $3.850.
The formation of higher lows throughout the latter part of the day suggests consolidation above the $3.775 support level.
Technical Analysis Highlights
- SUI established a 24-hour trading range of 0.165 (4.46%) between the low of 3.700 and high of 3.862.
- Strong volume support emerged at the 3.755 level during hours 17-18, with accumulation exceeding the 24-hour volume average by 45%.
- Notable bullish momentum occurred in the 20:00 hour with price surging 7.2 cents (1.9%) on above-average volume.
- Resistance established at 3.850 with higher lows forming throughout the latter part of the day.
- Decreasing volatility in the final hours suggests consolidation above the 3.775 support level.
- Significant buyer interest appeared between 01:27-01:30, forming a strong support zone at 3.756-3.760 with exceptionally high volume (over 300,000 units per minute).
- Decisive bullish reversal began at 01:42, establishing a series of higher lows and higher highs.
- Breakout above 3.780 occurred at 01:55, followed by consolidation near 3.785 with decreasing volume.
Disclaimer: This article was generated with AI tools and reviewed by our editorial team to ensure accuracy and adherence to our standards. For more information, see CoinDesk’s full AI Policy. This article may include information from external sources, which are listed below when applicable.
External References
- «Sui price up 5.16% intra-day: bullish structure remains strong«, crypto.news, published May 16, 2205.
- «SUI Set to Explode, But Don’t Sleep on XRP and Other Altcoins«, CoinPedia, May 16, 2025.
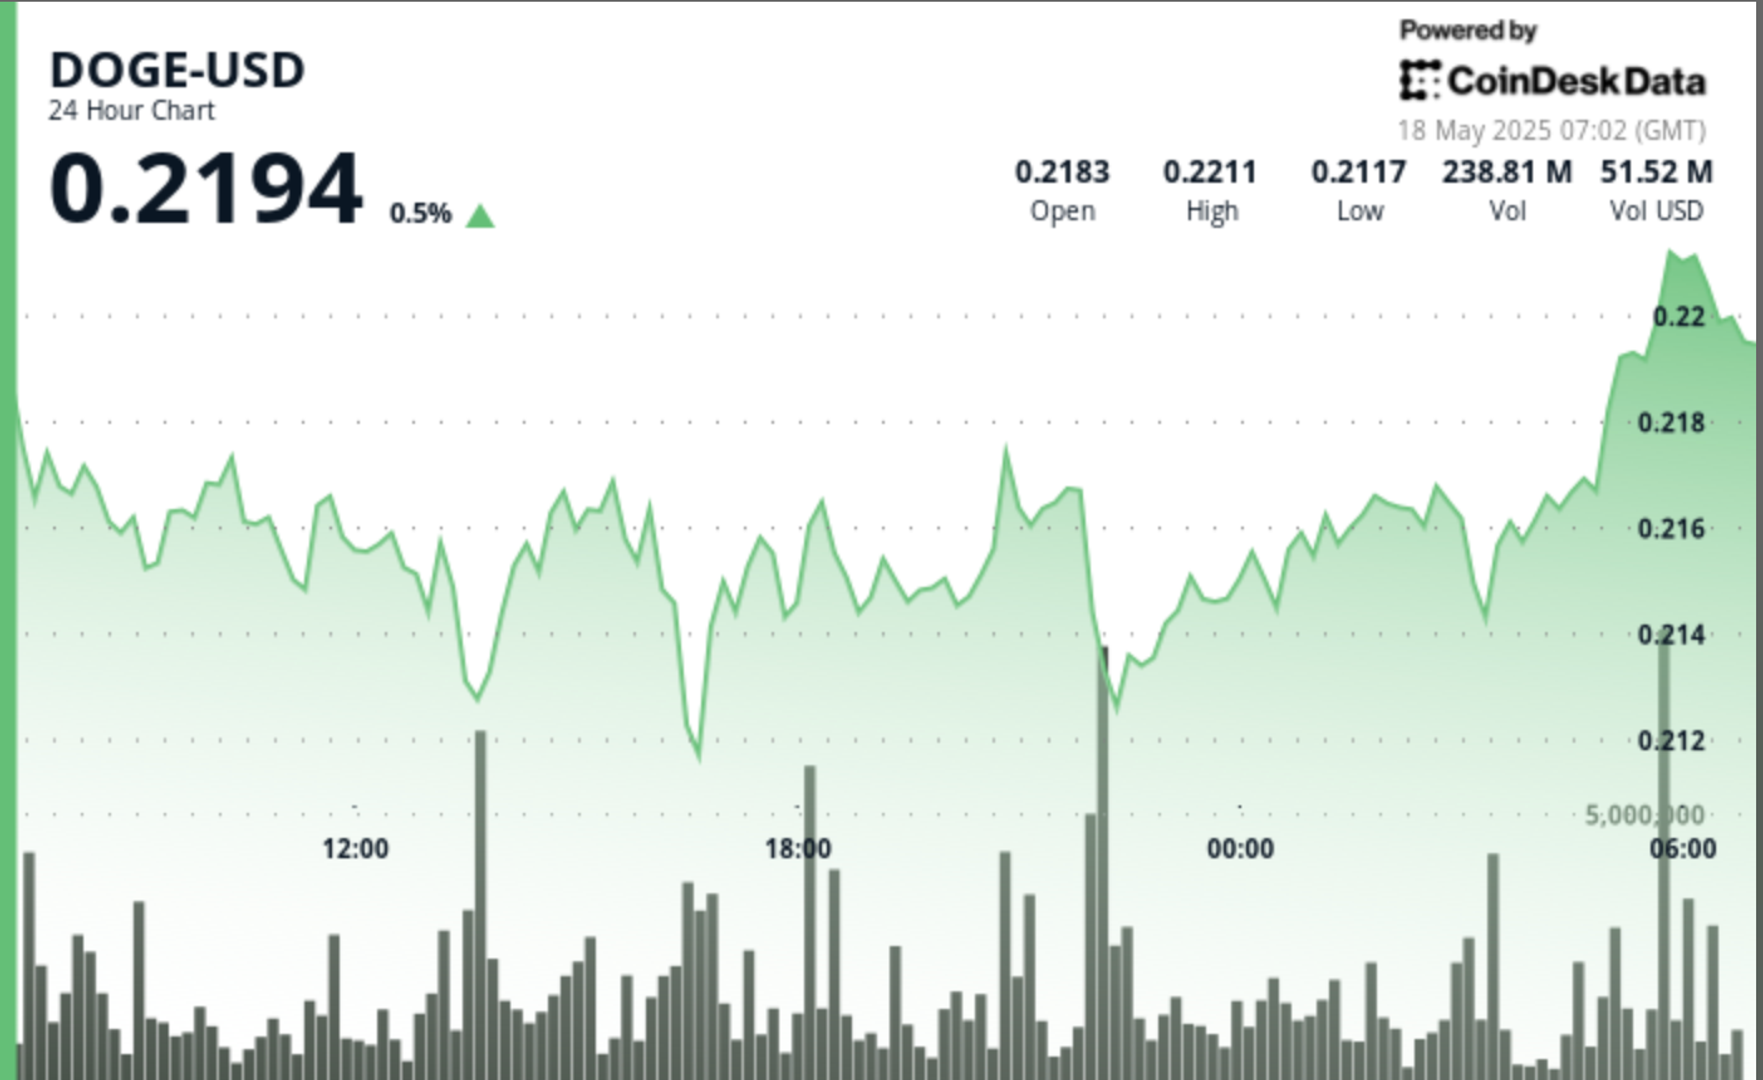
Geopolitical tensions and evolving trade policies continue to influence cryptocurrency markets, with Dogecoin showing resilience amid broader economic uncertainty.
Despite macroeconomic headwinds, DOGE has maintained support above key moving averages while forming a potential bull flag pattern that could target $0.35 if validated by continued buying pressure.
Technical Analysis Highlights
- DOGE experienced significant volatility with a 4.3% range (0.211-0.220) over the past 24 hours, forming a key support zone around 0.212 validated by high volume rebounds at 13:00 and 22:00.
- The price action reveals a bullish recovery pattern from the 16:00 low, with resistance emerging at 0.217-0.220.
- The 20:00 candle’s strong volume surge above the 24-hour average confirms renewed buying interest, suggesting potential upward momentum if DOGE can maintain its position above the established support level.
- In the past hour, DOGE has demonstrated significant bullish momentum, climbing from 0.215 to 0.216 with notable volume spikes at 01:17, 01:21, and 01:54-01:55.
- The price established a strong support zone around 0.215 during the early minutes, followed by a decisive breakout at 01:16-01:17 where volume surged over 8 million.
- The uptrend continued with higher lows forming a clear ascending pattern, culminating in a new resistance test at 0.216-0.217 range.
- The final minutes saw particularly heavy trading activity with volumes exceeding 7 million at 02:01-02:02, confirming strong buyer interest and suggesting potential for further upside movement.
Disclaimer: This article was generated with AI tools and reviewed by our editorial team to ensure accuracy and adherence to our standards. For more information, see CoinDesk’s full AI Policy. This article may include information from external sources, which are listed below when applicable.
External References
- «Dogecoin Eyes $0.35 as Whale Accumulation Signals Bull Flag Breakout«, The Crypto Basic, published May 16, 2025.
- «Dogecoin Hovers at $0.22 Following Weeks of Gains, Analysts Share Mixed Outlooks«, NewsBTC, published May 17, 2025.


XRP Price Surges After V-Shaped Recovery, Targets $3.40

SUI Surges After Finding Strong Support at $3.75 Level

Dogecoin (DOGE) Whales Accumulate 1 Billion DOGE Amid Critical Support Formation
-

 Fashion7 месяцев ago
These \’90s fashion trends are making a comeback in 2017
-
Entertainment7 месяцев ago
The final 6 \’Game of Thrones\’ episodes might feel like a full season
-
Fashion7 месяцев ago
According to Dior Couture, this taboo fashion accessory is back
-
Entertainment7 месяцев ago
The old and New Edition cast comes together to perform
-
Business7 месяцев ago
Uber and Lyft are finally available in all of New York State
-
Sports7 месяцев ago
Phillies\’ Aaron Altherr makes mind-boggling barehanded play
-
Entertainment7 месяцев ago
Disney\’s live-action Aladdin finally finds its stars
-
Sports7 месяцев ago
Steph Curry finally got the contract he deserves from the Warriors