Uncategorized
Bitcoin Price Support Near $82K Under Threat as Nasdaq Triggers ‘Double Top’

Research service Ecoinometrics stated on Monday that bitcoin’s (BTC) long-term recovery is closely tied to the Nasdaq’s ability to trend upward, highlighting the significant positive correlation between the two.
Unfortunately for crypto bulls, the Nasdaq triggered a major bearish reversal pattern known as a «double top» on Monday, putting BTC’s 200-day simple moving average (SMA) support at risk.
Bitcoin, the leading cryptocurrency by market value, has dropped over 10% in the past 24 hours, reversing Sunday’s price rally to $95,000. At one point early today, prices tested the 200-day SMA support at $82,587, as shown by data from the charting platform TradingView.
The 200-day SMA is commonly regarded as a key indicator of long-term trends, with price declines below this level often interpreted as a signal of potential significant losses ahead.
The possibility of BTC’s price moving below the long-term average cannot be ruled out, as Wall Street’s tech-heavy Nasdaq fell 2.2% Monday, triggering a double top breakdown.
The double top comprises two peaks separated by a trough and takes roughly two to six weeks to form. The gap between the two peaks must be equal to or less than 5%, with the spread between peaks and the trough being at least 10%, according to technical analysis theory.
These are guidelines and not rules; the backdrop is more important, meaning the pattern should appear after a prolonged uptrend to be valid, which is the case with Nasdaq.
Nasdaq has formed two peaks near $22,200 since mid-December, with a trough at $20,538. The index ended Tuesday below the trough support, confirming the double-top bearish reversal pattern.
Per technical analysis theory, the subsequent decline could be at least 70% of the distance between the peaks and the trough, which means the Nasdaq could go as low as 19,400. The pattern’s historical failure rate is 11%, according to CMT’s analysis books. This means that breakdowns lead to deeper losses more often than not.
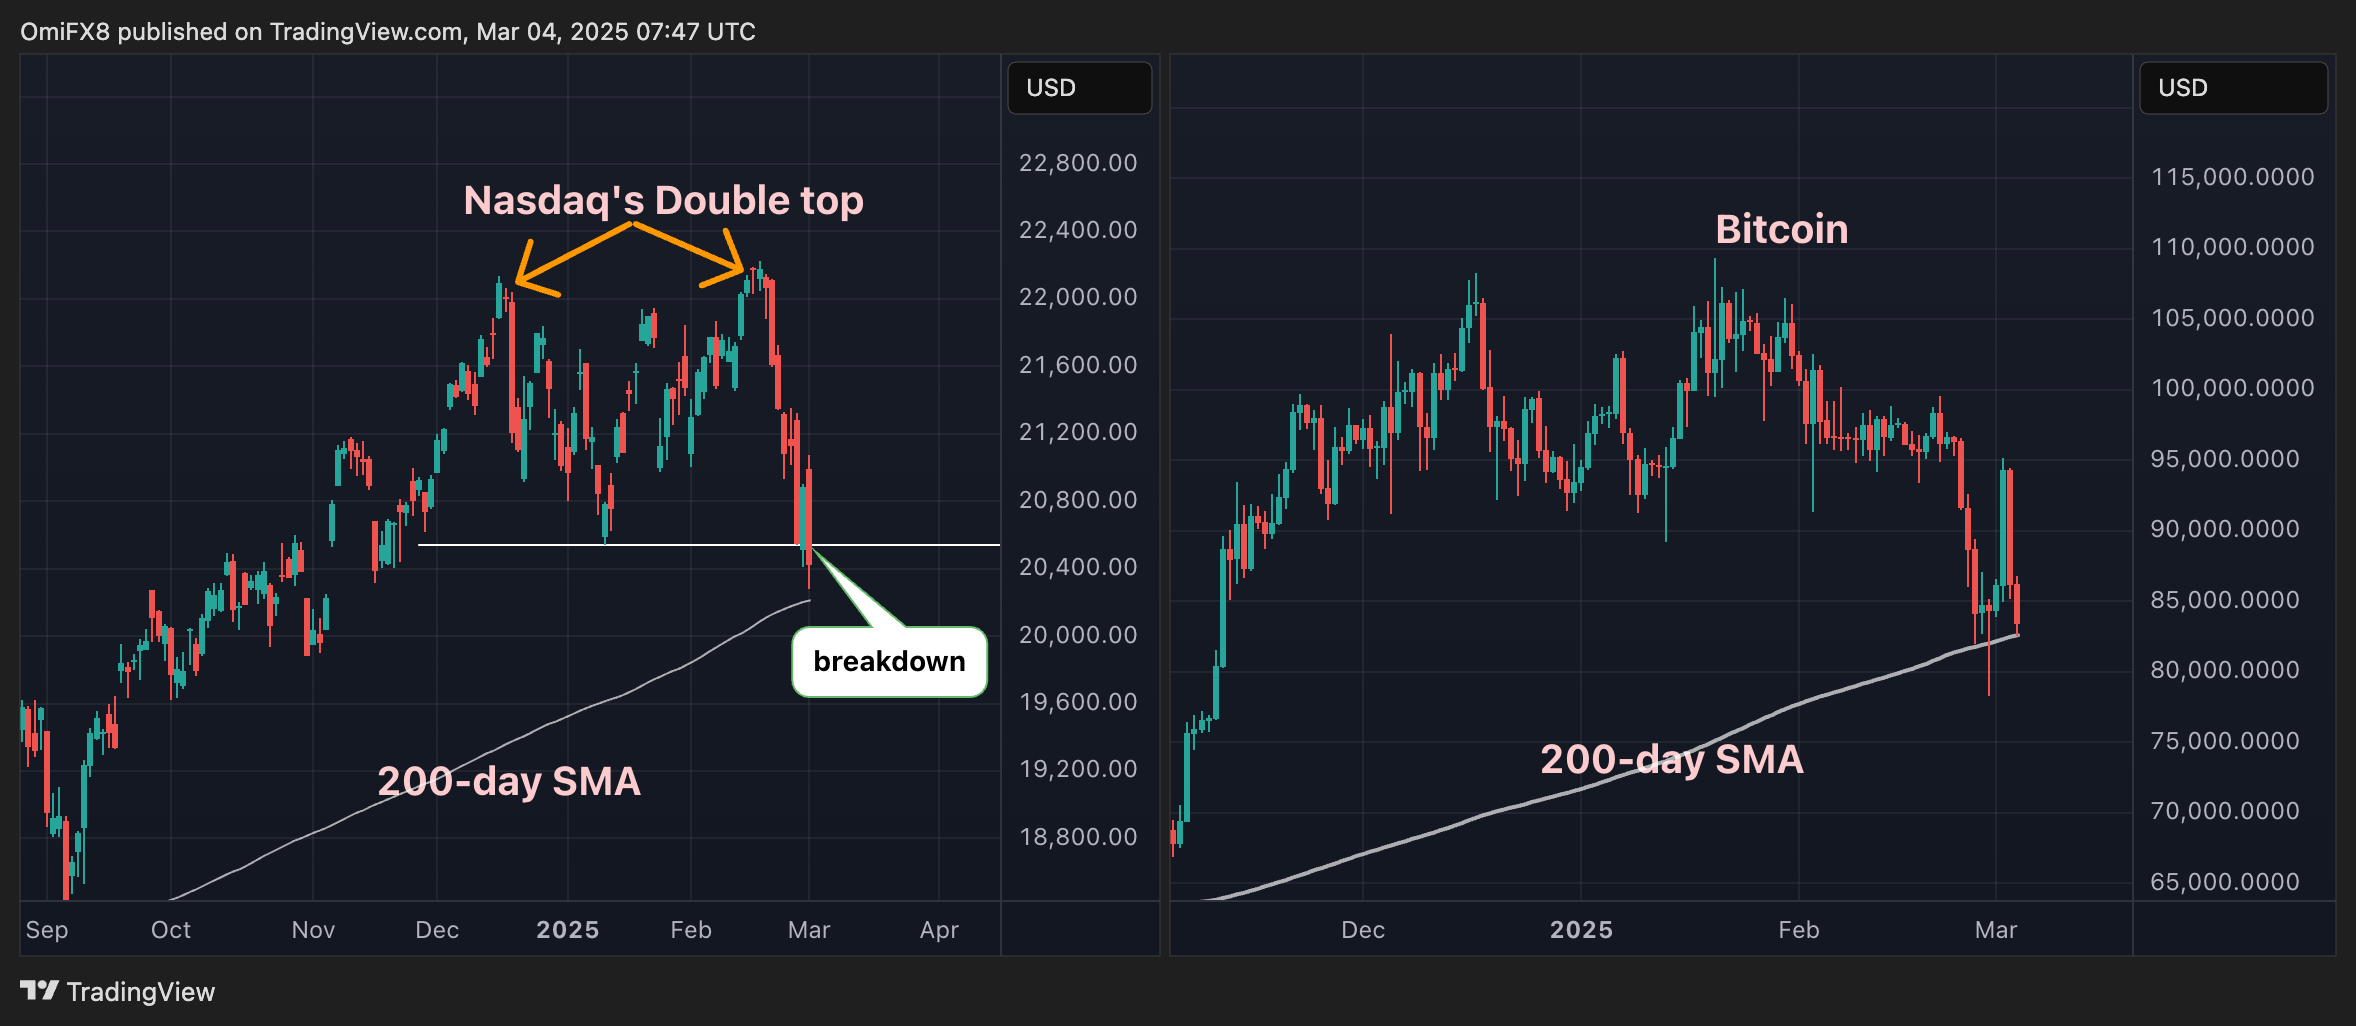
Both Nasdaq and BTC lost bullish momentum in December and have since topped out to trade close to their respective 200-day averages.
Below the 200-day SMA, the next support for bitcoin is seen directly at the former record high (resistance)-turned-support at $73,757.
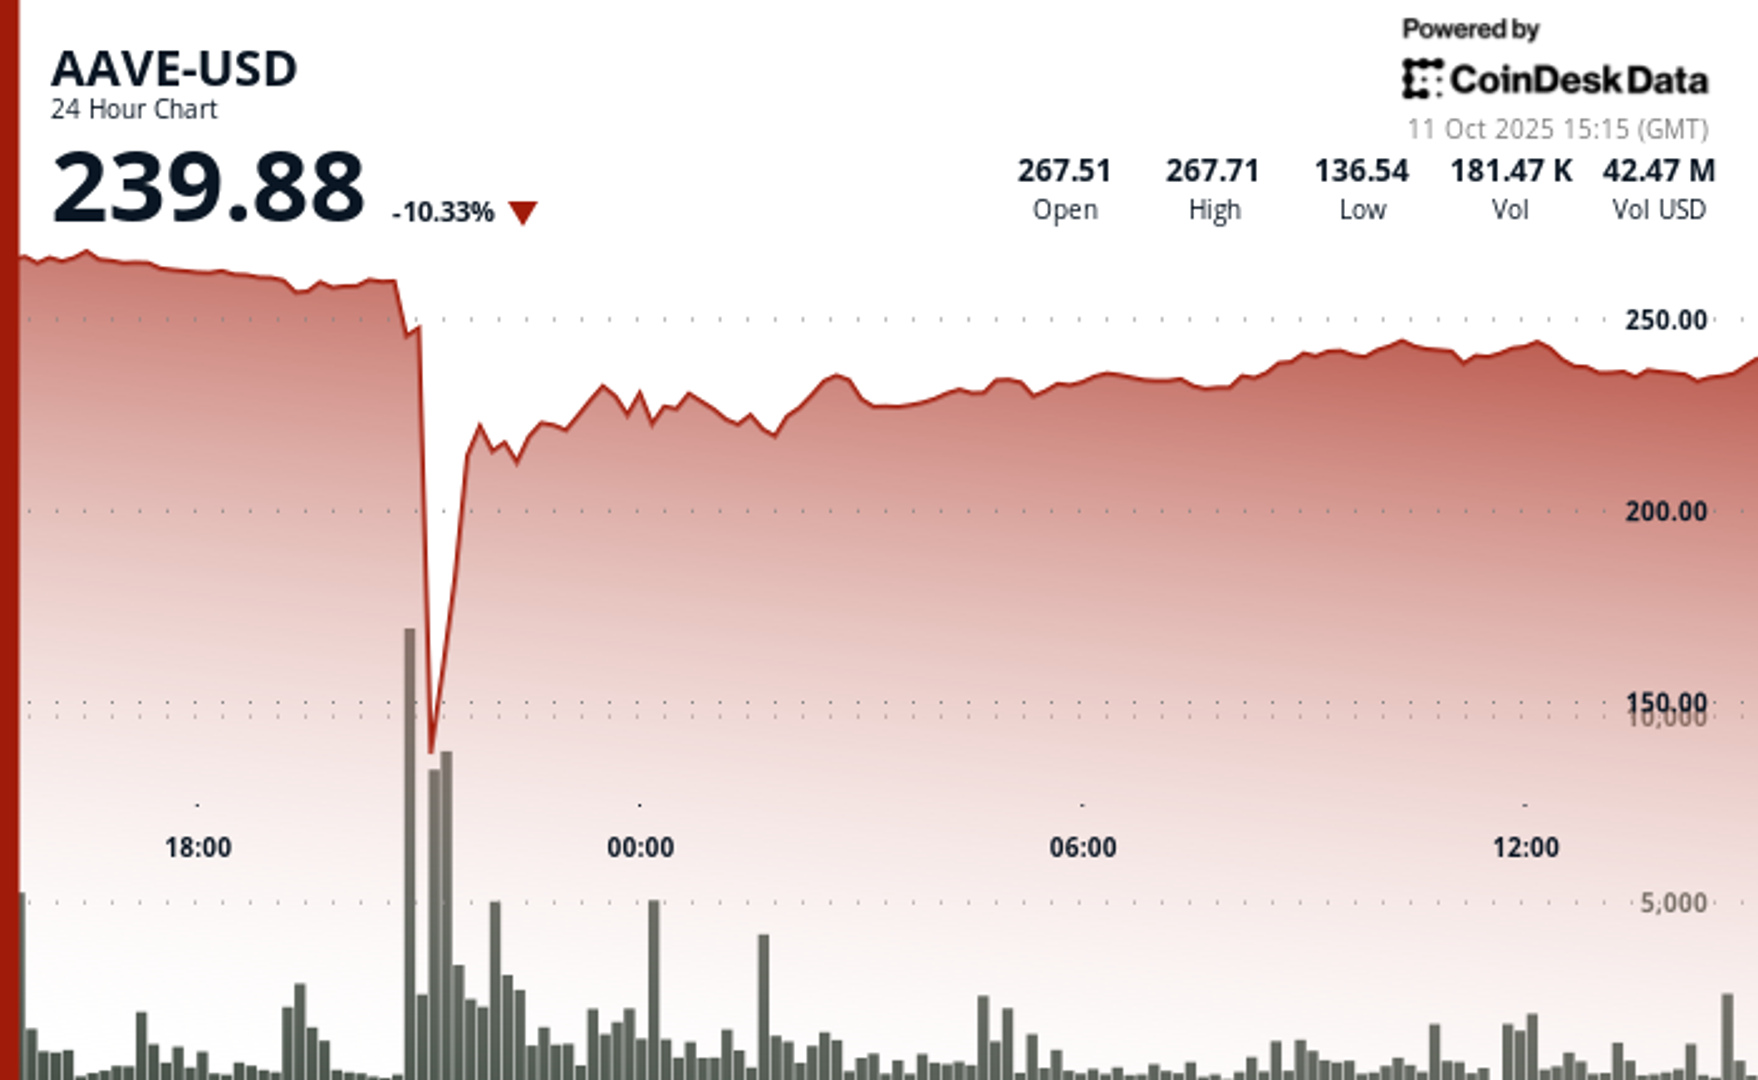
The native token of Aave (AAVE), the largest decentralized crypto lending protocol, was caught in the middle of Friday’s crypto flash crash while the protocol proved resilient in a historic liquidation cascade.
The token, trading at around $270 earlier in Friday, nosedived as much as 64% later in the session to touch $100, the lowest level in 14 months. It then staged a rapid rebound to near $240, still down 10% over the past 24 hours.
Stani Kulechov, founder of Aave, described Friday’s event as the «largest stress test» ever for the protocol and its $75 billion lending infrastructure.
The platform enables investors to lend and borrow digital assets without conventional intermediaries, using innovative mechanisms such as flash loans. Despite the extreme volatility, Aave’s performance underscores the evolving maturity and resilience of DeFi markets.
«The protocol operated flawlessly, automatically liquidating a record $180M worth of collateral in just one hour, without any human intervention,» Kulechov said in a Friday X post. «Once again, Aave has proven its resilience.»
Key price action:
- AAVE sustained a dramatic flash crash on Friday, declining 64% from $278.27 to $100.18 before recuperating to $240.09.
- The DeFi protocol demonstrated remarkable resilience with its native token’s 140% recovery from the intraday lows, underpinned by substantial trading volume of 570,838 units.
- Following the volatility, AAVE entered consolidation territory within a narrow $237.71-$242.80 range as markets digested the dramatic price action.
Technical Indicators Summary
- Price range of $179.12 representing 64% volatility during the 24-hour period.
- Volume surged to 570,838 units, substantially exceeding the 175,000 average.
- Near-term resistance identified at $242.80 capping rebound during consolidation phase.
Disclaimer: Parts of this article were generated with the assistance from AI tools and reviewed by our editorial team to ensure accuracy and adherence to our standards. For more information, see CoinDesk’s full AI Policy.
AI agents, software systems that use AI to pursue goals and complete tasks on behalf of users, are proliferating. Think of them as digital assistants that can make decisions and take actions towards goals you set without needing step-by-step instructions — from GPT-powered calendar managers to trading bots, the number of use cases is expanding rapidly. As their role expands across the economy, we have to build the right infrastructure that will allow these agents to communicate, collaborate and trade with one another in an open marketplace.
Big tech players like Google and AWS are building early marketplaces and commerce protocols, but that raises the question: will they aim to extract massive rents through walled gardens once more? Agents’ capabilities are clearly rising, almost daily, with the arrival of new models and architectures. What’s at risk is whether these agents will be truly autonomous.
Autonomous agents are valuable because they unlock a novel user experience: a shift from software as passive or reactive tools to active and even proactive partners. Instead of waiting for instructions, they can anticipate needs, adapt to changing conditions, and coordinate with other systems in real time, without the user’s constant input or presence. This autonomy in decision-making makes them uniquely suited for a world where speed and complexity outpace human decision-making.
Naturally, some worry about what greater decision-making autonomy means for work and accountability — but I see it as an opportunity. When agents handle repetitive, time-intensive tasks and parallelize what previously had to be done in sequence, they expand our productive capacity as humans — freeing people to engage in work that demands creativity, judgment, composition and meaningful connection. This isn’t make-believe, humanity has been there before: the arrival of corporations allowed entrepreneurs to create entirely new products and levels of wealth previously unthought of. AI agents have the potential to bring that capability to everyone.
On the intelligence side, truly autonomous decision-making requires AI agent infrastructure that is open source and transparent. OpenAI’s recent OSS release is a good step. Chinese labs, such as DeepSeek (DeepSeek), Moonshot AI (Kimi K2) and Alibaba (Qwen 3), have moved even quicker.
However, autonomy is not purely tied to intelligence and decision making. Without resources, an AI agent has little means to enact change in the real world. Hence, for agents to be truly autonomous they need to have access to resources and self-custody their assets. Programmable, permissionless, and composable blockchains are the ideal substrate for agents to do so.
Picture two scenarios. One where AI agents operate within a Web 2 platform like AWS or Google. They exist within the limited parameters set by these platforms in what is essentially a closed and permissioned environment. Now imagine a decentralized marketplace that spans many blockchain ecosystems. Developers can compose different sets of environments and parameters, therefore, the scope available to AI agents to operate is unlimited, accessible globally, and can evolve over time. One scenario looks like a toy idea of a marketplace, and the other is an actual global economy.
In other words, to truly scale not just AI agent adoption, but agent-to-agent commerce, we need rails that only blockchains can offer.
The Limits of Centralized Marketplaces
AWS recently announced an agent-to-agent marketplace aimed at addressing the growing demand for ready-made agents. But their approach inherits the same inefficiencies and limitations that have long plagued siloed systems. Agents must wait for human verification, rely on closed APIs and operate in environments where transparency is optional, if it exists at all.
To act autonomously and at scale, agents can’t be boxed into closed ecosystems that restrict functionality, pose platform risks, impose opaque fees, or make it impossible to verify what actions were taken and why.
Decentralization Scales Agent Systems
An open ecosystem allows for agents to act on behalf of users, coordinate with other agents, and operate across services without permissioned barriers.
Blockchains already offer the key tools needed. Smart contracts allow agents to perform tasks automatically, with rules embedded in code, while stablecoins and tokens enable instant, global value transfers without payment friction. Smart accounts, which are programmable blockchain wallets like Safe, allow users to restrict agents in their activity and scope (via guards). For instance, an agent may only be allowed to use whitelisted protocols. These tools allow AI agents not only to behave expansively but also to be contained within risk parameters defined by the end user. For example, this could be setting spending limits, requiring multi-signatures for approvals, or restricting agents to whitelisted protocols.
Blockchain also provides the transparency needed so users can audit agent decisions, even when they aren’t directly involved. At the same time, this doesn’t mean that all agent-to-agent interactions need to happen onchain. E.g. AI agents can use offchain APIs with access constraints defined and payments executed onchain.
In short, decentralized infrastructure gives agents the tools to operate more freely and efficiently than closed systems allow.
It’s Already Happening Onchain
While centralized players are still refining their agent strategies, blockchain is already enabling early forms of agent-to-agent interaction. Onchain agents are already exhibiting more advanced behavior like purchasing predictions and data from other agents. And as more open frameworks emerge, developers are building agents that can access services, make payments, and even subscribe to other agents — all without human involvement.
Protocols are already implementing the next step: monetization. With open marketplaces, people and businesses are able to rent agents, earn from specialized ones, and build new services that plug directly into this agent economy. Customisation of payment models such as subscription, one-off payments, or bundled packages will also be key in facilitating different user needs. This will unlock an entirely new model of economic participation.
Why This Distinction Matters
Without open systems, fragmentation breaks the promise of seamless AI support. An agent can easily bring tasks to completion if it stays within an individual ecosystem, like coordinating between different Google apps. However, where third-party platforms are necessary (across social, travel, finance, etc), an open onchain marketplace will allow agents to programmatically acquire the various services and goods they need to complete a user’s request.
Decentralized systems avoid these limitations. Users can own, modify, and deploy agents tailored to their needs without relying on vendor-controlled environments.
We’ve already seen this work in DeFi, with DeFi legos. Bots automate lending strategies, manage positions, and rebalance portfolios, sometimes better than any human could. Now, that same approach is being applied as “agent legos” across sectors including logistics, gaming, customer support, and more.
The Path Forward
The agent economy is growing fast. What we build now will shape how it functions and for whom it works. If we rely solely on centralized systems, we risk creating another generation of AI tools that feel useful but ultimately serve the platform, not the person.
Blockchain changes that. It enables systems where agents act on your behalf, earn on your ideas, and plug into a broader, open marketplace.
If we want agents that collaborate, transact, and evolve without constraint, then the future of agent-to-agent marketplaces must live onchain.

More than 1,000 wallets on Hyperliquid were completely liquidated during the recent violent crypto sell-off, which erased over $1.23 billion in trader capital on the platform, according to data from its leaderboard.
In total, 6,300 wallets are now in the red, with 205 losing over $1 million each according to the data, which was first spotted by Lookonchain. More than 1,000 accounts saw losses of at least $100,000.
The wipeout came as crypto markets reeled from a global risk-off event triggered by U.S. President Donald Trump’s announcement of a 100% additional tariff on Chinese imports.
The move spooked investors across asset classes and sent cryptocurrency prices tumbling. Bitcoin briefly dropped below $110,000 and ether fell under $3,700, while the broader market as measured by the CoinDesk 20 (CD20) index dropped by 15% at one point.
The broad sell-off led to over $19 billion in liquidations over a 24 hours period, making it the largest single-day liquidation event in crypto history by dollar value. According to CoinGlass, the “actual total” of liquidations is “likely much higher” as leading crypto exchange Binance doesn’t report as quickly as other platforms.
Leaderboard data reviewed by CoinDesk shows the top 100 traders on Hyperliquid gained $1.69 billion collectively.
In comparison, the top 100 losers dropped $743.5 million, leaving a net profit of $951 million concentrated among a handful of highly leveraged short sellers.
The biggest winner was wallet 0x5273…065f, which made over $700 million from short positions, while the largest loser, “TheWhiteWhale,” dropped $62.5 million.
Among the victims of the flush is crypto personality Jeffrey Huang, known online as Machi Big Brother, who once launched a defamation suit against ZachXBT, losing almost the entire value of his wallet, amounting to $14 million.
«Was fun while it lasted,» he posted on X.
Adding to the uncertainty, the ongoing U.S. government shutdown has delayed the release of key economic data. Without official indicators, markets are flying blind at a time when geopolitical risk is rising.


AAVE Sees 64% Flash Crash as DeFi Protocol Endures ‘Largest Stress Test’

Blockchain Will Drive the Agent-to-Agent AI Marketplace Boom

‘Largest Ever’ Crypto Liquidation Event Wipes Out 6,300 Wallets on Hyperliquid
-

 Business12 месяцев ago
3 Ways to make your business presentation more relatable
-
Fashion12 месяцев ago
According to Dior Couture, this taboo fashion accessory is back
-
Entertainment12 месяцев ago
10 Artists who retired from music and made a comeback
-
Entertainment12 месяцев ago
\’Better Call Saul\’ has been renewed for a fourth season
-
Entertainment12 месяцев ago
New Season 8 Walking Dead trailer flashes forward in time
-
Business12 месяцев ago
15 Habits that could be hurting your business relationships
-
Entertainment12 месяцев ago
Meet Superman\’s grandfather in new trailer for Krypton
-
Entertainment12 месяцев ago
Disney\’s live-action Aladdin finally finds its stars