Uncategorized
Bitcoin Pops Above $88K Amid Yen Strength; ETH, ADA, XRP See Declines

Bitcoin (BTC) held steady above $88,000 early Tuesday as the Japanese yen crossed the psychological level of 140 against the U.S. dollar, as tariff concerns and risks of a Federal Reserve chairman shuffle in the states broadened the appeal of safe-haven assets.
Yen rose nearly 1% to 139.93 against the dollar, its strongest level since September. Gold surged to fresh highs at $3,494 per ounce in Asian morning hours.
Per reports, Trump is blaming the Fed for the economic fallout from the trade war if the central bank doesn’t cut rates soon — and firing the chief usurps the appearance of independence the Federal Reserve currently enjoys.
BTC added just over 1% to continue a steady rise since Sunday. Ether (ETH), Cardano’s ADA, XRP, and Solana’s SOL showed signs of profit-taking with declines of as much as 3%, CoinGecko data shows.
Kaspa’s KAS and Polygon’s POL rose as much as 9% to lead gains among mid-caps, albeit on no immediate catalysts.
Traders pointed out that gains in bitcoin amid global ongoings were cementing its place as a possible risk-off asset.
«Today’s rise is further evidence of bitcoin’s growing role as a risk-off asset,” Gerry O’Shea, Head of Global Market Insights at Hashdex, told CoinDesk in an email. “In the last five years, bitcoin has had double-digit returns in the months following major geopolitical and macro events such as the COVID pandemic, Russia’s invasion of Ukraine, and the U.S. banking crisis in 2023.”
“Gold is now trading at its nominal all-time high, which could foreshadow strong performance from bitcoin if investors’ appetite for risk-off assets increases — while global liquidity is increasing and the US regulatory environment is rapidly improving,” O’Shea added.
Surging gold prices and bitcoin’s (BTC) relatively strong price action amid a global market sell-off have some traders revisiting the latter’s role as “digital gold” — a big narrative in bitcoin’s early years but one that has lost steam in recent times.
What analysts are saying
Meanwhile, chart watchers say bitcoin crossed a key technical indicator this week that puts it in place for a higher move in the coming days.
“Bitcoin jumped to 87,500 on Monday, testing the late March highs,” Alex Kuptsikevich, the FxPro chief market analyst, told CoinDesk. “The leading cryptocurrency managed to bounce off the 50-day moving average, around which it had been hovering for the past week and a half.”
“A solid close above the $88,000 area would signal a break in the downtrend and a return to levels above the 200-day moving average. A confident move higher from current levels would be a key signal for the entire market, once again positioning BTC as the flagship set to lead the way,” Kuptsikevich added.
Moving averages in financial markets are tools used to smooth out price data over time, showing the average price of an asset (like a stock) over a specific period. The 50-day and 200-day moving averages are commonly used because they represent medium- and long-term trends, respectively.
These periods are widely followed, making them self-fulfilling as many traders act on them, reinforcing their importance.
Here’s what a machine’s read of the market is, powered by CoinDesk’s AI-driven market insights bot.
ADA Price Analysis
- ADA broke key resistance at $0.630 amid broader crypto market recovery.
- Grayscale’s spot ADA ETF filing sees approval odds jump to 61%, potentially opening doors for institutional investment.
- Clear bullish reversal starting April 21, with volume significantly increasing to over 68 million during the breakout candle.
- Fibonacci retracement levels suggest potential continuation toward $0.650.
XRP Price Analysis
- XRP established a clear uptrend with a 3.4% overall range ($2.039-$2.143) over the analyzed period.
- Strong support identified at $2.06, with buyers consistently stepping in at this level.
- Significant breakout occurred on April 21, when XRP surged 4.3% in just two hours, breaking through previous resistance at $2.09.
- Volume analysis confirms genuine buying interest, with trading activity spiking to over 100M during breakout periods.
ETH Price Analysis
- Ethereum enters historical «buy zone» according to analyst Ali Martinez, with ETH trading below the lower MVRV Price Band—a metric that has previously signaled strong buying opportunities.
- ETH currently trades in tight consolidation between $1,550-$1,630, with critical support at $1,500 and resistance at $1,700, as investors await a decisive breakout amid global economic pressures.
- Clear support level established at $1,570 with resistance at $1,650, with trading volume spiking to 490,365 during the recent selloff.
- The 48-hour price range of $1,544-$1,593 (3.1%) suggests continued market instability.
- Fibonacci retracement levels indicate potential consolidation between $1,565-$1,590 before establishing a definitive trend direction.
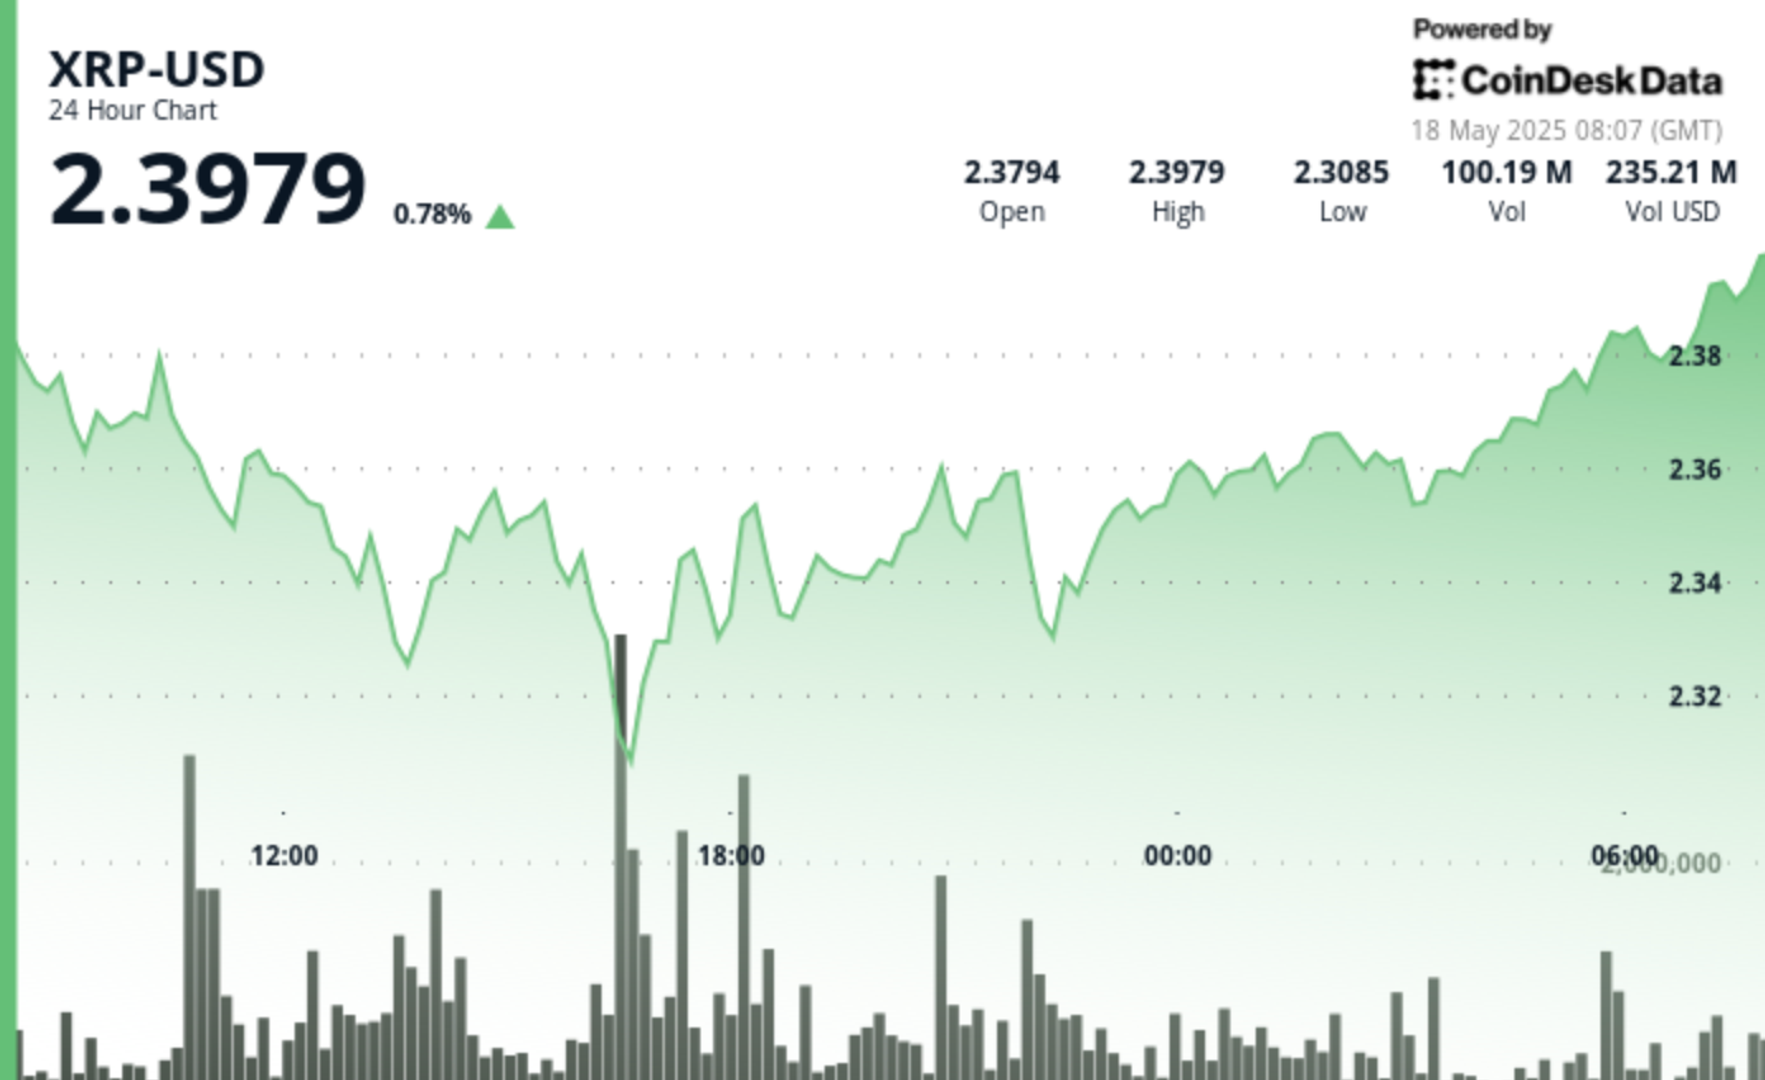
Global economic tensions and regulatory developments continue to influence XRP’s price action, with the digital asset showing remarkable resilience despite recent volatility.
After experiencing a significant dip to $2.307 on high volume, XRP has established an upward trajectory with a series of higher lows, suggesting continued momentum as it approaches resistance levels.
Technical indicators point to a potential bullish breakout, with multiple analysts highlighting critical support at $2.35-$2.40 that must hold for upward continuation.
Technical Analysis Highlights
- Price experienced a 3.76% range ($2.307-$2.396) over 24 hours with a sharp sell-off at 16:00 dropping to $2.307 on high volume (77.9M).
- Strong support emerged at $2.32 level with buyers stepping in during high-volume periods, particularly during the 13:00-14:00 recovery.
- Asset established upward trajectory, forming higher lows from the bottom, with resistance around $2.39 tested during 07:00 session.
- In the last hour, XRP climbed from $2.358 to $2.368, representing a 0.42% gain with notable volume spikes at 01:52 and 01:55.
- Price surged past resistance at $2.36 to reach $2.366, later establishing new local highs at $2.369 during 02:03 session on substantial volume (539,987).
- Currently maintaining strength above $2.368 support level with decreasing volatility suggesting potential continuation of upward trajectory.
Disclaimer: This article was generated with AI tools and reviewed by our editorial team to ensure accuracy and adherence to our standards. For more information, see CoinDesk’s full AI Policy. This article may include information from external sources, which are listed below when applicable.
External References
- «XRP price path to $3.40 remains intact — Here is why«, Cointelegraph, published May 16, 2025.
- «XRP Price Watch: Bulls Eye $2.60 as Long-Term Trend Holds«, Bitcoin.com News, published May 17, 2025.
- «XRP Price Explosion To $5.9: Current Consolidation Won’t Stop XRP From Growing«, NewsBTC, published May 17, 2025.
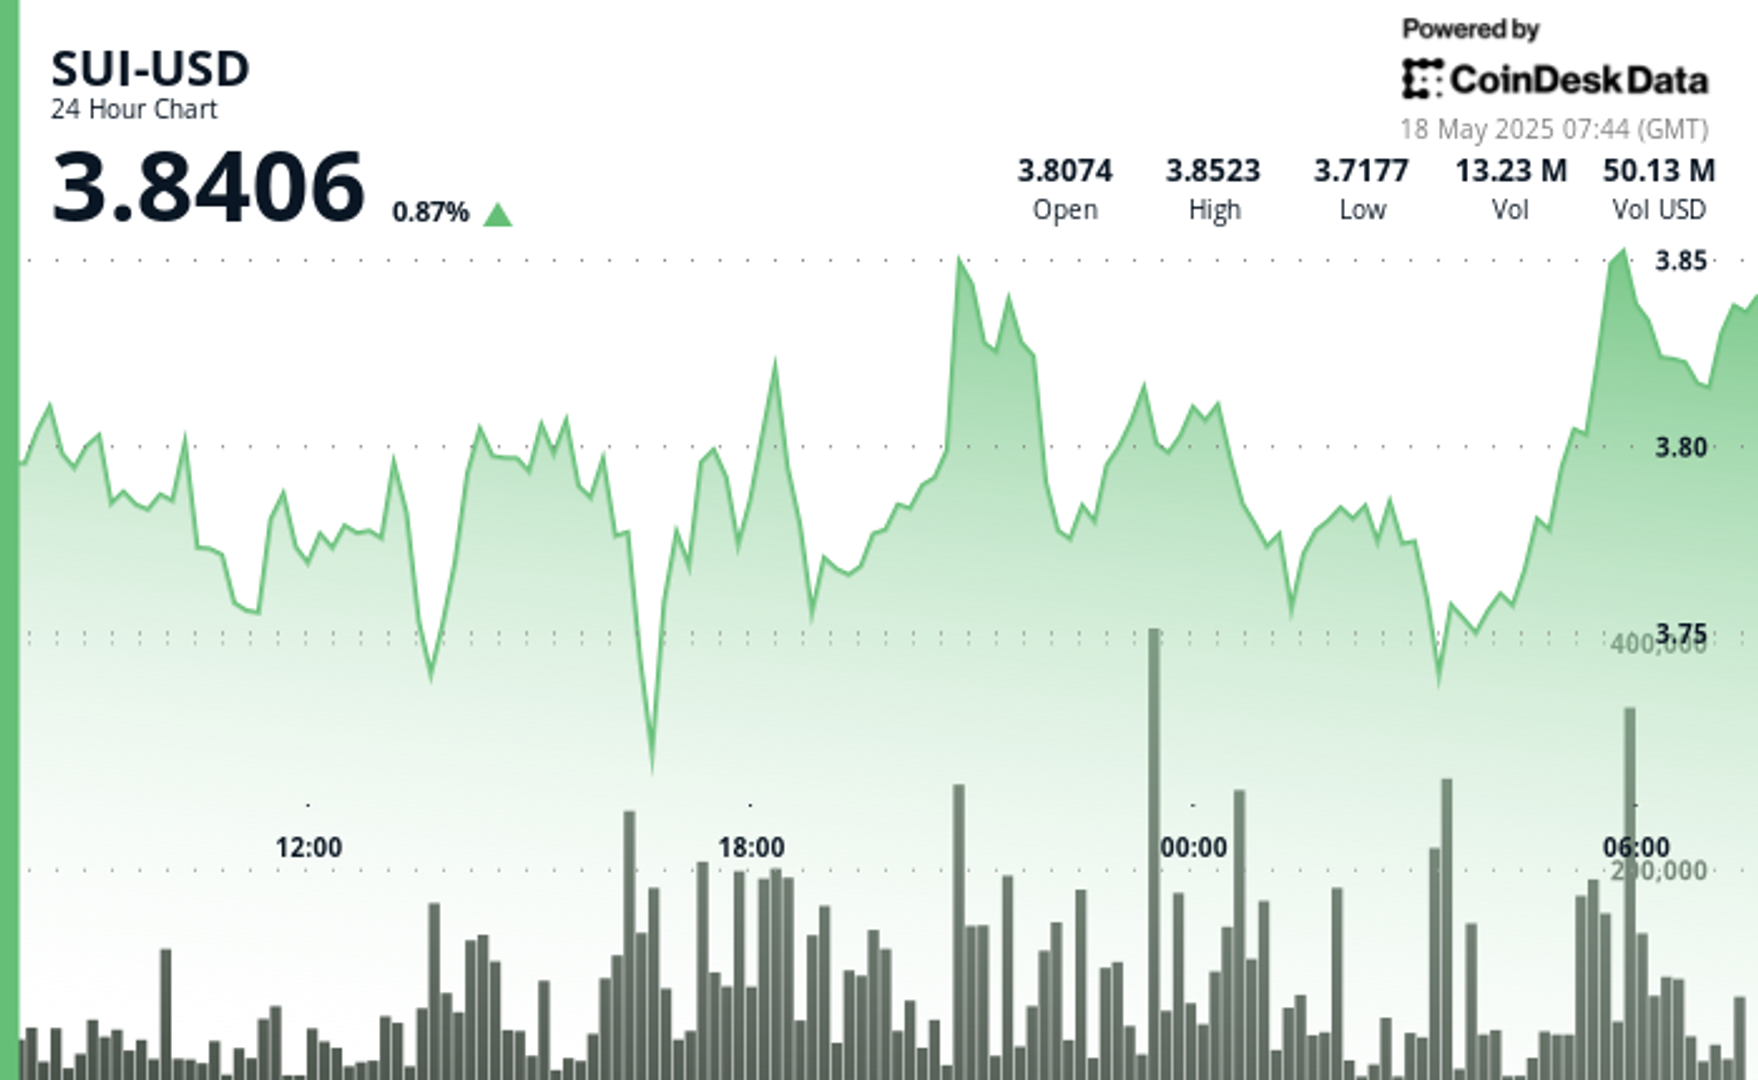
Global economic tensions and shifting trade policies continue to influence cryptocurrency markets, with SUI showing particular resilience.
The asset established a trading range of 4.46% between $3.70 and $3.86, finding strong volume support at the $3.755 level.
A notable bullish momentum emerged with price surging 1.9% on above-average volume, establishing resistance at $3.850.
The formation of higher lows throughout the latter part of the day suggests consolidation above the $3.775 support level.
Technical Analysis Highlights
- SUI established a 24-hour trading range of 0.165 (4.46%) between the low of 3.700 and high of 3.862.
- Strong volume support emerged at the 3.755 level during hours 17-18, with accumulation exceeding the 24-hour volume average by 45%.
- Notable bullish momentum occurred in the 20:00 hour with price surging 7.2 cents (1.9%) on above-average volume.
- Resistance established at 3.850 with higher lows forming throughout the latter part of the day.
- Decreasing volatility in the final hours suggests consolidation above the 3.775 support level.
- Significant buyer interest appeared between 01:27-01:30, forming a strong support zone at 3.756-3.760 with exceptionally high volume (over 300,000 units per minute).
- Decisive bullish reversal began at 01:42, establishing a series of higher lows and higher highs.
- Breakout above 3.780 occurred at 01:55, followed by consolidation near 3.785 with decreasing volume.
Disclaimer: This article was generated with AI tools and reviewed by our editorial team to ensure accuracy and adherence to our standards. For more information, see CoinDesk’s full AI Policy. This article may include information from external sources, which are listed below when applicable.
External References
- «Sui price up 5.16% intra-day: bullish structure remains strong«, crypto.news, published May 16, 2205.
- «SUI Set to Explode, But Don’t Sleep on XRP and Other Altcoins«, CoinPedia, May 16, 2025.
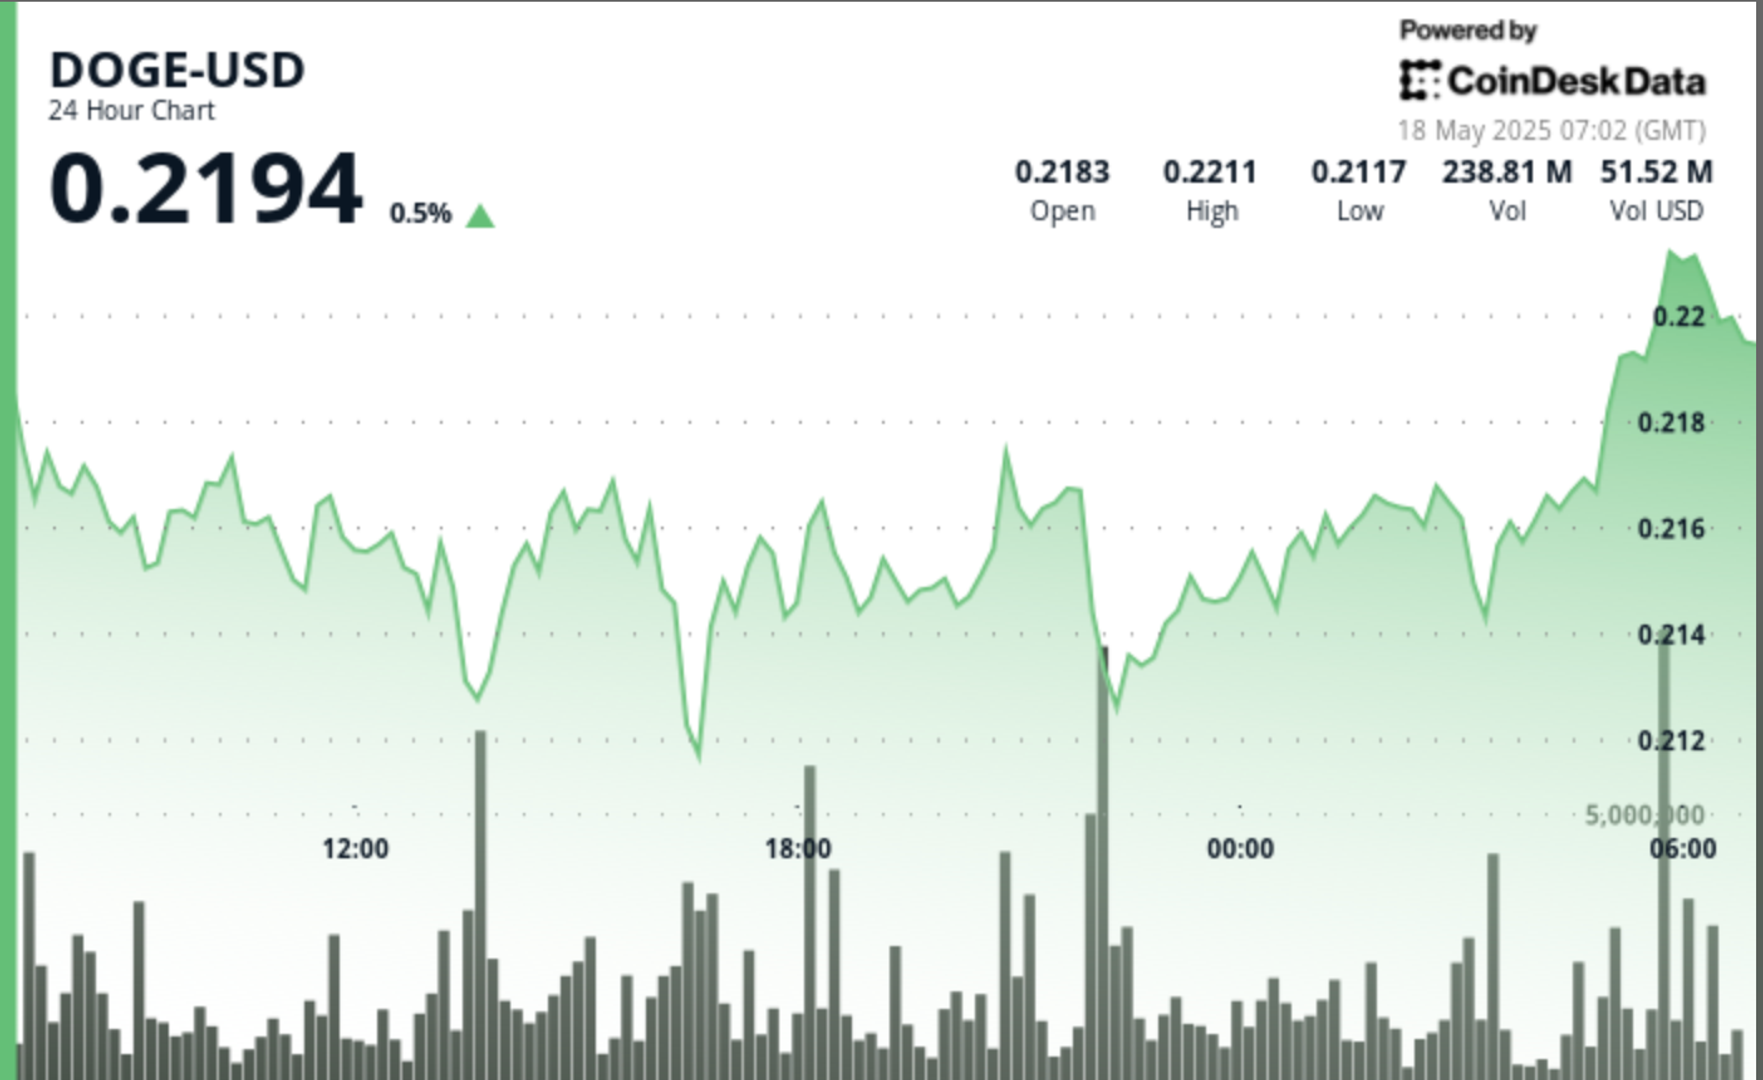
Geopolitical tensions and evolving trade policies continue to influence cryptocurrency markets, with Dogecoin showing resilience amid broader economic uncertainty.
Despite macroeconomic headwinds, DOGE has maintained support above key moving averages while forming a potential bull flag pattern that could target $0.35 if validated by continued buying pressure.
Technical Analysis Highlights
- DOGE experienced significant volatility with a 4.3% range (0.211-0.220) over the past 24 hours, forming a key support zone around 0.212 validated by high volume rebounds at 13:00 and 22:00.
- The price action reveals a bullish recovery pattern from the 16:00 low, with resistance emerging at 0.217-0.220.
- The 20:00 candle’s strong volume surge above the 24-hour average confirms renewed buying interest, suggesting potential upward momentum if DOGE can maintain its position above the established support level.
- In the past hour, DOGE has demonstrated significant bullish momentum, climbing from 0.215 to 0.216 with notable volume spikes at 01:17, 01:21, and 01:54-01:55.
- The price established a strong support zone around 0.215 during the early minutes, followed by a decisive breakout at 01:16-01:17 where volume surged over 8 million.
- The uptrend continued with higher lows forming a clear ascending pattern, culminating in a new resistance test at 0.216-0.217 range.
- The final minutes saw particularly heavy trading activity with volumes exceeding 7 million at 02:01-02:02, confirming strong buyer interest and suggesting potential for further upside movement.
Disclaimer: This article was generated with AI tools and reviewed by our editorial team to ensure accuracy and adherence to our standards. For more information, see CoinDesk’s full AI Policy. This article may include information from external sources, which are listed below when applicable.
External References
- «Dogecoin Eyes $0.35 as Whale Accumulation Signals Bull Flag Breakout«, The Crypto Basic, published May 16, 2025.
- «Dogecoin Hovers at $0.22 Following Weeks of Gains, Analysts Share Mixed Outlooks«, NewsBTC, published May 17, 2025.


XRP Price Surges After V-Shaped Recovery, Targets $3.40

SUI Surges After Finding Strong Support at $3.75 Level

Dogecoin (DOGE) Whales Accumulate 1 Billion DOGE Amid Critical Support Formation
-

 Fashion7 месяцев ago
These \’90s fashion trends are making a comeback in 2017
-
Entertainment7 месяцев ago
The final 6 \’Game of Thrones\’ episodes might feel like a full season
-
Fashion7 месяцев ago
According to Dior Couture, this taboo fashion accessory is back
-
Entertainment7 месяцев ago
The old and New Edition cast comes together to perform
-
Business7 месяцев ago
Uber and Lyft are finally available in all of New York State
-
Sports7 месяцев ago
Phillies\’ Aaron Altherr makes mind-boggling barehanded play
-
Entertainment7 месяцев ago
Disney\’s live-action Aladdin finally finds its stars
-
Sports7 месяцев ago
Steph Curry finally got the contract he deserves from the Warriors