Connect with us

Uncategorized

Bitcoin Mining Stocks With AI Ambition Battered 20%-30% Lower as Nvidia’s Plunge Grips Crypto

Published

on

Bitcoin (BTC) managed a minor bounce of its worst levels of the day, but the bitcoin mining stocks were unable to reverse any of their plunge as Chinese AI startup DeepSeek threw into question ideas that the miners had value as data center plays.

The largest cryptocurrency was recently trading at $101,500, up from earlier lows around $98,000 and still down 3% over the past 24 hours. The broader market gauge CoinDesk 20 Index fell 5.6%, dragged lower by double-digit losses of AI-adjacent tokens render (RNDR) and filecoin (FIL). Solana, which is a key hub for crypto AI agent tokens, also fell over 10%.

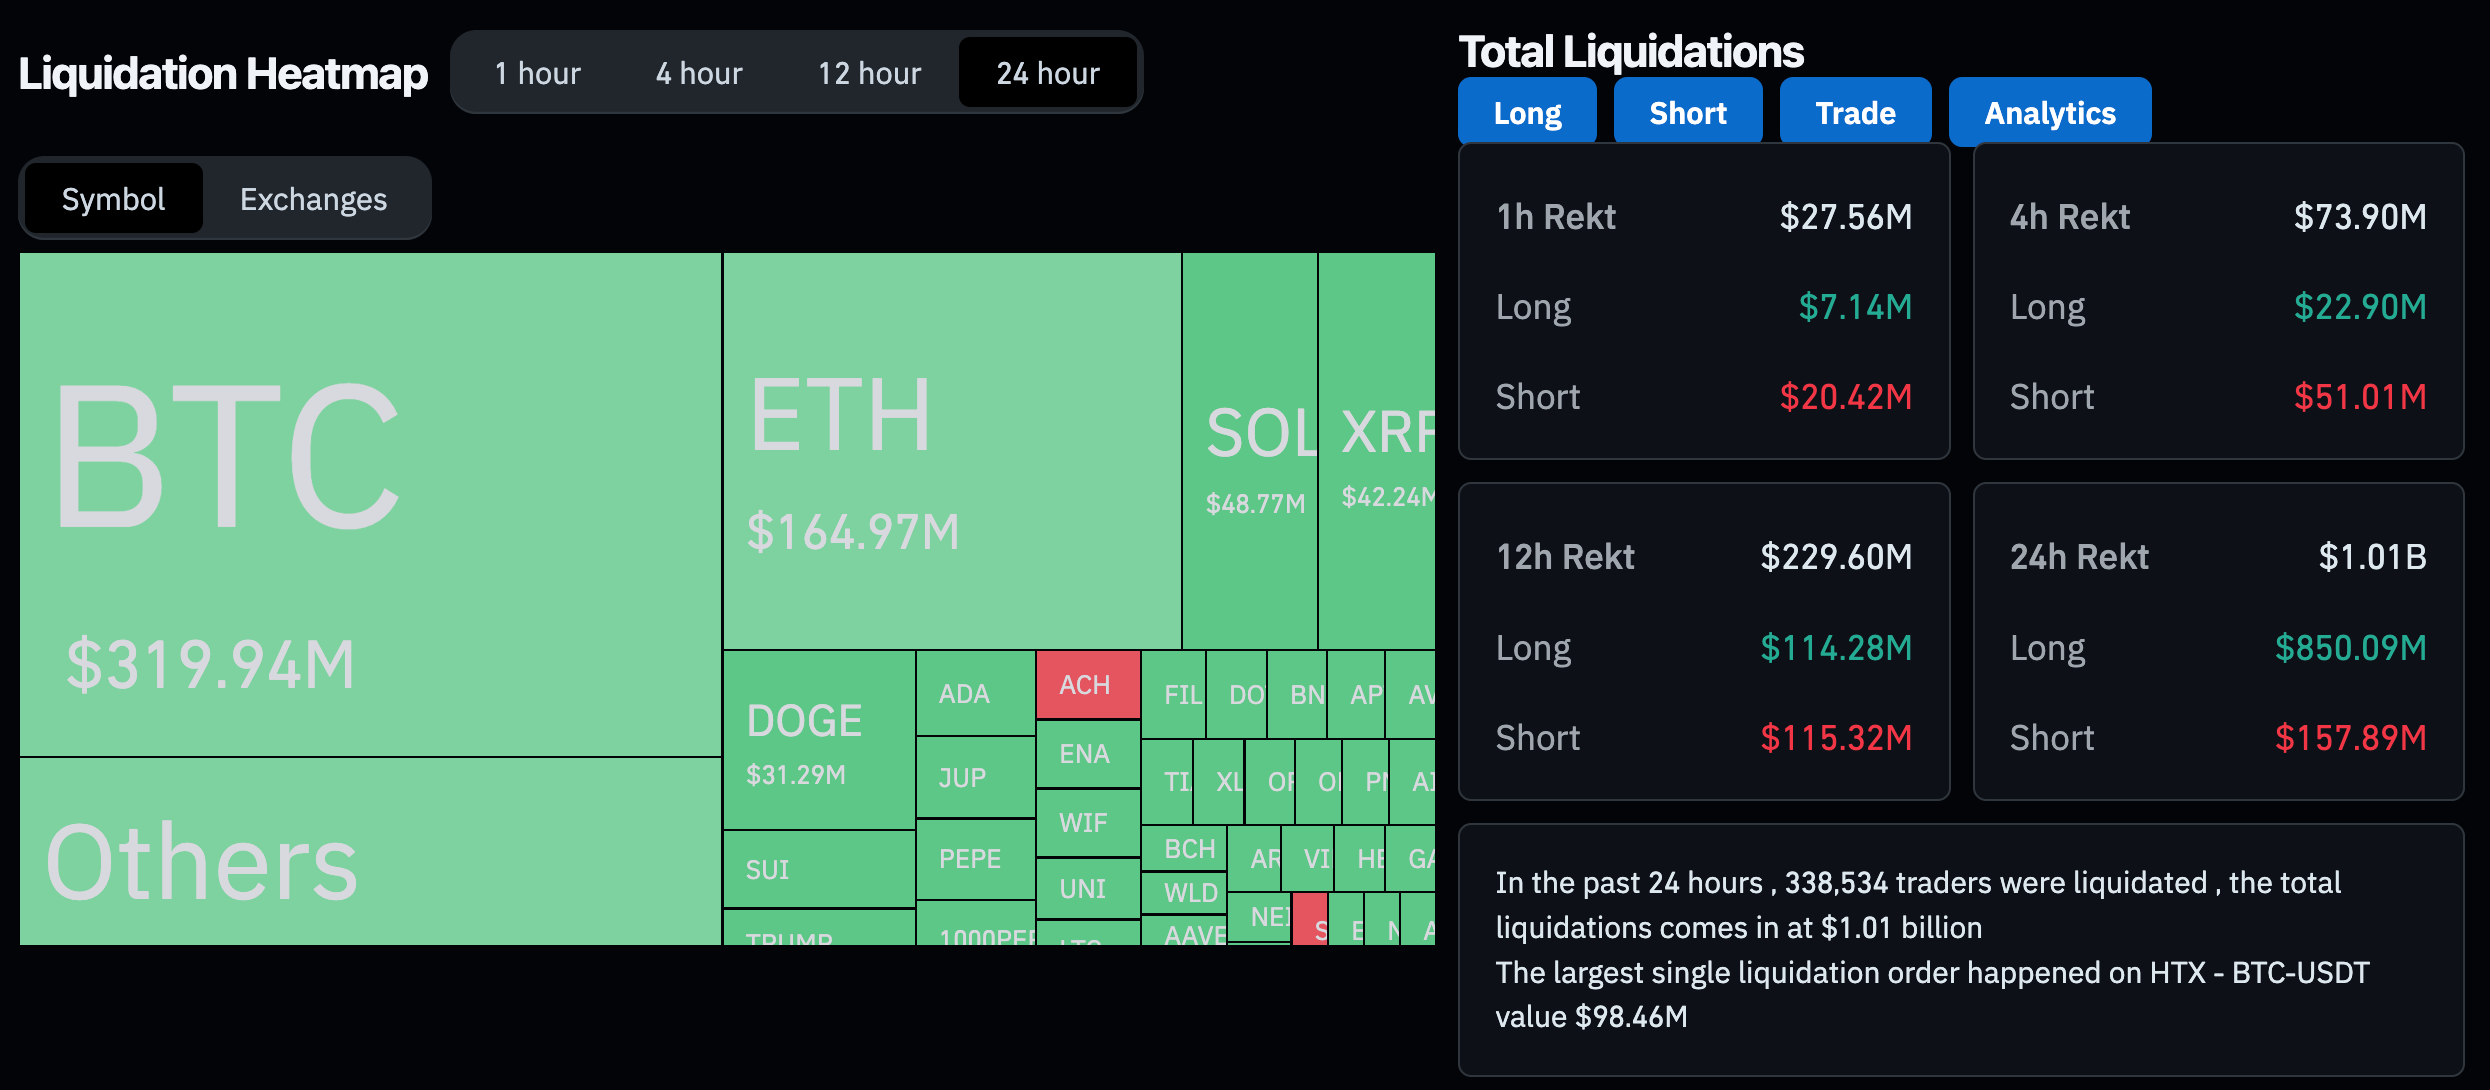
The sharp move down liquidated nearly $1 billion of leveraged derivatives positions across crypto assets, CoinGlass data shows.

The Nasdaq closed the session 3% lower, with Nvidia leading losses with a 17% plunge, erasing $465 billion of its market value in a day. Today’s move also reinforced bitcoin’s tight correlation with tech stocks, Standard Chartered Bank’s digital asset research head Goeffrey Kendrick noted.

The broad-market pullback didn’t spare crypto-adjacent stocks, as crypto exchange Coinbase (COIN) and investment firm Galaxy (GXY) closed the day 6.7% and 15.8% lower. MicroStrategy, the largest corporate bitcoin holder, held up relatively well with a 1.5% decline.

Crypto mining stock rout

Bitcoin mining stocks suffered even steeper losses, with large-cap miners Riot Platforms (RIOT), MARA Holdings (MARA) plunging 8.7% and 16%, respectively.

Miners that pivoted to high-performance computing to provide infrastructure for artificial intelligence (AI) training fared even worse. Core Scientific (CORZ), TeraWulf (WULF), Bitdeer (BTDR) and Cipher Mining (CIPH), Applied Digital Corporation (APLD) all endured 25%-30% declines through the day.»It seems that the crypto markets and AI supply chain-linked stocks — such as the Nuclear ETF, which had risen 20% over the past month leading up to today — reached a point where they needed an ‘event’ to trigger a profit-taking correction after pricing in a significant amount of ‘good news,'» said Aurelie Barthere, principal research analyst at blockchain intelligence firm Nansen.

Market participants will focus on this week’s Federal Reserve meeting and large tech firms’ earnings reports. Corporate earnings have been strong so far, but the coming reports from Nvidia and other big tech firms «will need to beat expectations to sustain the momentum,» Barthere said.

The Monday selloff could also provide an attractive entry opportunity for altcoin investors who missed out on the crypto rally following Donald Trump’s election victory, Barthere added, «particularly in higher-beta crypto tokens like solana (SOL), which have experienced steeper sell-offs compared to BTC.»

Read more: Bitcoin’s DeepSeek-Triggered Selloff Is a Buy the Dip Opportunity, Analysts Say

Continue Reading
Click to comment

Leave a Reply

Ваш адрес email не будет опубликован. Обязательные поля помечены *

Uncategorized

Chart of the Week: Crypto May Now Have Its Own ‘Inverse Cramer’ and Profits Are in the Millions

Published

on

By

Meet James Wynn, the pseudonymous trader on Hyperliquid who became famous for his $1 billion bitcoin short bet, could now be gaining a new kind of fame: as crypto’s own “Inverse Cramer.”

For those unfamiliar with the Cramer lore: he’s the high-octane, loud-money mascot of CNBC’s Mad Money, a former hedge fund manager turned stock picker with a hit-or-miss track record that turned into a meme. Many retail traders started doing the exact opposite of his recommendations, and the idea became so famous that an “Inverse Cramer ETF” was launched (it was later shut down, but the meme lives on).

Now, crypto traders might have found their new «Inverse Jim Cramer» in James Wynn’s trading wallet.

«The winning strategy lately? Do the opposite of James Wynn,» said blockchain sleuth Lookonchain in an X post, pointing to a trader who has been making millions by doing exactly the opposite of James Wynn’s trades.

Betting against James Wynn. (Lookonchain)

«0x2258 has been counter-trading James Wynn—shorting when James Wynn goes long, and going long when James Wynn shorts. In the past week, 0x2258 has made ~$17M, while James Wynn has lost ~$98M,» Lookonchain said in the post.

Seventeen million dollars in a week just by inverse-betting on one trader is not a bad payday. However, this might be a short-term trade, and one should be very cautious as things can change lightning fast in the trading world, leaving punters millions in losses if not hedged properly.

Even James Wynn said, «I’ll run it back, I always do. And I’ll enjoy doing it. I like playing the game,” after the trader got fully liquidated over the weekend.

So, maybe this Reddit gem: «How much money would you have made if you did the exact opposite of Jim Cramer?» would never translate to include James Wynn. But the sentiments, though, are loud and clear: in a market where perception is half the trade, even your PnL can get memed!

A bonus read: Jim Cramer Doesn’t Know Bitcoin«

Continue Reading

Uncategorized

XRP’s Indecisive May vs. Bullish Bets – A Divergence Worth Watching

Published

on

By

XRP, used by Ripple to facilitate cross-border transactions, ended May with signs of indecision. Still, activity on the dominant crypto options exchange, Deribit, suggests that bulls aren’t ready to back down yet.

The payments-focused cryptocurrency formed a «doji» with a long upper shadow in May, a classic sign of indecision in the market, according to charting platform TradingView.

The long upper wick suggests that bulls pushed prices higher to $2.65, but bears stepped in and rejected those levels, driving prices down to near the level seen at the start of the month.

XRP's monthly candlesticks chart. (TradingView)

The appearance of the doji suggests the recovery rally from the early April lows near $1.60 has likely run out of steam. Doji candles appearing after uptrends often prompt technical analysts to call for bull exhaustion and a potential turn lower.

Accordingly, last week, some traders purchased the $ 2.40 strike put option expiring on May 30. A put option offers insurance against price drops.

Bullish options open interest

The overall picture remains bullish, with options open interest concentrated in higher-strike calls in a sign of persistent positive sentiment. Open interest refers to the number of active contracts at a given time. A call option gives the purchaser an asymmetric upside exposure to the underlying asset, in this case, XRP, representing a bullish bet.

«XRP open interest on Deribit is steadily increasing, with the highest concentration of strikes clustered on the upside between $2.60 and $3.0+, reflecting a notably bullish sentiment while the spot price currently trades at $2.16,» Luuk Strijers, CEO of Deribit, told CoinDesk.

XRP's options open interest. (Deribit)

The chart shows that the $4 call option is the most popular, with a notional open interest of $5.39 million. Calls at the $3 and $3.10 strikes have an open interest (OI) of over $5 million each. Notional open interest refers to the dollar value of the number of active contracts.

«XRP option open interest is split across June and September expiries, with monthly notional volumes approximating $65–$70 million, of which over 95% is traded on Deribit,» Strijers said.

The bullish mood likely stems from XRP’s positioning as a cross-border payments solution and mounting expectations of a spot XRP ETF listing in the U.S. Furthermore, the cryptocurrency is gaining traction as a corporate treasury asset.

Ripple, which uses XRP to facilitate cross-border transactions, recently highlighted its potential to address inefficiencies in SWIFT-based cross-border payments. The B2B cross-border payments market is projected to increase to $50 trillion by 2031, up 58% from $31.6 trillion in 2024.

Continue Reading

Uncategorized

ETH Price Dips Below $2,500 on Whale Exit Fears, Then Bounces Back Above Key Level

Published

on

By

Ethereum (ETH) faced renewed downside pressure in late trading, tumbling below the $2,500 level as selling volume surged and broader risk sentiment weakened. Global trade tensions and renewed U.S. tariff risks have triggered risk-off flows, with digital assets increasingly mirroring traditional markets in their reaction to geopolitical uncertainty.

On-chain data revealed sizable inflows to centralized exchanges — most notably 385,000 ETH to Binance —a dding to speculation that institutional players may be trimming positions. Although ETH has since recovered modestly to trade around $2,506, market observers are closely watching whether buyers can defend this level or if another leg lower is imminent.

Technical Analysis Highlights

  • ETH traded within a volatile $48.61 range (1.95%) between $2,551.09 and $2,499.09.
  • Price action formed a bullish ascending channel before breaking down in the final hour.
  • Heavy selling emerged near $2,550, with profit-taking accelerating into a sharp reversal.
  • ETH dropped from $2,521.35 to $2,499.09 between 01:53 and 01:54, with combined volume exceeding 48,000 ETH across two minutes.
  • Volume normalized shortly after, and price recovered slightly, consolidating around the $2,504–$2,508 band.
  • The $2,500 level is now acting as interim support, though momentum remains fragile with signs of distribution still evident in recent volume patterns.

External References

Continue Reading

Trending

Copyright © 2017 Zox News Theme. Theme by MVP Themes, powered by WordPress.