Uncategorized
Bitcoin Market Projection for 2025
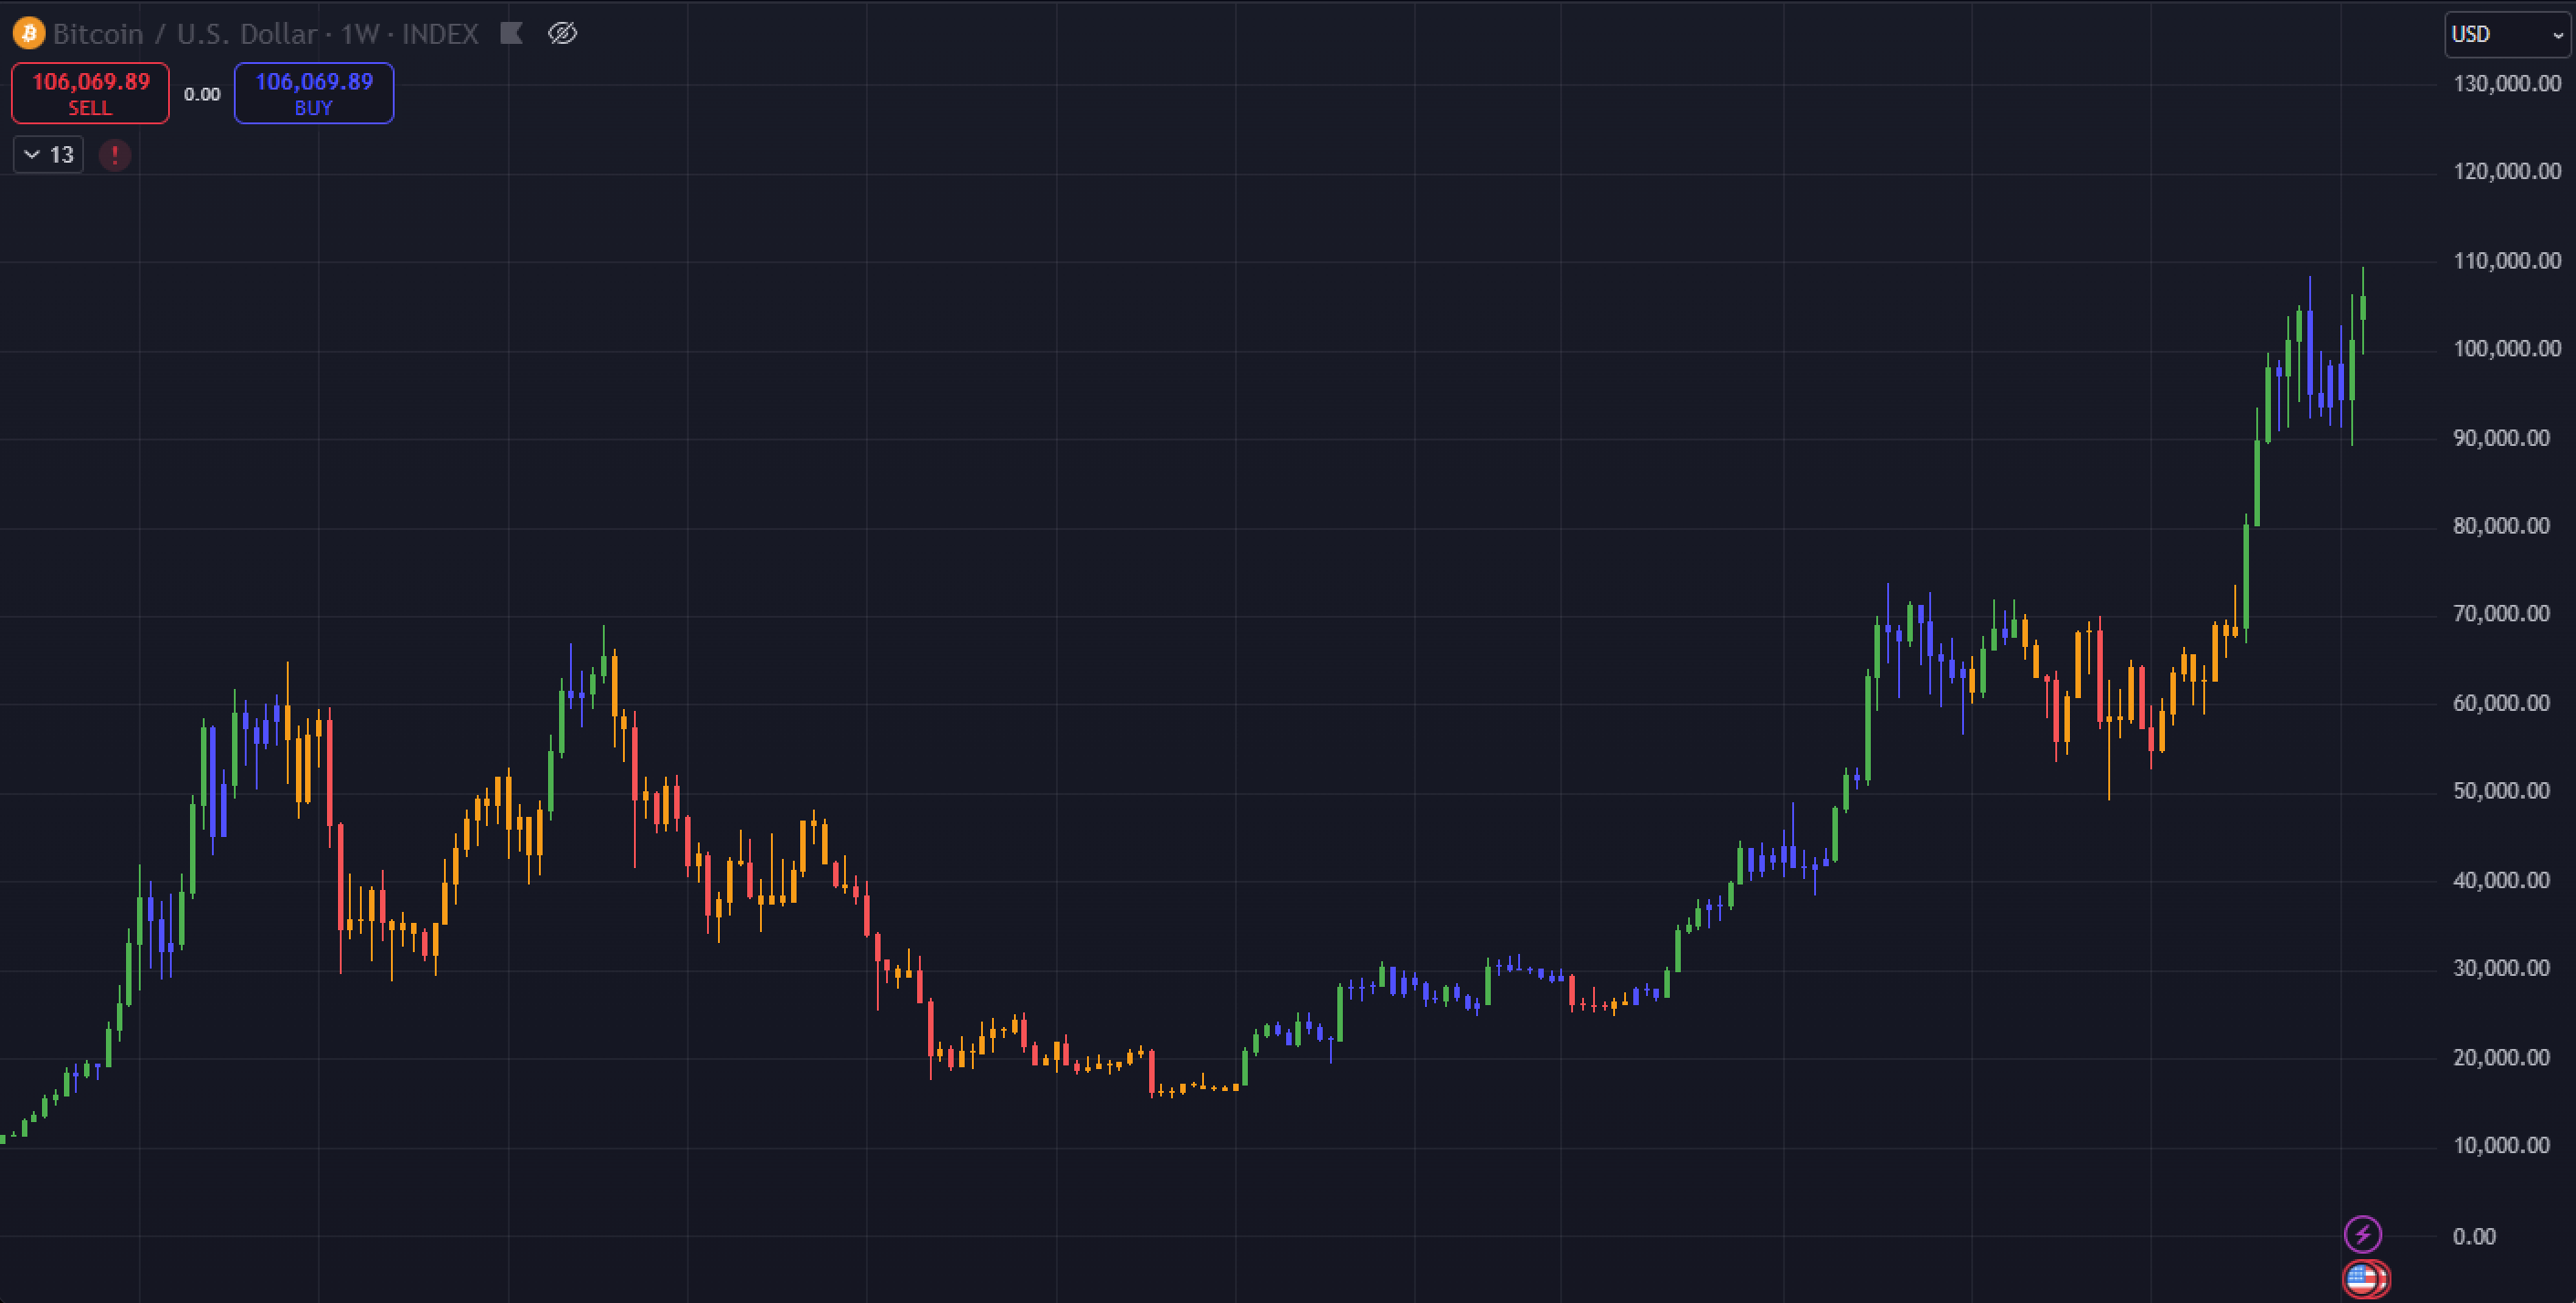
Price outlook
Our analysis for 2025 forecasts bitcoin reaching a target of $150,000 in the first half of the year. However, an initial pullback may occur in Q1 if the newly inaugurated Trump administration fails to introduce the anticipated “Strategic Bitcoin Reserve” at the pace expected by the fast-moving crypto market.
Even without a fully implemented reserve strategy, bitcoin is expected to rally, driven by bullish momentum. We anticipate the price to enter the $130,000–$150,000 range by Q2 of 2025, supported by strong market catalysts.
You’re reading Crypto Long & Short, our weekly newsletter featuring insights, news and analysis for the professional investor. Sign up here to get it in your inbox every Wednesday.
Key catalysts driving growth
Regulatory progress: With major regulatory barriers cleared in jurisdictions like the U.S., corporate interest in bitcoin has surged.
Corporate and institutional demand: A growing number of corporations are actively planning to deploy capital into cryptocurrency. Hedge funds, large corporates, and family offices are showing unprecedented enthusiasm for bitcoin exposure.
This widespread interest signifies a strong foundation for bitcoin’s upward trajectory in 2025.
Quantitative models and risks
While optimism runs high, our quantitative models flag no potential risks under $90,000. Specifically:
The Vanguard model, which recently flipped to a buy signal for the first time this year, confirms bullish momentum around bitcoin.
Weekly price closes above $100,000 should keep the bullish sentiment alive.
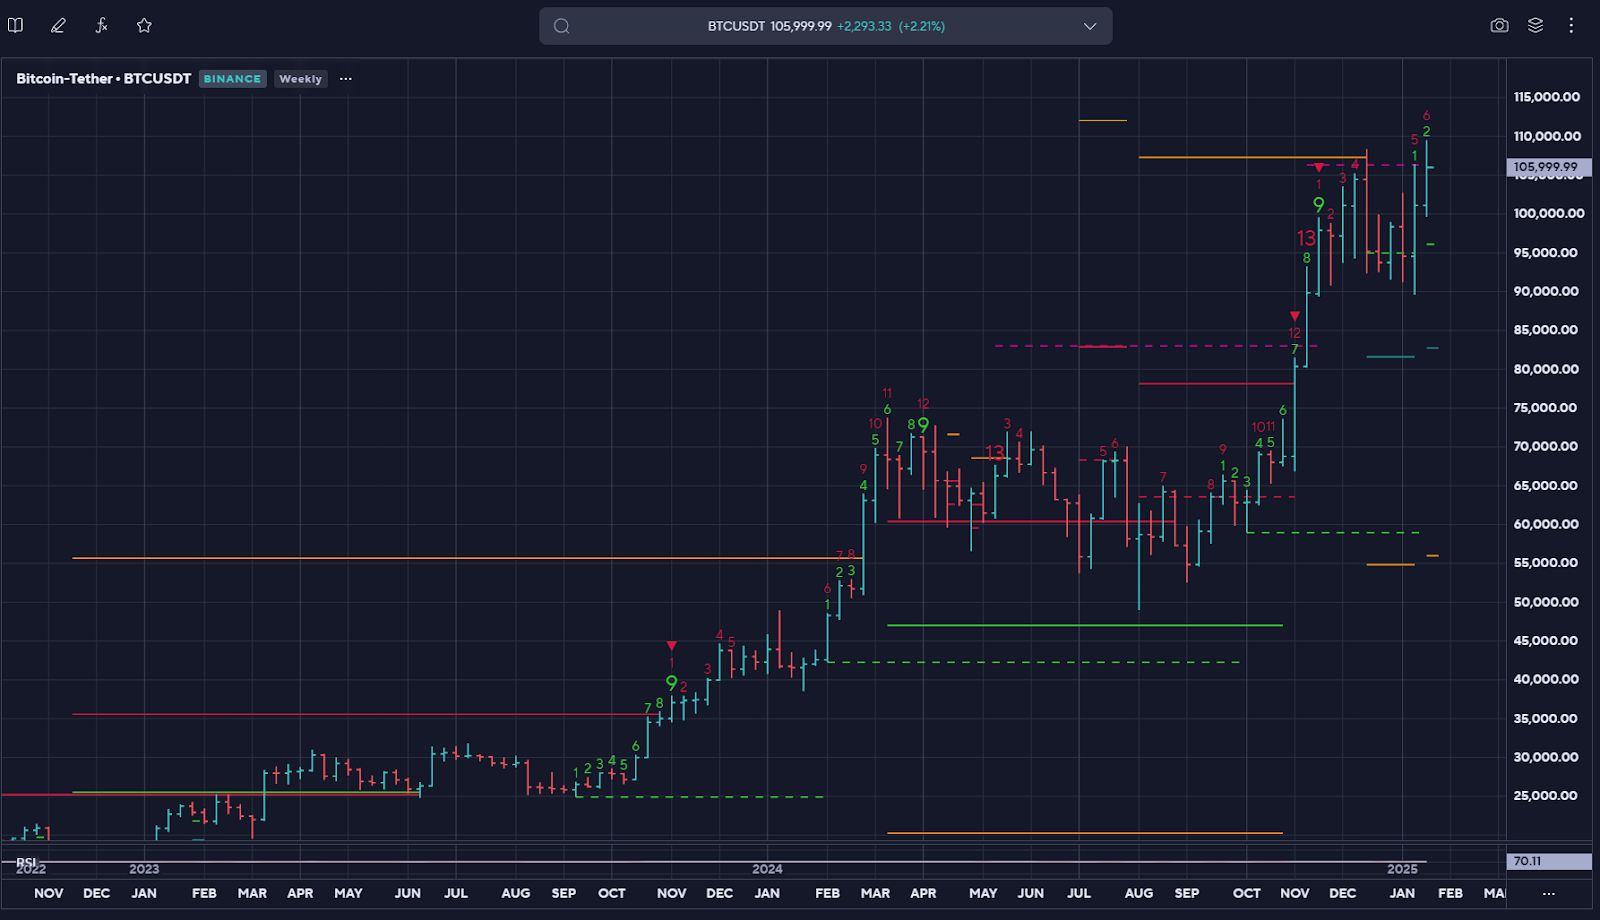
Insights from DeMark indicator
The DeMark TD Sequential indicator suggests bitcoin is on a bullish setup on the weekly timeframe after reaching its propulsion target of $108,300 and completing one of its typical 10% corrections down to $90,000, which was bought with conviction. A propulsion target is a predefined price level derived from a series of calculations that help traders identify key areas of potential support or resistance. These targets are designed to indicate where the price might move in the future, often serving as potential breakout or exhaustion points.
Bitcoin is approximately seven weeks away from completing its bullish TD setup phase eyeing its first potential propulsion target of $119,270.
Weekly price closes above $107,300 could trigger the next bullish acceleration.
The week of Trump’s inauguration, the DeMark TD Sequential indicator showed topping patterns on the daily timeframe introducing a bearish direction towards $90,000, but as long as bitcoin price stays above $104,400, the downside risk is limited.
Dollar strength and macro risks
The U.S. dollar’s weakness in the coming weeks and months presents another catalyst for crypto:
Capital inflows into the U.S. economy
Optimism around Trump’s «America First» policies
DXY technical charts indicative of topping patterns
Summary
Despite potential near-term volatility and choppy price action, we maintain a strong bullish outlook for bitcoin in 2025, with projected highs reaching $150,000 or more. Key risks include corrections toward the $90,000s, should buy signals fail to emerge. We will be navigating this dynamic market for potential long-term value investing at around the $82,000 and $85,000 range. Additionally, weekly price closes below $99,000 should be the trigger for the next bearish leg down.
Uncategorized
Chart of the Week: ‘Dire Picture’ for BTC Miners as Revenue Flatlines Near Record Low

Hashprice, a key metric used to gauge miner revenue, is currently hovering near a five-year low, according to HashRate Index—a stark reminder of how difficult the mining business has become.
In simple terms, the metric is the income miners can expect per unit of computing power, denoted by per petahash (PH/s). It can be denominated in U.S. dollars or BTC, although it’s most commonly quoted in USD for practical comparison.
At present, hashprice sits at $44.00 PH/s, only slightly above its August 2024 low, when bitcoin reached $49,000 amid the yen carry trade unwind. Currently, bitcoin is trading around $84,000.
Despite the higher BTC price, miner revenue is dwindling, which paints a dire picture of the mining industry as a whole after the recent halving event cut the rewards by half. Rising competition, higher mining difficulty, lower transaction revenue, and spiking energy costs have added more pressure to the revenue.
However, it’s not all bad. At around $44.00 PH/s levels, depending on what type of mining machines miners are using, miners can still be near or at breakeven, although far from 2021’s mining bull run.
Looking ahead, deteriorating market conditions, stagnant bitcoin prices, and geopolitical uncertainty, such as potential tariffs affecting mining operations, could create further headwinds for the industry.
This is reflected in the performance of the Valkyrie Bitcoin Miners ETF (WGMI), which is down 50% year-to-date while BTC fell about 10%, underscoring the challenging environment facing the mining sector.
It makes sense that miners are increasingly pivoting into other revenue streams, such as reallocating computing power for artificial intelligence.
Read more: Bitcoin Mining Stocks Plunge as Revenue Craters Amid Market Carnage
Uncategorized
XRP Resembles a Compressed Spring Poised for a Significant Price Move as Key Volatility Indicator Mirrors 2024 Patterns

The price action for XRP and bitcoin (BTC) resembles a tightly compressed spring on the verge of uncoiling with a sudden release of energy.
That’s the message from a key volatility indicator called Bollinger Bandwidth. Bollinger Bands are volatility bands set at plus two and minus two standard deviations above and below the 20-period moving average (SMA) of an asset’s market price. The bandwidth measures the space between these bands as a percentage of the 20-day moving average.
In the case of XRP, the Bollinger bandwidth has narrowed to its lowest level since October 2024 on the 4-hour chart, where each candle represents price action for a four-hour period. The 4-hour chart interval is quite popular in the 24/7 crypto market, allowing traders to analyze and predict short-term price movements. Bitcoin’s 4-hour chart mirrors the Bollinger bandwidth pattern in XRP.
The long-held belief is that tighter Bollinger bandwidth, reflecting a quiet period in the market, is akin to a compressed spring ready for significant movement.
During these calm phases, the market accumulates energy that is eventually released once a clear direction is established, often leading to dramatic rallies or sharp price declines/ Both XRP and bitcoin surged in November-December following an extended range-bound period that left their bandwidth at levels comparable to those observed today.
That said, tighter bands do not always indicate a bullish volatility explosion; they can also foreshadow a sell-off. For example, the bands tightened in October 2022, signaling a significant move ahead, which materialized on the downside after FTX went bust.
It remains to be seen whether this latest spring compression will trigger bullish volatility or lead both tokens into a tailspin. The recent hawkish comments from Federal Reserve’s Chairman Jerome Powell and selling by some whales favor the latter.
Stay alert!
Uncategorized
Trump’s Official Memecoin Surges Despite Massive $320 Million Unlock in Thin Holiday Trading

TRUMP, the memecoin tied to U.S. President Donald Trump, gained more than 9% in the past 24 hours following a $320 million token unlock. The price now sits around $8.40, still down more than 88% from its peak above $71 on Jan. 18.
The recent unlock may spell further trouble for investors, who are estimated to have lost a total of $2 billion after purchasing the token earlier this year.
Token unlocks typically flood the market with new supply and tend to depress prices. But in this case, the market appears to have priced in the release beforehand, potentially explaining the price uptick. Still, the $320 million unlock raises the risk of a large sell-off, especially given TRUMP’s thin liquidity.
Data from CoinMarketCap shows that just $1.3 million could move the token’s price by 2% on major exchanges. The move also comes during the Easter holiday weekend, when trading volumes are subdued and price swings can be more pronounced.
On social media, rumors are swirling about a possible event for large token holders, supposedly being organized by Trump himself. These claims remain unverified and highly speculative.
Data from Dune analytics shows there are currently 636,000 TRUMP token holders on-chain, with just 12,285 wallets having more than $1,000 worth of the cryptocurrency.
-
Fashion6 месяцев ago
These \’90s fashion trends are making a comeback in 2017
-
Entertainment6 месяцев ago
The final 6 \’Game of Thrones\’ episodes might feel like a full season
-
Fashion6 месяцев ago
According to Dior Couture, this taboo fashion accessory is back
-
Entertainment6 месяцев ago
The old and New Edition cast comes together to perform
-
Sports6 месяцев ago
Phillies\’ Aaron Altherr makes mind-boggling barehanded play
-
Business6 месяцев ago
Uber and Lyft are finally available in all of New York State
-
Entertainment6 месяцев ago
Disney\’s live-action Aladdin finally finds its stars
-
Sports6 месяцев ago
Steph Curry finally got the contract he deserves from the Warriors