Uncategorized
Bitcoin, Ether, Dogecoin Surge Spurs $500M in Short Liquidations

Futures bets against higher crypto prices lost over $500 million in the past 24 hours as a surge higher, buoyed by a possible cooldown of China tariffs by the U.S., led to the largest short liquidations since October.
Bitcoin (BTC) rose from Tuesday’s low of $88,000 to above $93,500 in Asian morning hours, data shows, leading a jump in the broader market with ether (ETH), Cardano’s ADA and dogecoin (DOGE) up 14%. Solana’s SOL and XRP rose 7%, with all tokens in the top hundred by market cap in the green.
Meanwhile, Sui Network’s SUI, UniSwap’s UNI and Near Protocol’s showed strength with gains of as much as 18%. Memecoin mog (MOG) rocketed 30%, continued its tendency to act as a beta bet to ETH’s move.
Nearly $530 million in shorts, or bets on lower prices, booked losses amid a general unwinding of leveraged bets. Data shows that most short liquidations took place on Bybit at $234 million, followed by Binance at $100 million and Gate at nearly $70 million.
The largest single liquidation order happened on Binance, an ETH futures position that was worth over $4.5 million.
Liquidations occur when an exchange forcefully closes a trader’s leveraged position owing to a partial or total loss of the trader’s initial margin. It happens when a trader cannot meet the margin requirements for a leveraged position, that is, when they don’t have sufficient funds to keep the trade open.
An uptick in crypto markes came as Trump said he planned to be “very nice” to China in any trade talks and that tariffs will drop if the two countries can reach a deal — a sign that may temper an ongoing cautious sentiment among traders.
“Fears of an escalating trade war have abated as traders largely see the U.S. and China coming to a trade agreement in the coming weeks,” Jeff Mei, COO at BTSE, told CoinDesk in a Telegram message. “Whether or not this will be temporary remains to be seen.”
“But what the last couple of weeks has shown us is that the likelihood of rate cuts and a depreciating U.S. dollar are high, which explains bitcoin’s surge. If the U.S. dollar is weakening, there aren’t many other currencies to turn to as many other countries may also depreciate their currencies. This could pave the way for bitcoin to become a major store of value,” Mei added.

Bitcoin’s BTC price chart is echoing a bullish pattern that foreshadowed the late 2024 price surge from $70,000 to $100,000 amid mounting concerns over the sustainability of the U.S. debt.
The leading cryptocurrency by market value appears on track to confirm a «golden cross» in the coming days, according to charting platform TradingView. The pattern occurs when the 50-day simple moving average (SMA) of prices crosses above the 200-day SMA to suggest that the short-term trend is outperforming the broader trend, with the potential to evolve into a major bull run.
The moving average-based golden cross has a mixed record of predicting price trends. The impending one, however, is worth noting because it’s about to occur weeks after its ominous-sounding opposite, the death cross, trapped bears on the wrong side of the market.
A similar pattern unfolded from August through September 2024, setting the stage for a convincing move above $70,000 in early November. Prices eventually set a record high above $109K in January this year.
")
The chart on the left shows that BTC bottomed out at around $50,000 in early August last year as the 50-day SMA moved below the 200-day SMA to confirm the death cross.
In other words, the death cross was a bear trap, much like the one in early April this year. Prices turned higher in subsequent weeks, eventually beginning a new uptrend after the appearance of the golden cross in late October 2024.
The bullish sequence is being repeated since early April, and prices could begin the next leg higher following the confirmation of the golden cross in the coming days.
Past performance does not guarantee future results, and technical patterns do not always deliver as expected. That said, macro factors seem aligned with the bullish technical setup.
Moody’s amplifies U.S. debt concerns
On Friday, credit rating agency Moody’s downgraded the U.S. sovereign credit rating from the highest ”Aaa” to ”Aa1”, citing concerns over the increasing national debt, which has now reached $36 trillion.
The bond market has been pricing fiscal concerns for some time. Last week, CoinDesk detailed how persistent elevated Treasury yields reflected expectations for continued fiscal splurge and sovereign risk premium, both bullish for bitcoin.
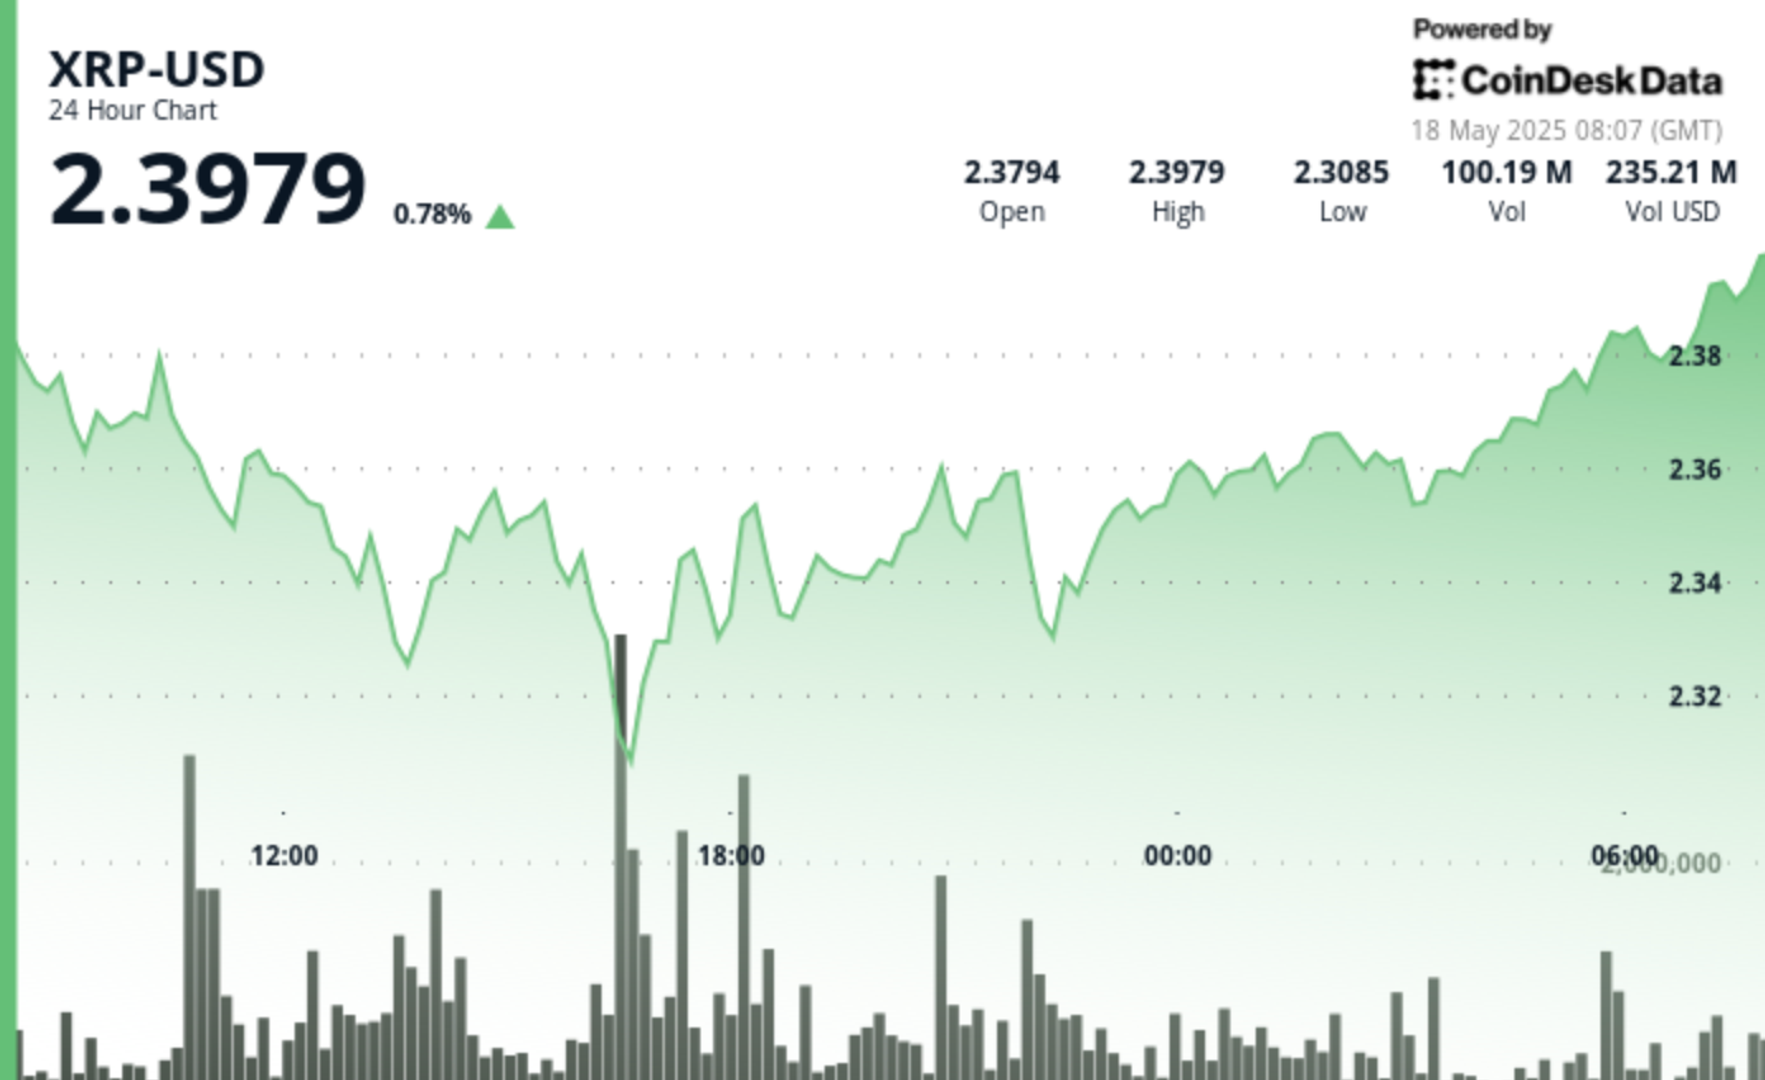
Global economic tensions and regulatory developments continue to influence XRP’s price action, with the digital asset showing remarkable resilience despite recent volatility.
After experiencing a significant dip to $2.307 on high volume, XRP has established an upward trajectory with a series of higher lows, suggesting continued momentum as it approaches resistance levels.
Technical indicators point to a potential bullish breakout, with multiple analysts highlighting critical support at $2.35-$2.40 that must hold for upward continuation.
Technical Analysis Highlights
- Price experienced a 3.76% range ($2.307-$2.396) over 24 hours with a sharp sell-off at 16:00 dropping to $2.307 on high volume (77.9M).
- Strong support emerged at $2.32 level with buyers stepping in during high-volume periods, particularly during the 13:00-14:00 recovery.
- Asset established upward trajectory, forming higher lows from the bottom, with resistance around $2.39 tested during 07:00 session.
- In the last hour, XRP climbed from $2.358 to $2.368, representing a 0.42% gain with notable volume spikes at 01:52 and 01:55.
- Price surged past resistance at $2.36 to reach $2.366, later establishing new local highs at $2.369 during 02:03 session on substantial volume (539,987).
- Currently maintaining strength above $2.368 support level with decreasing volatility suggesting potential continuation of upward trajectory.
Disclaimer: This article was generated with AI tools and reviewed by our editorial team to ensure accuracy and adherence to our standards. For more information, see CoinDesk’s full AI Policy. This article may include information from external sources, which are listed below when applicable.
External References
- «XRP price path to $3.40 remains intact — Here is why«, Cointelegraph, published May 16, 2025.
- «XRP Price Watch: Bulls Eye $2.60 as Long-Term Trend Holds«, Bitcoin.com News, published May 17, 2025.
- «XRP Price Explosion To $5.9: Current Consolidation Won’t Stop XRP From Growing«, NewsBTC, published May 17, 2025.
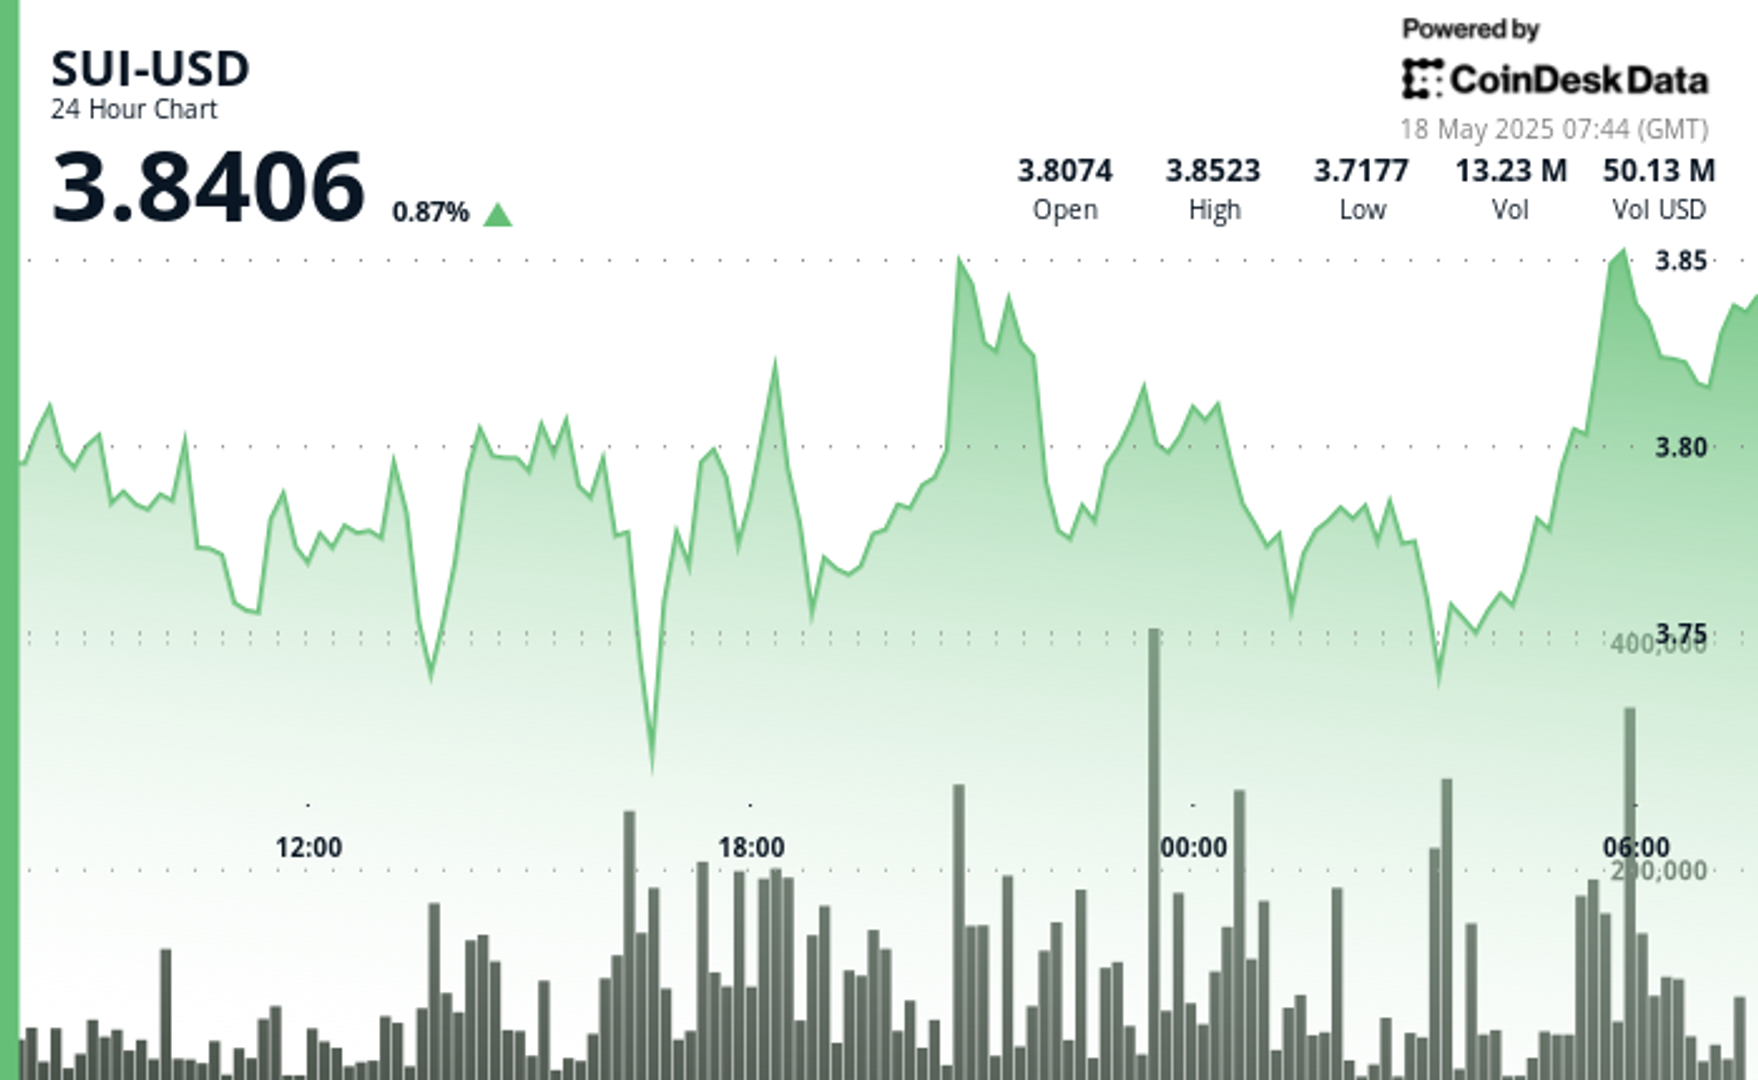
Global economic tensions and shifting trade policies continue to influence cryptocurrency markets, with SUI showing particular resilience.
The asset established a trading range of 4.46% between $3.70 and $3.86, finding strong volume support at the $3.755 level.
A notable bullish momentum emerged with price surging 1.9% on above-average volume, establishing resistance at $3.850.
The formation of higher lows throughout the latter part of the day suggests consolidation above the $3.775 support level.
Technical Analysis Highlights
- SUI established a 24-hour trading range of 0.165 (4.46%) between the low of 3.700 and high of 3.862.
- Strong volume support emerged at the 3.755 level during hours 17-18, with accumulation exceeding the 24-hour volume average by 45%.
- Notable bullish momentum occurred in the 20:00 hour with price surging 7.2 cents (1.9%) on above-average volume.
- Resistance established at 3.850 with higher lows forming throughout the latter part of the day.
- Decreasing volatility in the final hours suggests consolidation above the 3.775 support level.
- Significant buyer interest appeared between 01:27-01:30, forming a strong support zone at 3.756-3.760 with exceptionally high volume (over 300,000 units per minute).
- Decisive bullish reversal began at 01:42, establishing a series of higher lows and higher highs.
- Breakout above 3.780 occurred at 01:55, followed by consolidation near 3.785 with decreasing volume.
Disclaimer: This article was generated with AI tools and reviewed by our editorial team to ensure accuracy and adherence to our standards. For more information, see CoinDesk’s full AI Policy. This article may include information from external sources, which are listed below when applicable.
External References
- «Sui price up 5.16% intra-day: bullish structure remains strong«, crypto.news, published May 16, 2205.
- «SUI Set to Explode, But Don’t Sleep on XRP and Other Altcoins«, CoinPedia, May 16, 2025.


Bitcoin Nears Golden Cross Weeks After ‘Trapping Bears’ as U.S. Debt Concerns Mount

XRP Price Surges After V-Shaped Recovery, Targets $3.40

SUI Surges After Finding Strong Support at $3.75 Level
-

 Fashion7 месяцев ago
These \’90s fashion trends are making a comeback in 2017
-
Entertainment7 месяцев ago
The final 6 \’Game of Thrones\’ episodes might feel like a full season
-
Fashion7 месяцев ago
According to Dior Couture, this taboo fashion accessory is back
-
Entertainment7 месяцев ago
The old and New Edition cast comes together to perform
-
Business7 месяцев ago
Uber and Lyft are finally available in all of New York State
-
Sports7 месяцев ago
Phillies\’ Aaron Altherr makes mind-boggling barehanded play
-
Entertainment7 месяцев ago
Disney\’s live-action Aladdin finally finds its stars
-
Sports7 месяцев ago
Steph Curry finally got the contract he deserves from the Warriors