Uncategorized
Bitcoin Dips Below $98K While CoinDesk 20 Plunges 10% Amid Fed-Spurred Rout; SOL Surrenders Post-Election Rally
Crypto asset prices slid on Thursday, building on Wednesday’s market-wide selloff spurred by Federal Reserve Chair Jerome Powell disappointing investors with his comments on U.S. interest rate cut expectations for next year.
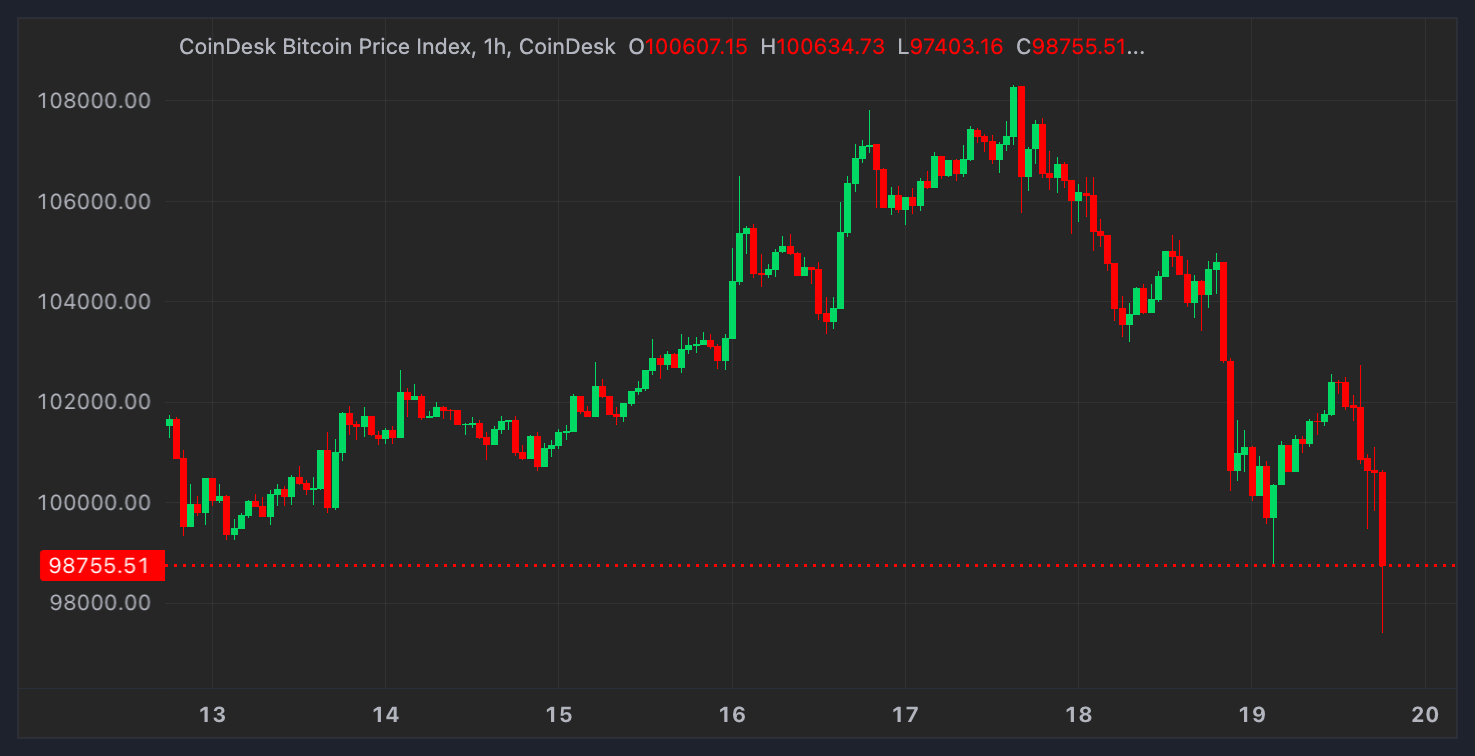
Bitcoin’s (BTC) attempt to bounce back above $100,000 quickly faded earlier during the day and slid to the low-$97,000s during the U.S. day. Recently, it modestly recovered to around $98,000, but was still down 4.8% over the past 24 hours.
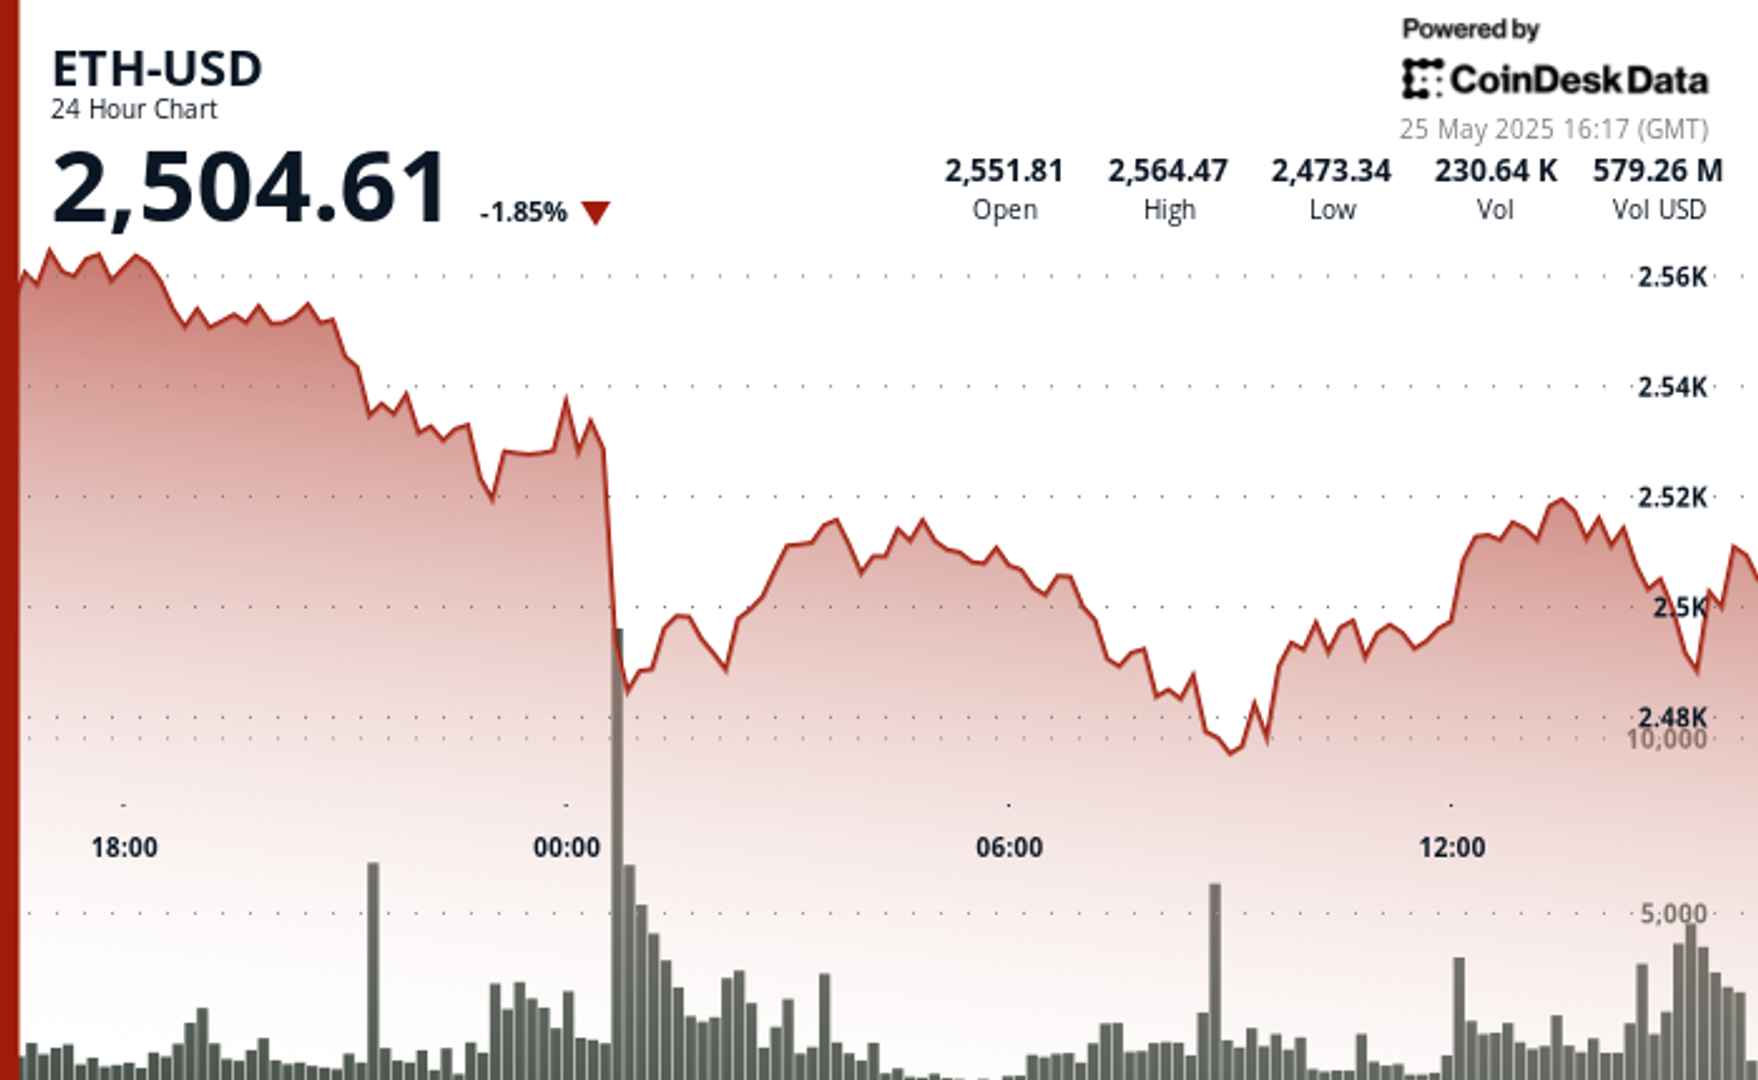
Altcoins fared much worse, with the broad-market CoinDesk 20 Index diving more than 10% during the same period. Ethereum’s ether (ETH) dipped 10.8% to below $3,500, while Cardano’s ADA, Chainlink’s LINK, Aptos’ APT, Avalanche’s AVAX and Dogecoin’s DOGE all suffered 15%-20% losses. Notably, SOL sank to its weakest price since Nov. 7 — nearly erasing its post-election rally following a 26% plunge from its record high hit less than a month ago.
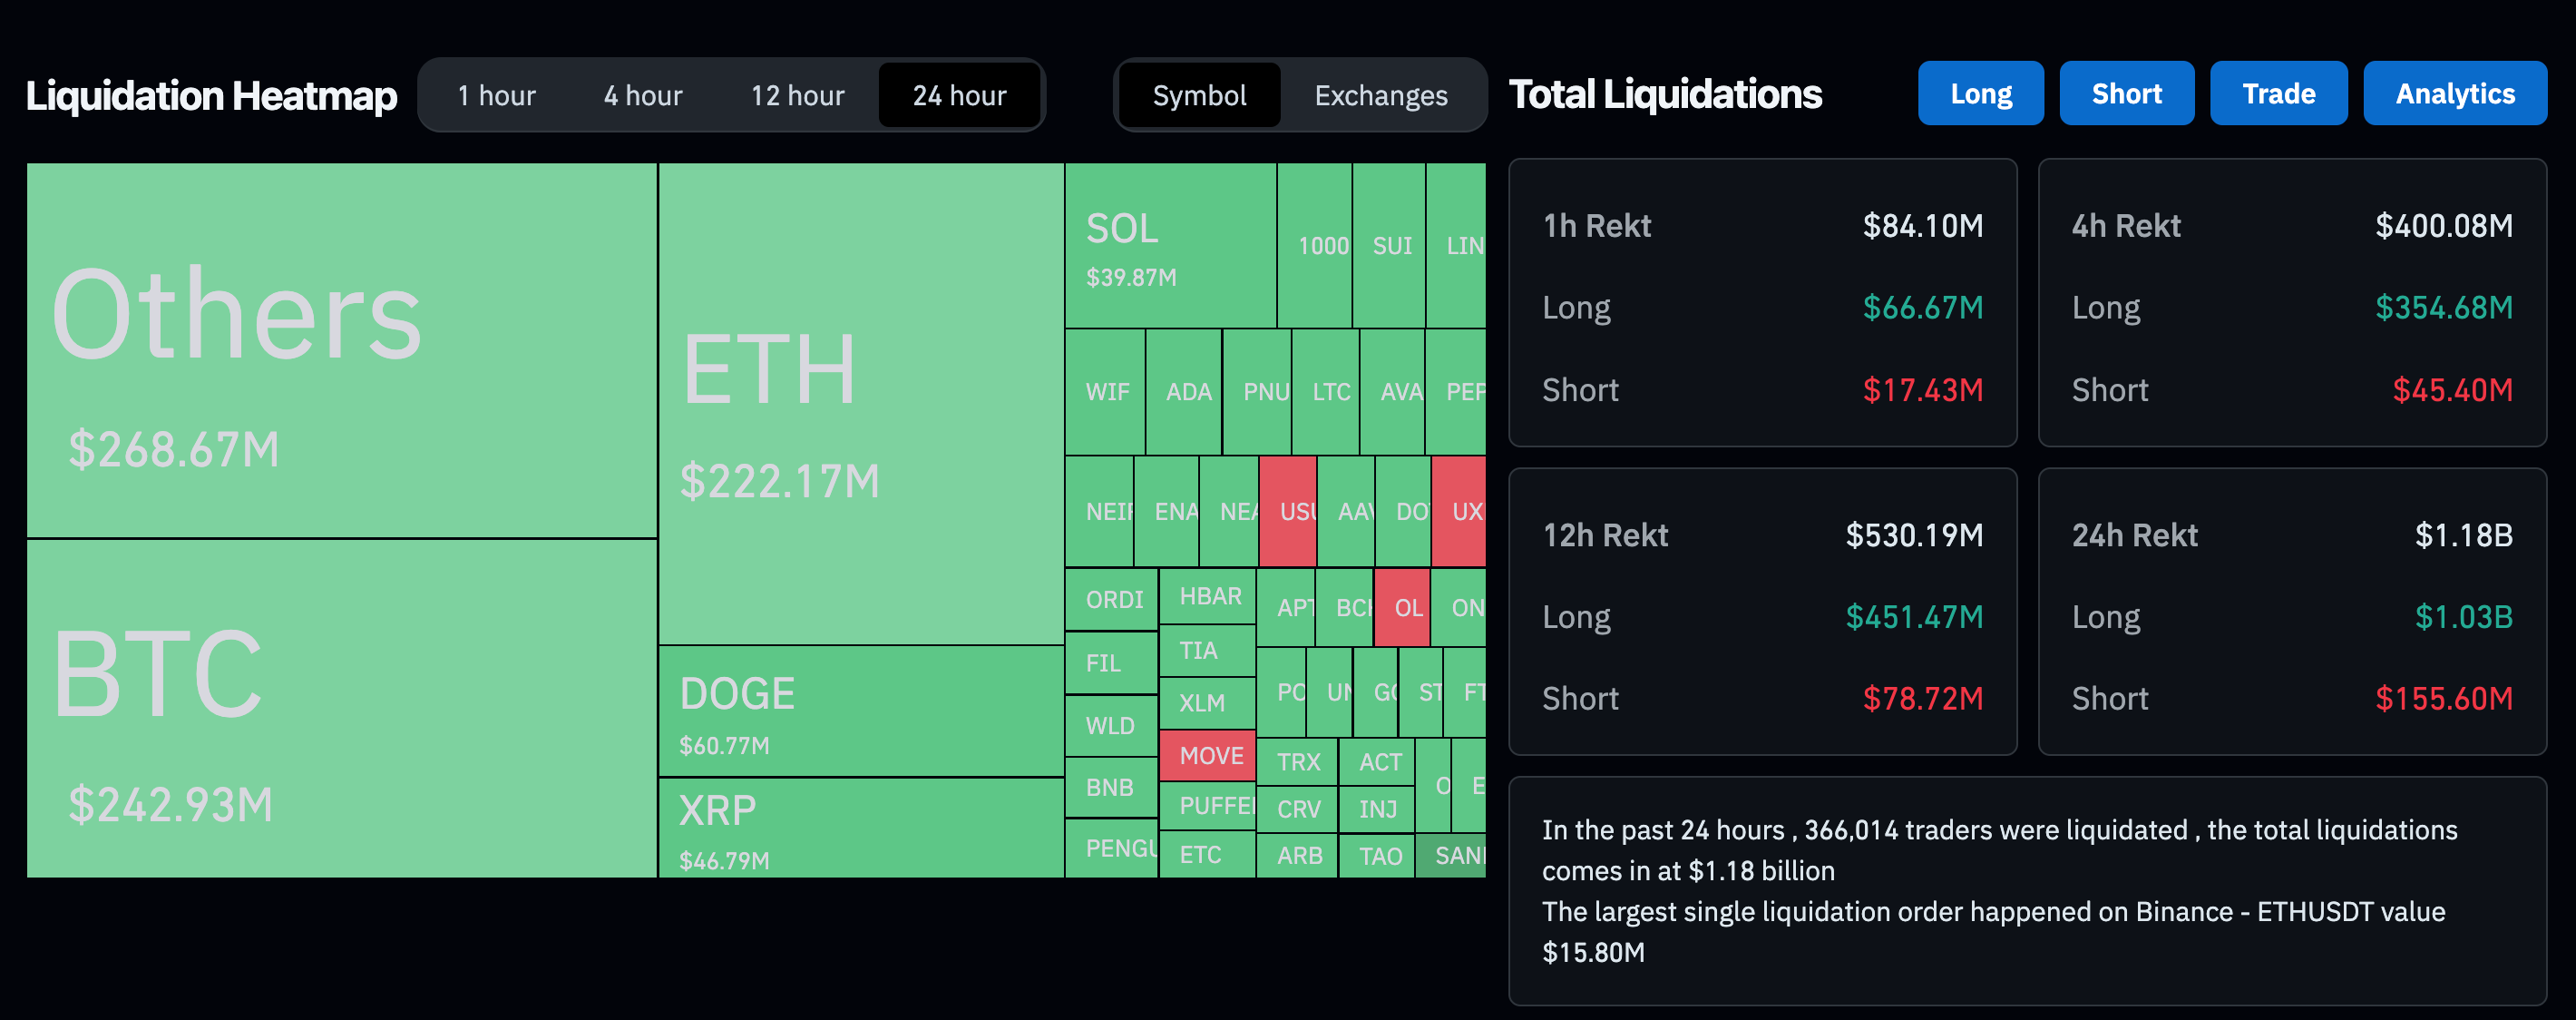
Over the past 24 hours — roughly since yesterday’s rate decision by Fed policy makers — nearly $1.2 billion worth of leveraged crypto derivatives trading positions have been liquidated across all assets, CoinGlass data shows. Over $1 billion of those were long positions, or bets that prices would rise.
In traditional markets, U.S. stock indexes slightly bounced from Wednesday’s lows but gave back part of the pre-market gains during the session. The S&P 500 and the tech-heavy Nasdaq were 0.5% up from the Wednesday close.
Crypto prices rose almost vertically since Donald Trump’s presidential election victory in early November, buoyed by hopes of pro-crypto policies from his incoming administration. Wednesday’s Fed projection of a slower pace of rate cuts for next year and Powell’s hawkish tone on rising inflation expectations caught many investors offside, triggering a broad-market selloff across crypto, equities and even gold.
The U.S. dollar index (DXY), a key strength gauge against a basket of foreign currencies, surged above 108, its strongest level since November 2022, while 10-year U.S. Treasury yields also rose sharply above 4.6%, the highest since May.
«The crypto market has already been on pins and needles around the possibility for a correction following the record run in the price of bitcoin through $100,000,» Joel Kruger, market strategist at LMAX Group, said in a Thursday note. «We got that catalyst from the world of traditional markets. … Fallout from Wednesday’s Fed decision was simply too much to ignore.»
«When you zoom out and consider the year-over-year growth, a pullback like this feels healthy,» Azeem Khan, co-founder and COO of layer-2 network Morph, said in an email shared with CoinDesk.
«It’s also worth noting that, historically, year-end selloffs in securities can occur as investors offset losses against gains to lower their tax liabilities,» Khan added. «While it’s hard to say how much of this is driving the current trend, it could be a contributing factor.»
Global economic tensions and trade disputes continue to influence cryptocurrency markets, with ETH showing resilience despite broader market uncertainty.
The second-largest cryptocurrency is currently navigating a critical technical zone between $2,500-$2,530, which analysts identify as immediate resistance that must be overcome for continued upward movement.
Institutional interest remains strong, with spot Ethereum ETFs recording consecutive days of positive inflows, signaling growing confidence from larger investors despite the recent volatility.
Technical Analysis Highlights
- 24-hour ETH price action revealed a substantial 3.5% range ($99.85).
- Sharp sell-off during midnight hour saw price plummet to $2,477.40, establishing a key support zone.
- Extraordinary volume (291,395 units, nearly 3x average) confirmed the significance of the support level.
- Buyers stepped in at the $2,467-$2,480 support band, confirmed by high-volume accumulation during the 08:00-09:00 period.
- Recent price action shows bullish momentum with ETH reclaiming the $2,515 level.
- Potential higher low pattern suggests the correction may have found its bottom.
- $2,520-$2,530 area remains the immediate resistance to overcome for continued upward movement.
- Significant bullish surge at 13:35 saw price jump from $2,515.85 to $2,521.79, accompanied by exceptional volume (5,839 units).
- Sharp reversal occurred at 14:00, with price dropping 5.07 points to $2,508.02 on heavy volume (4,043 units).
- Hourly range of 14.46 points ($2,508.02-$2,522.48) demonstrates market indecision.
External References
- «Ethereum Holds Above Key Prices – Data Points To $2,900 Level As Bullish Trigger«, NewsBTC, published May 24, 2025.
- «Ethereum Forms Inverse H&S – Bulls Eye Breakout Above $2,700 Level«, Bitcoinist, published May 25, 2025.
- «Ethereum Price Analysis: Is ETH Primed for a ‘Healthy’ Correction?«, CryptoPotato, published May 25, 2025.
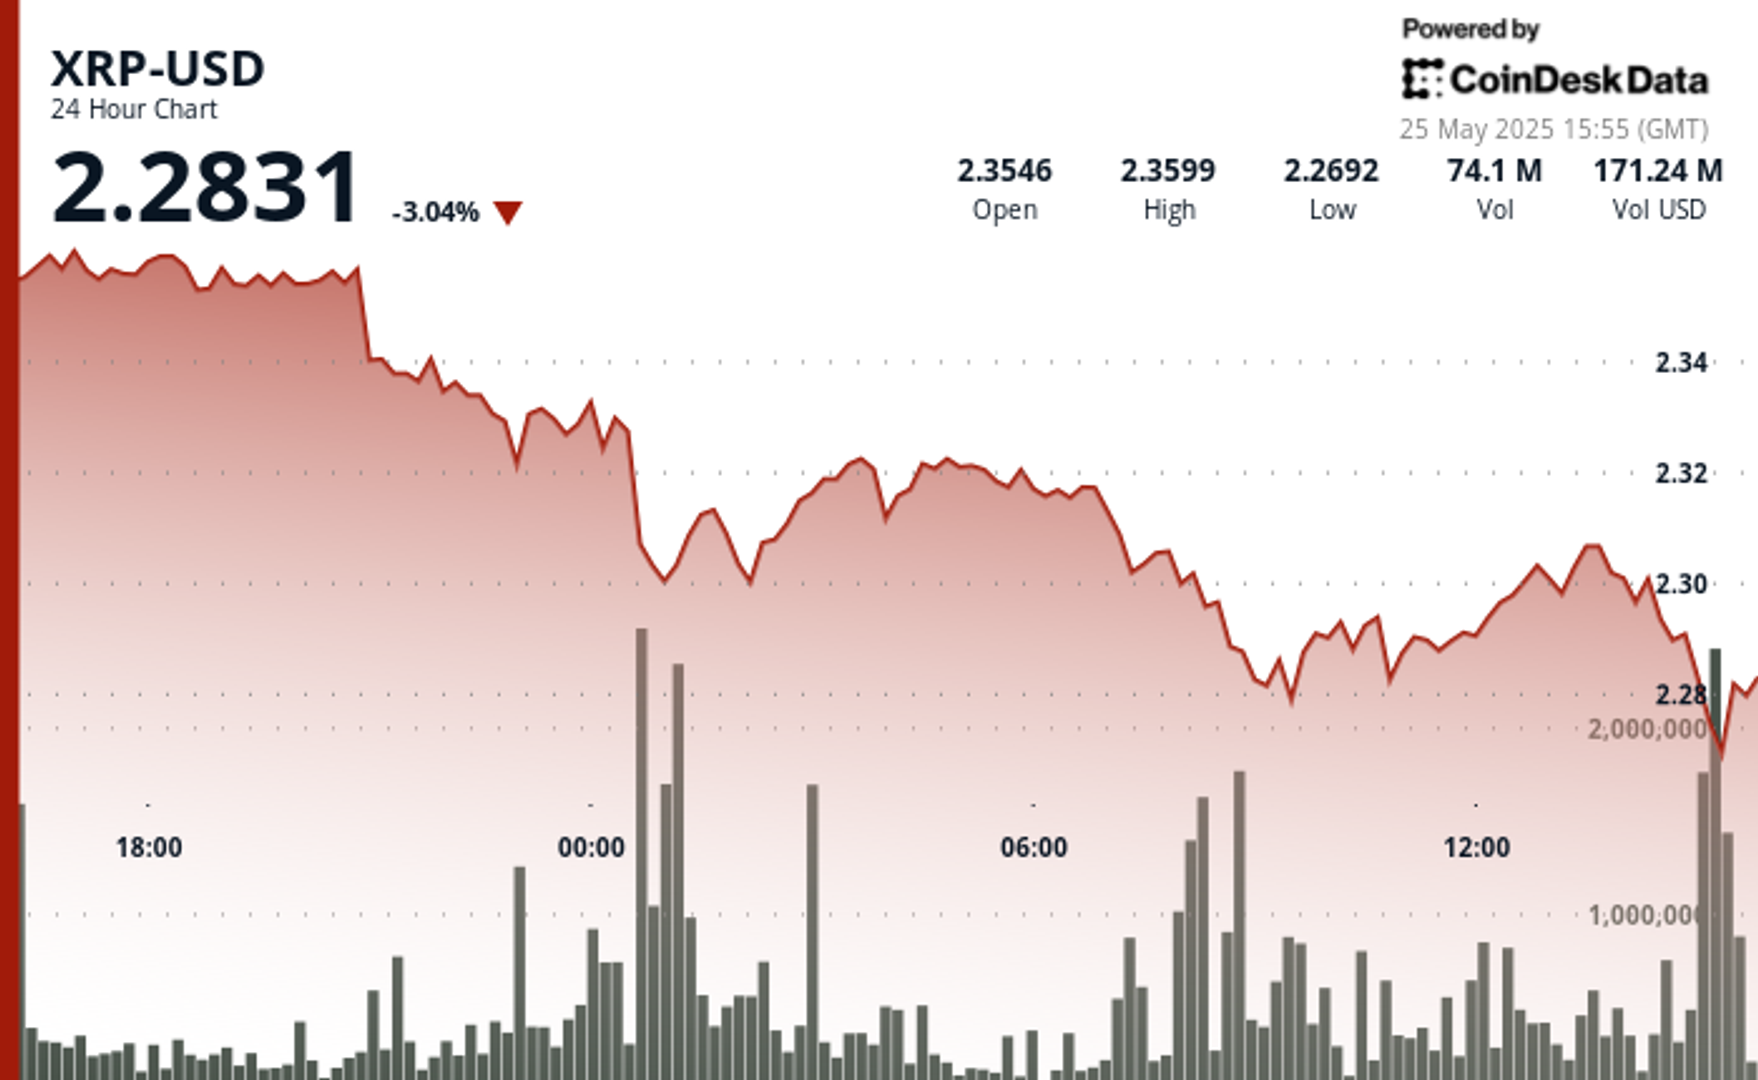
Global economic tensions are weighing heavily on cryptocurrency markets as XRP experiences a significant correction amid heavy selling pressure.
The recent announcement of potential 50% tariffs on European Union imports by the US government has triggered widespread market uncertainty, with XRP falling alongside most major cryptocurrencies despite Bitcoin recently reaching new all-time highs.
Technical analysts point to critical support at the $2.25-$2.26 range, with market watchers warning that a break below this level could trigger deeper corrections toward the $1.55-$1.90 zone.
Meanwhile, institutional interest remains strong with Volatility Shares launching an XRP futures ETF and leveraged ETF inflows surging despite the price dip, suggesting Wall Street continues accumulating positions during market weakness.
Technical Analysis Highlights
- XRP underwent a notable 3.46% correction over the 24-hour period, with price declining from $2.361 to $2.303, creating an overall range of $0.084 (3.57%).
- The most significant price action occurred during the midnight hour (00:00), when XRP plummeted to $2.297 on exceptionally high volume (37.1M), establishing a strong volume-based support zone.
- A secondary sell-off at 08:00 saw price touch the period low of $2.280 with the highest volume spike (39.9M), confirming a double-bottom formation.
- In the last hour, XRP experienced significant volatility with a recovery attempt following the earlier correction.
- After reaching a low of $2.297 at 13:11, price formed a base around $2.298 before staging a substantial rally beginning at 13:27, peaking at $2.307 at 13:36-13:39 with exceptionally high volume (627K-480K).
- This bullish momentum created a clear resistance zone at $2.307, which was tested multiple times.
- The final 15 minutes saw profit-taking pressure emerge, with price retracing to $2.300, establishing a short-term support level that aligns with the psychological $2.30 threshold.
External References
- «XRP Price Watch: Consolidation or Collapse? Market Holds Breath Near $2.35«, Bitcoin.com News, published May 24, 2025.
- «XRP Price Prediction For May 25«, CoinPedia, published May 25, 2025.
- «XRP Risks Fall To $1.55 If This Support Level Fails – Analyst«, NewsBTC, published May 25, 2025.
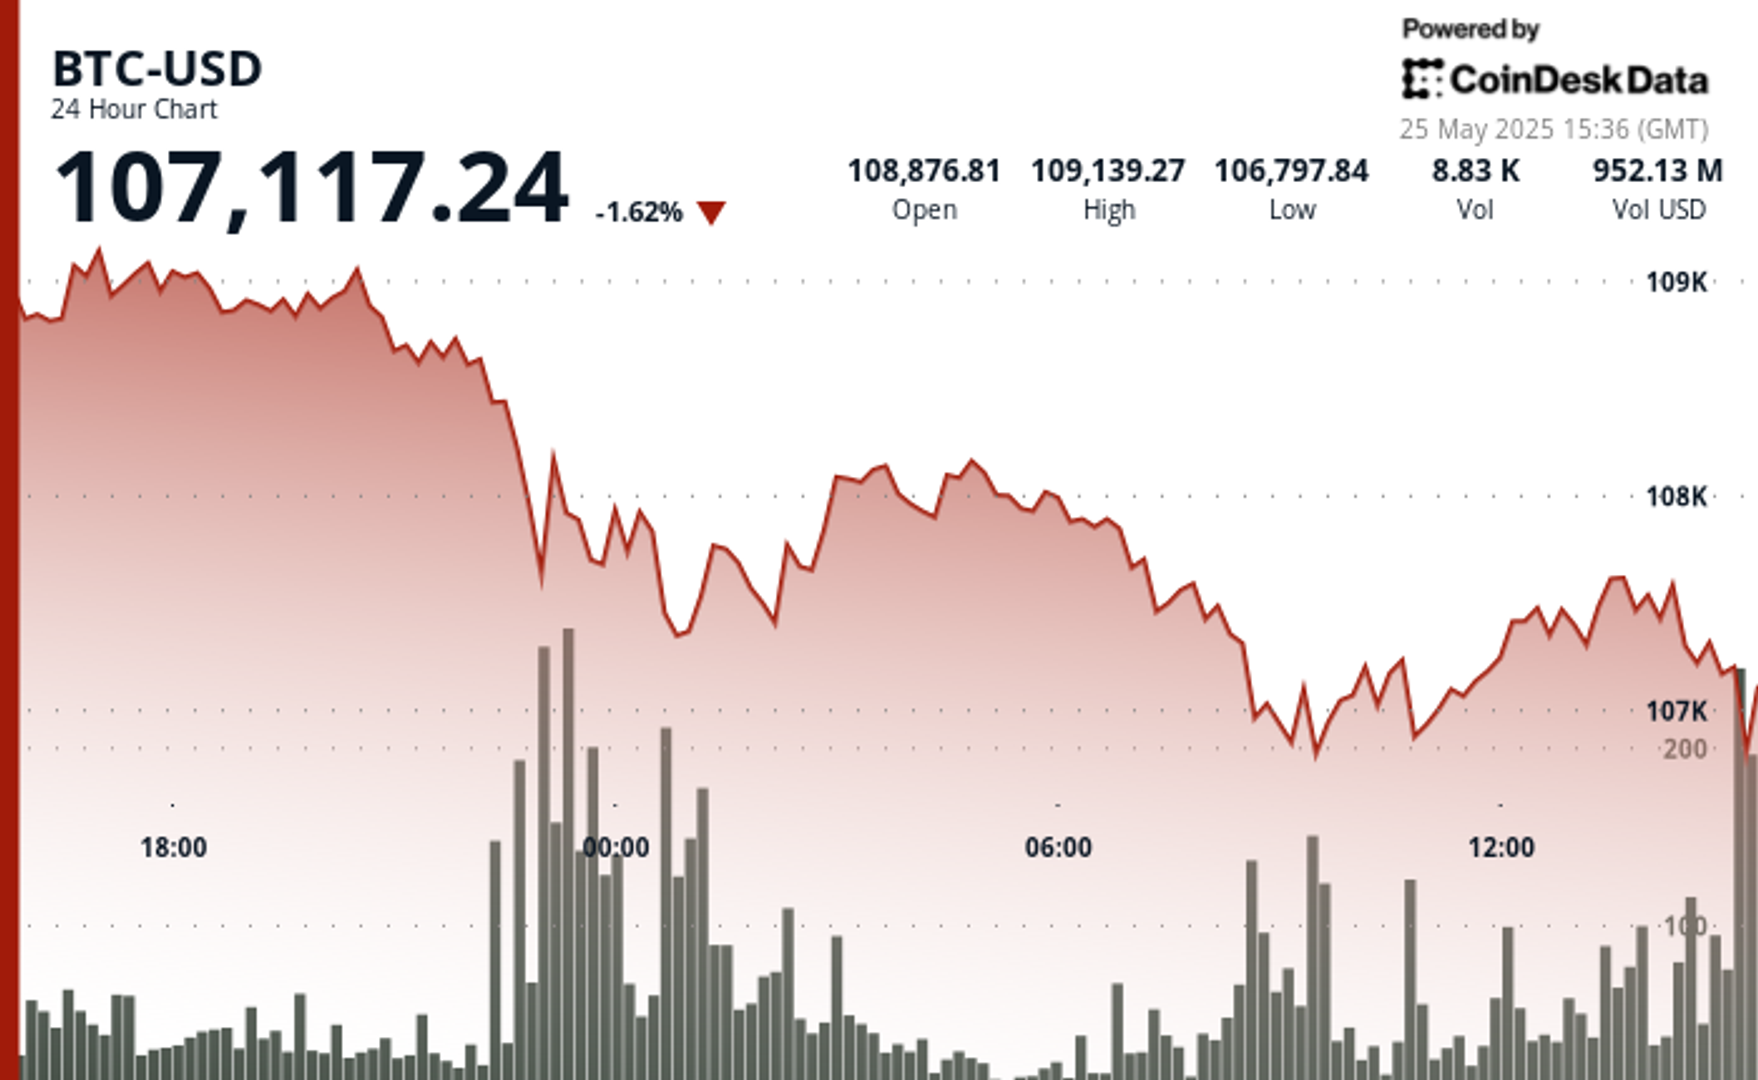
Bitcoin’s recent pullback has established strong volume-based resistance near $108,300, with support forming in the $106,700-$107,000 zone.
The correction accelerated with a notable price surge from $107,373 to $107,671 between 13:06-13:36, followed by a sharp reversal.
Technical analysis suggests Bitcoin is now trading within a compression zone, trapped between two major fair value gaps that will determine the upcoming market direction.
If bulls reclaim the $109K to $110K area, price could push toward resistance beyond $112K, while a break below $107,000 might test liquidity around $106K.
Technical Analysis Breakdown
- The decline accelerated during the 22:00-23:00 hour on May 24th with exceptionally high volume (16,335 BTC), establishing a strong volume-based resistance near $108,300.
- Support has formed in the $106,700-$107,000 zone where buyers emerged during the 09:00-10:00 period on May 25th, though recovery attempts have been modest with price consolidating around $107,500.
- The overall technical structure suggests a short-term bearish trend with potential for further consolidation before directional clarity emerges.
- Bitcoin experienced significant volatility with a notable price surge from $107,373 to $107,671 between 13:06-13:36, followed by a sharp reversal that saw prices decline to $107,393 by 14:00.
- The most substantial price movement occurred during the 13:35 minute candle where BTC jumped nearly $150 with exceptionally high volume (148.76 BTC), establishing temporary resistance around $107,630.
- Support formed near $107,400 where buyers emerged during the final minutes of the period, though the overall technical structure suggests continued consolidation within the broader correction from the $109,239 high.
External References
- «Bitcoin Price Prediction for May 25: Will Bulls Defend $108K or Is a Deeper Drop Ahead?«, Coin Edition, published May 24, 2025.
- «Why is Bitcoin Price Dropping Now? Will BTC Price Go Down to $100K?«, CoinPedia, published May 24, 2025.
- «Bitcoin Price Analysis: BTC Displays Signs of Weakness Following New All-Time High«, CryptoPotato, published May 25, 2025.


Ethereum Surges After Holding $2,477, Fueled by Very Heavy Trading Volume

XRP Plunges Below $2.30 Amid Heavy Selling Pressure

Bitcoin Drops Below $107.5K as Trump Tariff Threat Triggers Crypto Sell-Off
-

 Fashion7 месяцев ago
These \’90s fashion trends are making a comeback in 2017
-
Entertainment7 месяцев ago
The final 6 \’Game of Thrones\’ episodes might feel like a full season
-
Fashion7 месяцев ago
According to Dior Couture, this taboo fashion accessory is back
-
Entertainment7 месяцев ago
The old and New Edition cast comes together to perform
-
Business7 месяцев ago
Uber and Lyft are finally available in all of New York State
-
Sports7 месяцев ago
Phillies\’ Aaron Altherr makes mind-boggling barehanded play
-
Sports7 месяцев ago
Steph Curry finally got the contract he deserves from the Warriors
-
Entertainment7 месяцев ago
\’Better Call Saul\’ has been renewed for a fourth season