Uncategorized
Bitcoin Analysts Optimistic as China Surprisingly Fixes Yuan Beyond 7.2 Level

China eased its grip on the yuan (CNY) on Tuesday, allowing it to depreciate beyond a key level, likely in response to President Donald Trump’s aggressive tariffs.
Crypto analysts anticipate that the yuan’s depreciation could favor bitcoin (BTC), drawing parallels to similar events from a decade ago.
Early Tuesday, the People’s Bank of China (PBOC) set the so-called daily yuan fix at 7.2038 per dollar on Tuesday, the weakest since September. The yuan isn’t a free float currency like the USD, euro and other G-7 nations and is allowed to trade in a range of 2% on either side of the daily fix announced at 9:15 a.m. Beijing time.
The 7.2 level has been considered a «harder line in the sand» for the central bank for years. The USD/CNY pair has traded above the said level a few times since 2022 but never established a foothold.
That could change with the PBOC explicitly setting the daily mid-point beyond the 7.2 level. In other words, the move signals a shift to managed depreciation of the yuan, which will help keep China’s exports cheaper and competitive, potentially offsetting the negative impact of Trump’s tariffs on Chinese goods.
Capital flight into BTC?
The managed depreciation could also trigger capital flight from China, which may find home in cryptocurrencies, according to analysts.
«The U.S. is now pursuing full-scale economic pressure on China, which may be forced to respond with quantitative easing and a currency devaluation. If so—and if China permits capital flight—Bitcoin could surge, much like it did in 2015,» Markus Thielen, founder of 10x Research, said in a note to clients Monday.
The Chinese central bank devalued the yuan by 1.9% on Aug. 11, 2015, the most significant single-day depreciation in over two decades, sending shockwaves across global financial markets. Bitcoin initially fell over 20% with the U.S. stocks but quickly turned higher and surged nearly 60% in the following four months.
Ben Zhou, CEO and founder of the crypto exchange Bybit, voiced a similar opinion on X, saying yuan depreciation tends to bode well for bitcoin.
«China will try to lower RMB to counter the tariff, historically, whenever RMB drops, a lot of Chinese capital flow into BTC, bullish for BTC,» Zhou said on X.
Regulatory hurdles
While history tells us to expect a bullish BTC reaction to yuan depreciation, note that over the years, China has become anti-crypto, citing financial stability risks and has some of the world’s harshest regulations.
A new regulation announced earlier this year requires banks to monitor and report suspicious international transactions, including those involving cryptocurrency. Banks are obligated to investigate and report any risky crypto trades, which may result in financial restrictions and potential blacklisting for the trader.
The stringent stance means local traders may have a tough time diversifying into bitcoin and other digital assets in the event of a sustained yuan depreciation.
«Since August 2024, the Supreme People’s Court has significantly increased the legal risks for individuals using cryptocurrencies in connection with money laundering, which could easily extend to cases of capital flight,» Thielen said. «This presents a major deterrent, despite rising economic uncertainty.»

Crypto trading firm Keyrock said it’s expanding into asset and wealth management by acquiring Turing Capital, a Luxembourg-registered alternative investment fund manager.
The deal, announced on Tuesday, marks the launch of Keyrock’s Asset and Wealth Management division, a new business unit dedicated to institutional clients and private investors.
Keyrock, founded in Brussels, Belgium and best known for its work in market making, options and OTC trading, said it will fold Turing Capital’s investment strategies and Luxembourg fund management structure into its wider platform. The division will be led by Turing Capital co-founder Jorge Schnura, who joins Keyrock’s executive committee as president of the unit.
The company said the expansion will allow it to provide services across the full lifecycle of digital assets, from liquidity provision to long-term investment strategies. «In the near future, all assets will live onchain,» Schnura said, noting that the merger positions the group to capture opportunities as traditional financial products migrate to blockchain rails.
Keyrock has also applied for regulatory approval under the EU’s crypto framework MiCA through a filing with Liechtenstein’s financial regulator. If approved, the firm plans to offer portfolio management and advisory services, aiming to compete directly with traditional asset managers as well as crypto-native players.
«Today’s launch sets the stage for our longer-term ambition: bringing asset management on-chain in a way that truly meets institutional standards,» Keyrock CSO Juan David Mendieta said in a statement.
Read more: Stablecoin Payments Projected to Top $1T Annually by 2030, Market Maker Keyrock Says
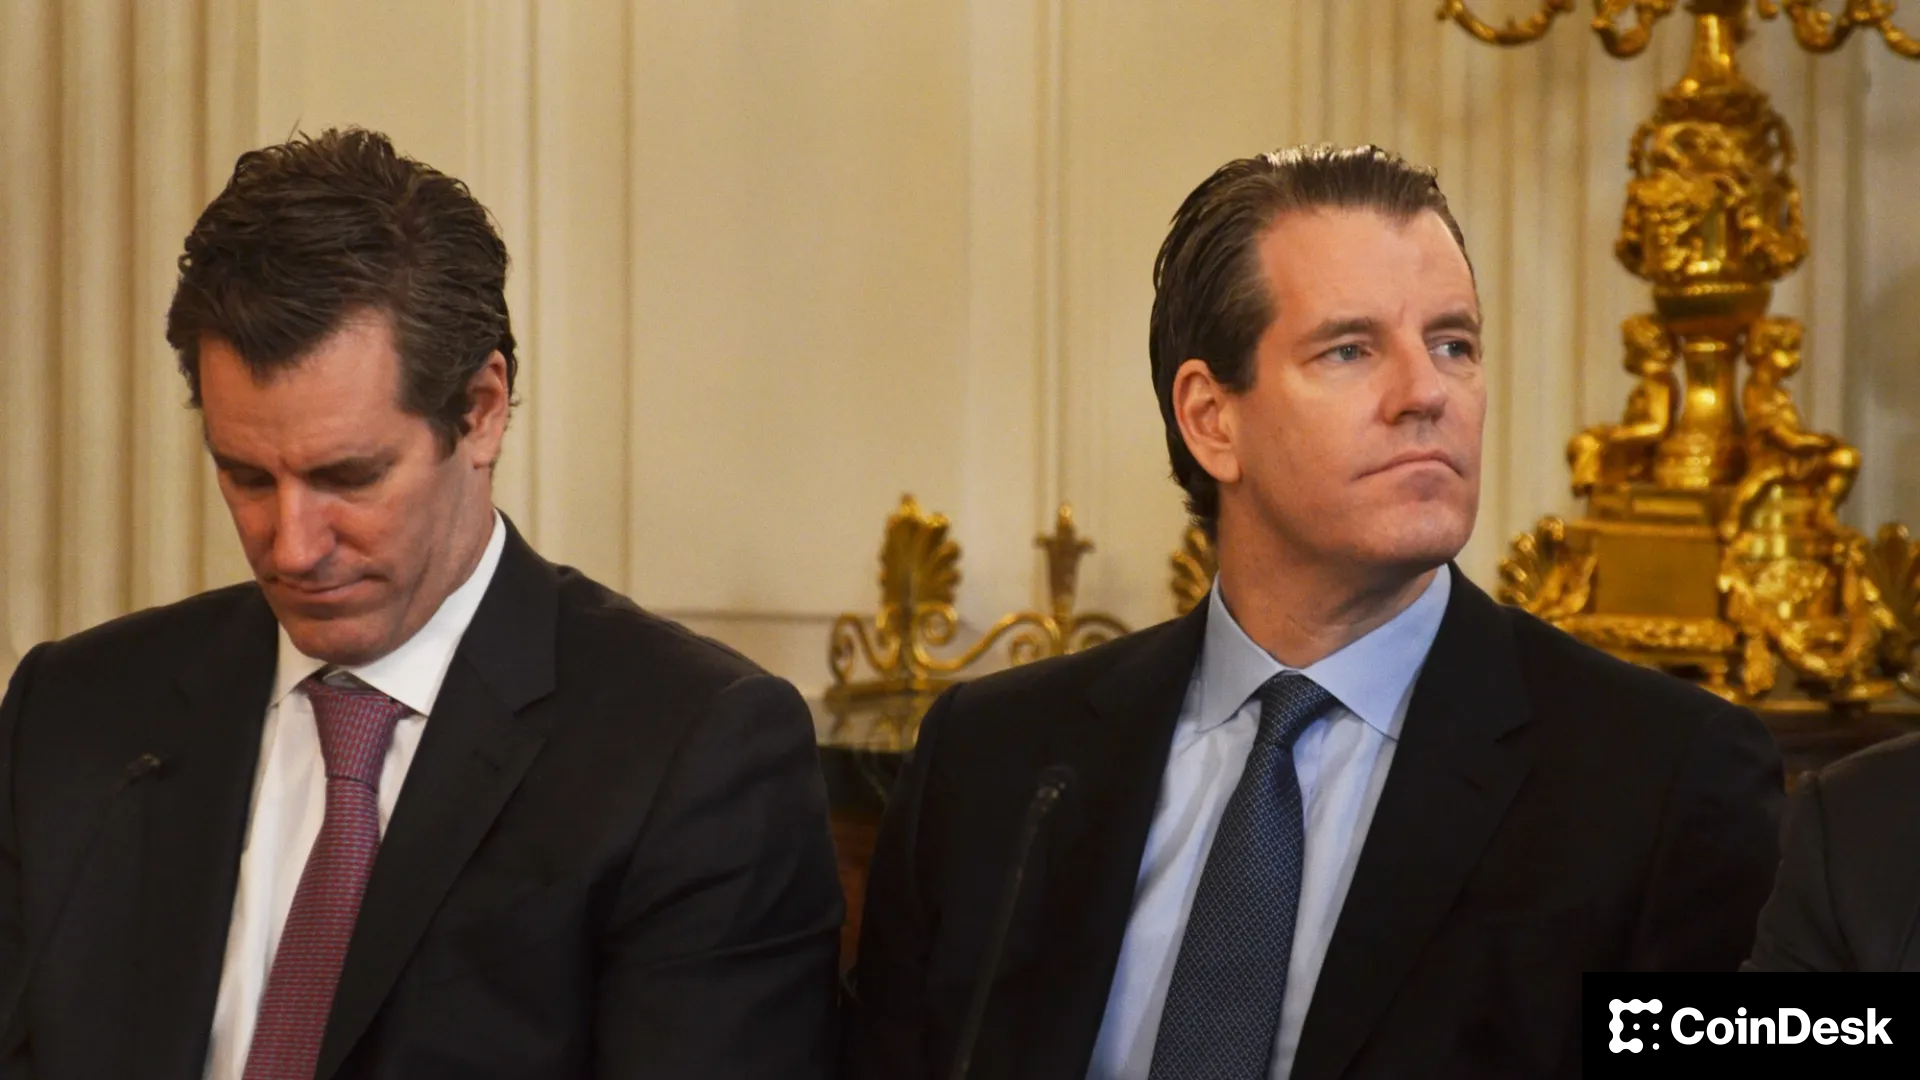
Gemini Space Station (GEMI), the crypto exchange founded by Cameron and Tyler Winklevoss, has seen its shares tumble by more than 20% since listing on the Nasdaq last Friday.
The stock is down around 6% on Tuesday, trading at $30.42, and has dropped nearly 24% over the past week. The sharp decline follows an initial surge after the company raised $425 million in its IPO, pricing shares at $28 and valuing the firm at $3.3 billion before trading began.
On its first day, GEMI spiked to $45.89 before closing at $32 — a 14% premium to its offer price. But since hitting that high, shares have plunged more than 34%, erasing most of the early enthusiasm from public market investors.
The broader crypto equity market has remained more stable. Coinbase (COIN), the largest U.S. crypto exchange, is flat over the past week. Robinhood (HOOD), which derives part of its revenue from crypto, is down 3%. Token issuer Circle (CRCL), on the other hand, is up 13% over the same period.
Part of the pressure on Gemini’s stock may stem from its financials. The company posted a $283 million net loss in the first half of 2025, following a $159 million loss in all of 2024. Despite raising fresh capital, the numbers suggest the business is still far from turning a profit.
Compass Point analyst Ed Engel noted that GEMI is currently trading at 26 times its annualized first-half revenue. That multiple — often used to gauge whether a stock is expensive — means investors are paying 26 dollars for every dollar the company is expected to generate in sales this year. For a loss-making company in a volatile sector, that’s a steep price, and could be fueling investor skepticism.


Crypto Trading Firm Keyrock Buys Luxembourg’s Turing Capital in Asset Management Push
Crypto Trading Firm Keyrock Buys Luxembourg’s Turing Capital in Asset Management Push

Gemini Shares Slide 6%, Extending Post-IPO Slump to 24%
-

 Business11 месяцев ago
3 Ways to make your business presentation more relatable
-
Fashion11 месяцев ago
According to Dior Couture, this taboo fashion accessory is back
-
Entertainment11 месяцев ago
10 Artists who retired from music and made a comeback
-
Entertainment11 месяцев ago
\’Better Call Saul\’ has been renewed for a fourth season
-
Entertainment11 месяцев ago
New Season 8 Walking Dead trailer flashes forward in time
-
Business11 месяцев ago
15 Habits that could be hurting your business relationships
-
Entertainment11 месяцев ago
Meet Superman\’s grandfather in new trailer for Krypton
-
Entertainment11 месяцев ago
Disney\’s live-action Aladdin finally finds its stars