Uncategorized
Altcoins, NFTs Lure Risk-On Buyers: Crypto Daybook Americas

By Francisco Rodrigues (All times ET unless indicated otherwise)
The government’s announcements of trade agreements with countries including Indonesia and Japan “raised hopes that the U.S. might be about to reach deals with other countries that avoid the higher tariffs,” Deutsche Bank analysts wrote in a note reported on by Reuters.
That optimism has allowed investors to move into riskier assets, with equity index futures rising and the price of gold, a risk-off haven, falling. The dynamic is echoed in crypto markets. The CoinDesk 20 (CD20) index of the largest, most liquid assets has dropped 0.5% in the past 24 hours, while the CoinDesk Memecoin (CDMEME) index is up 2%.
Bitcoin (BTC) is down around 0.4% at $118,000 and spot ETFs offering exposure to the cryptocurrency ended a 12-day, $6.6 billion inflow streak on Monday, registering nearly $200 million in outflows over the past two days.
But bitcoin doesn’t tell the full story, as allocations have been floating to riskier bets.
“We’re seeing a clear shift in momentum across the crypto market, with strong capital rotation away from bitcoin and into altcoins,» Bitpanda deputy CEO Lukas Enzerdorfer-Konrad said in an emailed statement. “The broad ecosystem is clearly healthy and there is more for investors to explore than just BTC and ETH.”
Ether ETFs, benefiting from the GENIUS Act’s passage into law, are still drawing in capital. Week-to-date, they’ve brought in $830 million, bringing the month’s total net inflow to $4.1 billion, according to SoSoValue data.
Risk appetite also revived the NFT space, which has seen a massive 35.6% rise in its market capitalization this week. The increase comes after a prolonged bear market that saw sales volumes plateau and several NFT marketplaces shut down or pivot to token trading.
“Whether this marks the start of a sustained altcoin season remains to be seen, but the current rally shows just how quickly sentiment can turn once confidence and liquidity are in place,” Konrad added. Stay alert!
What to Watch
- Crypto
- July 23, 1 p.m.: Hedera (HBAR) mainnet upgrades to version 0.63. The process is expected to take about 40 minutes, during which network users may experience temporary disruptions.
- July 23-24: The Root Network (ROOT) mainnet will undergo a technical upgrade (v11.79.0) affecting NFT ownership data storage, requiring some 24 hours of downtime for NFT-related operations like minting, bridging, transferring and marketplace activity to support improved performance and scalability for large collections.
- July 31, 12 p.m.: A live webinar featuring Bitwise CIO Matt Hougan and Bitzenship founder Aleesandro Palombo discussing bitcoin’s potential as the next global reserve currency amid de-dollarization trends. Registration link.
- Macro
- July 24, 8:15 a.m.: The European Central Bank will announce its interest rate decision, with President Christine Lagarde’s press conference following 30 minutes later. Livestream link.
- Main Refinancing Operations (MRO) rate Est. 1.9% vs. Prev. 2.15%
- July 24, 9:45 a.m.: S&P Global releases (Flash) July U.S. data on manufacturing and services activity.
- Composite PMI Prev. 52.9
- Manufacturing PMI Est. 52.5 vs. Prev. 52.9
- Services PMI Est. 53 vs. Prev. 52.9
- July 25, 8:30 a.m.: The U.S. Census Bureau releases June manufactured durable goods orders data.
- Durable Goods Orders MoM Est. -10.5% vs. Prev. 16.4%
- Durable Goods Orders Ex Defense MoM Prev. 15.5%
- Durable Goods Orders Ex Transportation MoM Est. 0.1% vs. Prev. 0.5%
- Aug. 1, 12:01 a.m.: New U.S. tariffs take effect on imports from trading partners that failed to reach agreements by the July 9 deadline. These increased duties could range from 10% to as high as 70%, impacting a wide range of goods.
- July 24, 8:15 a.m.: The European Central Bank will announce its interest rate decision, with President Christine Lagarde’s press conference following 30 minutes later. Livestream link.
- Earnings (Estimates based on FactSet data)
Token Events
- Governance votes & calls
- Rocket Pool DAO is voting to finalize Saturn 1’s implementation. Approval by a 75% supermajority will ratify key protocol changes, including new transaction designs and a potential revenue share to the pDAO treasury. Voting ends July 24.
- Lido DAO is voting on a new system that lets validator exits be triggered automatically through the execution layer, not just by node operators. It includes tools for different authorization pathways, emergency controls and built‑in limits to prevent misuse. The update is expected to make staking more decentralized, secure and responsive. Voting ends July 28.
- GnosisDAO is voting on a proposal to provide $30 million per year, paid quarterly, to Gnosis Ltd., now a non-profit, to sustain its ~150‑person team building critical Gnosis Chain infrastructure, products (like Gnosis Pay and Circles), business development and operations. Voting ends July 28.
- Aavegotchi DAO is voting on funding three new features for the official decentralized application: a Wearable Lendings UI, Gotchis Batch Lending and a BRS Optimizer. Voting ends July 29.
- NEAR Protocol is voting on potentially reducing NEAR’s inflation rate from 5% to 2.5%. Two-thirds of validators must approval the proposal for it to pass, and if so it could be implemented by late Q3. Voting ends Aug. 1.
- July 29, 10 a.m.: Ether.fi to host a bi-quarterly analyst call.
- Unlocks
- July 25: Venom (VENOM) to unlock 2.84% of its circulating supply worth $12.48 million.
- July 31: Optimism (OP) to unlock 1.79% of its circulating supply worth $23.45 million.
- Aug. 1: Sui (SUI) to unlock 1.27% of its circulating supply worth $169.38 million.
- Aug. 2: Ethena (ENA) to unlock 0.64% of its circulating supply worth $19.75 million.
- Aug. 9: Immutable (IMX) to unlock 1.3% of its circulating supply worth $15.11 million.
- Aug. 12: Aptos (APT) to unlock 1.73% of its circulating supply worth $59.26 million.
- Token Launches
- July 23: Binance Alpha to feature Alliance Games (COA).
Conferences
The CoinDesk Policy & Regulation conference (formerly known as State of Crypto) is a one-day boutique event held in Washington on Sept. 10 that allows general counsels, compliance officers and regulatory executives to meet with public officials responsible for crypto legislation and regulatory oversight. Space is limited.
- July 24: Decasonic’s Web3 Investor Day 2025 (Chicago)
- July 25: Blockchain Summit Global (Montevideo, Uruguay)
- July 28-29: TWS Conference 2025 (Singapore)
- Aug. 6-7: Blockchain.Rio 2025 (Rio de Janeiro, Brazil)
- Aug. 6-10: Rare EVO (Las Vegas)
- Aug. 7-8: bitcoin++ (Riga, Latvia)
- Aug. 9-10: Baltic Honeybadger 2025 (Riga, Latvia)
- Aug. 9-10: Conviction 2025 (Ho Chi Minh City, Vietnam)
Token Talk
By Shaurya Malwa
- LetsBonk, the BONK-backed Solana token launchpad, is dominating the on-chain memecoin economy, posting record highs across every major growth metric for a second straight week.
- Over 150,000 tokens debuted through the platform last week, a 14% jump from the previous week, including a single-day record of 26,600 tokens on July 18.
- LetsBonk’s share of the token launch market has surged to 64%, up from just 5% a month ago, while Pump.fun’s share has collapsed from over 90% to just 24%.
- Token graduations (i.e., tokens meeting liquidity thresholds to list on Raydium) also hit all-time highs, with 282 graduating on July 16, up 20% week-over-week.
- LetsBonk now holds 79% market share in graduations, vs. Pump.fun’s 18%.
- Trading volume flipped too: On Friday, LetsBonk recorded $179 million in daily volume compared with Pump.fun’s $52 million — a sharp reversal from a month ago, when Pump.fun consistently averaged 15x more volume.
- Fee generation has followed suit, with LetsBonk pulling in more than $8 million in protocol fees last week, while Pump.fun managed roughly half that.
- This shift in memecoin infrastructure dominance marks a critical rotation in Solana culture and liquidity flows, with BONK now at the center of both speculation and tooling.
Derivatives Positioning
- Ether perpetual futures are hinting at an influx of shorts as open interest (OI) has increased by 1.2% this week alongside a 2.42% price drop. BTC perp futures OI remains steady for a second week.
- Perp funding rates for the top 10 tokens, excluding SOL, are hovering near an annualized 10%, pointing to moderate bullish positioning. SOL’s rate is relatively elevated at 18%.
- SUI futures open interest is holding near an all-time high of $1.2 billion, the sixth-largest level in the crypto market. Fartcoin futures boast the 10th largest OI.
- Front-end BTC options risk reversals show renewed put bias, reflecting downside concerns amid persistent bull failure at the $120K mark. ETH risk reversals continue to show call bias across all tenors.
- Block flows on OTC network Paradigm featured a long put trade in the Aug. 8 expiry call at the $110K strike and demand for higher strike ether calls.
Market Movements
- BTC is down 1.32% from 4 p.m. ET Tuesday at $118,142.74 (24hrs: -0.79%)
- ETH is down 1.15% at $3,664.03 (24hrs: -1.2%)
- CoinDesk 20 is down 1.66% at 4,087.94 (24hrs: -0.65%)
- Ether CESR Composite Staking Rate is down 7 bps at 2.97%
- BTC funding rate is at 0.0033% (3.6135% annualized) on KuCoin

- DXY is unchanged at 97.42
- Gold futures are down 0.21% at $3,436.40
- Silver futures are up 0.48% at $39.74
- Nikkei 225 closed up 3.51% at 41,171.32
- Hang Seng closed up 1.62% at 25,538.07
- FTSE is up 0.53% at 9,071.43
- Euro Stoxx 50 is up 1.37% at 5,363.09
- DJIA closed on Tuesday up 0.40% at 44,502.44
- S&P 500 closed unchanged at 6,309.62
- Nasdaq Composite closed down 0.39% at 20,892.69
- S&P/TSX Composite closed up 0.17% at 27,364.43
- S&P 40 Latin America closed up 0.1% at 2,590.91
- U.S. 10-Year Treasury rate is up 4 bps at 4.376%
- E-mini S&P 500 futures are up 0.35% at 6,369.00
- E-mini Nasdaq-100 futures are up 0.15% at 23,262.25
- E-mini Dow Jones Industrial Average Index are up 0.47% at 44,920.00
Bitcoin Stats
- BTC Dominance: 61.09 (0.24%)
- Ether to bitcoin ratio: 0.03095 (-0.96%)
- Hashrate (seven-day moving average): 898 EH/s
- Hashprice (spot): $59.42
- Total Fees: 4.34 BTC / $515,576
- CME Futures Open Interest: 153,785 BTC
- BTC priced in gold: 34.5 oz
- BTC vs gold market cap: 9.77%
Technical Analysis
")
- Bitcoin-holder Strategy’s (MSTR) share price has dropped over 6% this week, invalidating the bullish inverse head-and-shoulders breakout seen early this month.
- The failed breakout could invite chart-driven sellers, potentially yielding deeper price losses.
- The last week’s high of $456 is the new level to beat for the bulls.
Crypto Equities
- Strategy (MSTR): closed on Tuesday at $426.4 (+0.03%), -0.19% at $425.58 in pre-market
- Coinbase Global (COIN): closed at $404.44 (-2.22%), +0.39% at $406.01
- Circle (CRCL): closed at $198.31 (-8.23%), +2.11% at $202.49
- Galaxy Digital (GLXY): closed at $29.11 (+6.05%), +2.54% at $29.85
- MARA Holdings (MARA): closed at $19.88 (+5.58%), -1.11% at $19.66
- Riot Platforms (RIOT): closed at $14.27 (+1.78%), -0.49% at $14.20
- Core Scientific (CORZ): closed at $13.48 (+1.58%), +0.45% at $13.54
- CleanSpark (CLSK): closed at $12.84 (+3.63%), -0.62% at $12.76
- CoinShares Valkyrie Bitcoin Miners ETF (WGMI): closed at $27.56 (+4.08%)
- Semler Scientific (SMLR): closed at $40.19 (+1.31%), +1.24% at $40.69
- Exodus Movement (EXOD): closed at $34.73 (+3.33%), unchanged in pre-market
- SharpLink Gaming (SBET): closed at $27.4 (+8.54%), -4.42% at $26.19
ETF Flows
Spot BTC ETFs
- Daily net flows: -$68 million
- Cumulative net flows: $54.53 billion
- Total BTC holdings ~1.3 million
Spot ETH ETFs
- Daily net flows: $533.8 million
- Cumulative net flows: $8.34 billion
- Total ETH holdings ~5.12 million
Source: Farside Investors
Overnight Flows

Chart of the Day
")
- The Buffett indicator, named after Warren Buffett, is the ratio of total U.S. stock market value divided by the country’s gross domestic product (GDP).
- The ratio has risen to new lifetime highs above 200%, which is about 1.8 standard deviations above the historical trendline, suggesting that the stock market is overvalued relative to GDP.
- That level suggests scope for downside volatility in stocks, which could feed into cryptocurrencies and other risk assets.
While You Were Sleeping
- U.S. and Japan Reach Trade Deal (The New York Times): Trump said Japan will invest $550 billion in the U.S. and ease trade barriers, with both sides accepting 15% auto tariffs. The move lifted Japanese stocks Wednesday.
- Goldman Sachs Sees Trump’s Baseline Tariff Rate Rising to 15% (Bloomberg): The bank expects Trump-era tariffs to lift core inflation by 1.7% over three years and cut 2025 GDP by 1 point, with additional sectoral levies expected to deepen the impact.
- Disguised Unemployment in Blockchain? Data Shows Only 12% of Ethereum, 25% of Solana Protocols Have Revenue (CoinDesk): DeFiLlama data shows the vast majority of Ethereum and Solana protocols failed to generate revenue recently. Inactive smart contracts increase storage burdens, security risks and economic inefficiency, hindering the overall user experience.
- Dogecoin Could Soon Verify ZK Proofs Natively, Thanks to DogeOS Push (CoinDesk): Dogecoin could support zero-knowledge proofs under a new proposal, paving the way for smart contracts and other advanced features without sacrificing the blockchain’s speed or lightweight design.
- Backed Finance’s Tokenized Stocks Product Volume Jumps to $300M (CoinDesk): xStocks are on-chain tokens representing shares in U.S. firms, fully backed by the underlying equities, but critics say they are like Europe’s contracts for difference and lack real ownership and weekend liquidity.
- Chinese and EU Leaders Are About to Meet — but the U.S. Is Complicating Things (CNBC): The U.S. is pressuring Brussels to harden its stance on China while simultaneously threatening 30% tariffs on EU exports, leaving the bloc diplomatically squeezed ahead of high-stakes Thursday talks with Beijing.
In the Ether


Wall Street giant Citigroup (C) has launched new ether (ETH) forecasts, calling for $4,300 by year-end, which would be a decline from the current $4,515.
That’s the base case though. The bank’s full assessment is wide enough to drive an army regiment through, with the bull case being $6,400 and the bear case $2,200.
The bank analysts said network activity remains the key driver of ether’s value, but much of the recent growth has been on layer-2s, where value “pass-through” to Ethereum’s base layer is unclear.
Citi assumes just 30% of layer-2 activity contributes to ether’s valuation, putting current prices above its activity-based model, likely due to strong inflows and excitement around tokenization and stablecoins.
A layer 1 network is the base layer, or the underlying infrastructure of a blockchain. Layer 2 refers to a set of off-chain systems or separate blockchains built on top of layer 1s.
Exchange-traded fund (ETF) flows, though smaller than bitcoin’s (BTC), have a bigger price impact per dollar, but Citi expects them to remain limited given ether’s smaller market cap and lower visibility with new investors.
Macro factors are seen adding only modest support. With equities already near the bank’s S&P 500 6,600 target, the analysts do not expect major upside from risk assets.
Read more: Ether Bigger Beneficiary of Digital Asset Treasuries Than Bitcoin or Solana: StanChart

Stellar’s XLM token endured sharp swings over the past 24 hours, tumbling 3% as institutional selling pressure dominated order books. The asset declined from $0.39 to $0.38 between September 14 at 15:00 and September 15 at 14:00, with trading volumes peaking at 101.32 million—nearly triple its 24-hour average. The heaviest liquidation struck during the morning hours of September 15, when XLM collapsed from $0.395 to $0.376 within two hours, establishing $0.395 as firm resistance while tentative support formed near $0.375.
Despite the broader downtrend, intraday action highlighted moments of resilience. From 13:15 to 14:14 on September 15, XLM staged a brief recovery, jumping from $0.378 to a session high of $0.383 before closing the hour at $0.380. Trading volume surged above 10 million units during this window, with 3.45 million changing hands in a single minute as bulls attempted to push past resistance. While sellers capped momentum, the consolidation zone around $0.380–$0.381 now represents a potential support base.
Market dynamics suggest distribution patterns consistent with institutional profit-taking. The persistent supply overhead has reinforced resistance at $0.395, where repeated rally attempts have failed, while the emergence of support near $0.375 reflects opportunistic buying during liquidation waves. For traders, the $0.375–$0.395 band has become the key battleground that will define near-term direction.
")
Technical Indicators
- XLM retreated 3% from $0.39 to $0.38 during the previous 24-hours from 14 September 15:00 to 15 September 14:00.
- Trading volume peaked at 101.32 million during the 08:00 hour, nearly triple the 24-hour average of 24.47 million.
- Strong resistance established around $0.395 level during morning selloff.
- Key support emerged near $0.375 where buying interest materialized.
- Price range of $0.019 representing 5% volatility between peak and trough.
- Recovery attempts reached $0.383 by 13:00 before encountering selling pressure.
- Consolidation pattern formed around $0.380-$0.381 zone suggesting new support level.
Disclaimer: Parts of this article were generated with the assistance from AI tools and reviewed by our editorial team to ensure accuracy and adherence to our standards. For more information, see CoinDesk’s full AI Policy.
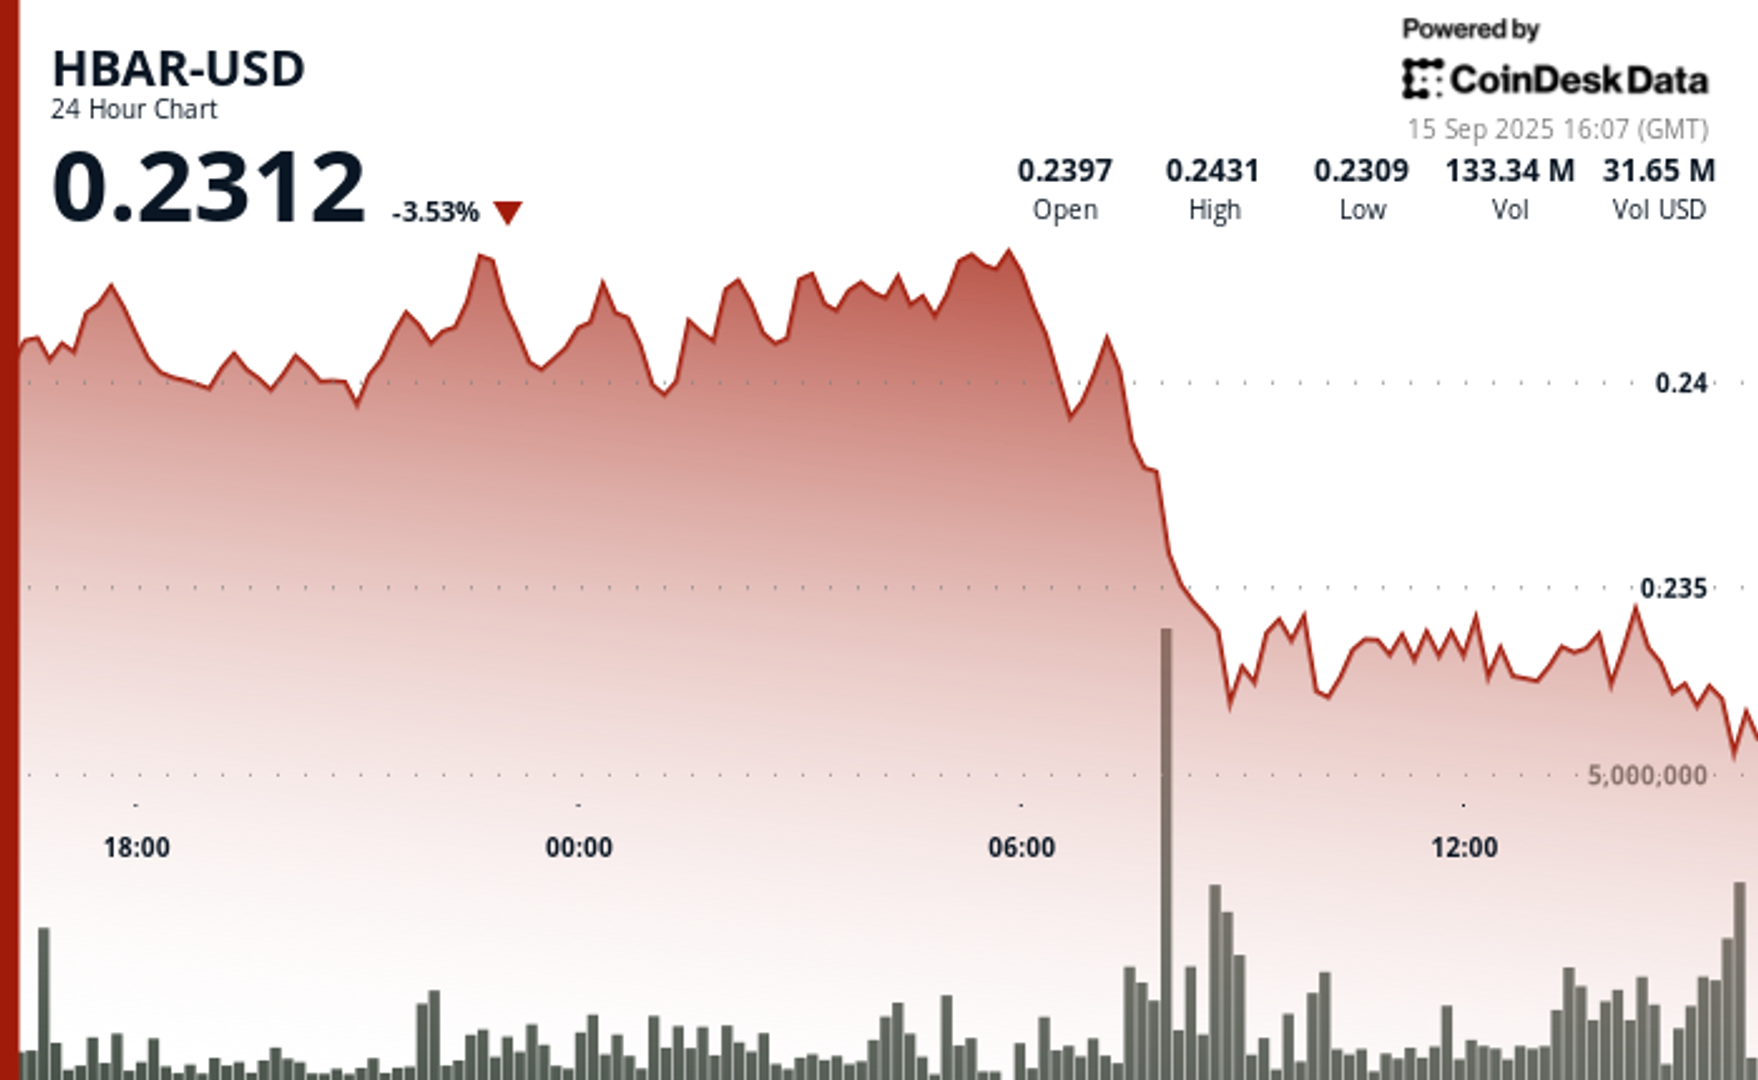
Hedera Hashgraph’s HBAR token endured steep losses over a volatile 24-hour window between September 14 and 15, falling 5% from $0.24 to $0.23. The token’s trading range expanded by $0.01 — a move often linked to outsized institutional activity — as heavy corporate selling overwhelmed support levels. The sharpest move came between 07:00 and 08:00 UTC on September 15, when concentrated liquidation drove prices lower after days of resistance around $0.24.
Institutional trading volumes surged during the session, with more than 126 million tokens changing hands on the morning of September 15 — nearly three times the norm for corporate flows. Market participants attributed the spike to portfolio rebalancing by large stakeholders, with enterprise adoption jitters and mounting regulatory scrutiny providing the backdrop for the selloff.
Recovery efforts briefly emerged during the final hour of trading, when corporate buyers tested the $0.24 level before retreating. Between 13:32 and 13:35 UTC, one accumulation push saw 2.47 million tokens deployed in an effort to establish a price floor. Still, buying momentum ultimately faltered, with HBAR settling back into support at $0.23.
The turbulence underscores the token’s vulnerability to institutional distribution events. Analysts point to the failed breakout above $0.24 as confirmation of fresh resistance, with $0.23 now serving as the critical support zone. The surge in volume suggests major corporate participants are repositioning ahead of regulatory shifts, leaving HBAR’s near-term outlook dependent on whether enterprise buyers can mount sustained defenses above key support.
")
Technical Indicators Summary
- Corporate resistance levels crystallized at $0.24 where institutional selling pressure consistently overwhelmed enterprise buying interest across multiple trading sessions.
- Institutional support structures emerged around $0.23 levels where corporate buying programs have systematically absorbed selling pressure from retail and smaller institutional participants.
- The unprecedented trading volume surge to 126.38 million tokens during the 08:00 morning session reflects enterprise-scale distribution strategies that overwhelmed corporate demand across major trading platforms.
- Subsequent institutional momentum proved unsustainable as systematic selling pressure resumed between 13:37-13:44, driving corporate participants back toward $0.23 support zones with sustained volumes exceeding 1 million tokens, indicating ongoing institutional distribution.
- Final trading periods exhibited diminishing corporate activity with zero recorded volume between 13:13-14:14, suggesting institutional participants adopted defensive positioning strategies as HBAR consolidated at $0.23 amid enterprise uncertainty.
Disclaimer: Parts of this article were generated with the assistance from AI tools and reviewed by our editorial team to ensure accuracy and adherence to our standards. For more information, see CoinDesk’s full AI Policy.


Wall Street Bank Citigroup Sees Ether Falling to $4,300 by Year-End

XLM Sees Heavy Volatility as Institutional Selling Weighs on Price

HBAR Tumbles 5% as Institutional Investors Trigger Mass Selloff
-

 Business11 месяцев ago
3 Ways to make your business presentation more relatable
-
Fashion11 месяцев ago
According to Dior Couture, this taboo fashion accessory is back
-
Entertainment11 месяцев ago
10 Artists who retired from music and made a comeback
-
Entertainment11 месяцев ago
\’Better Call Saul\’ has been renewed for a fourth season
-
Entertainment11 месяцев ago
New Season 8 Walking Dead trailer flashes forward in time
-
Business11 месяцев ago
15 Habits that could be hurting your business relationships
-
Entertainment11 месяцев ago
Meet Superman\’s grandfather in new trailer for Krypton
-
Entertainment11 месяцев ago
Disney\’s live-action Aladdin finally finds its stars