Uncategorized
A Bullish XRP Flag Emerges as $5 Call Options Heat Up: Godbole

XRP is hot and it is probably setting up for another big rally. That’s the message from the price chart and options market.
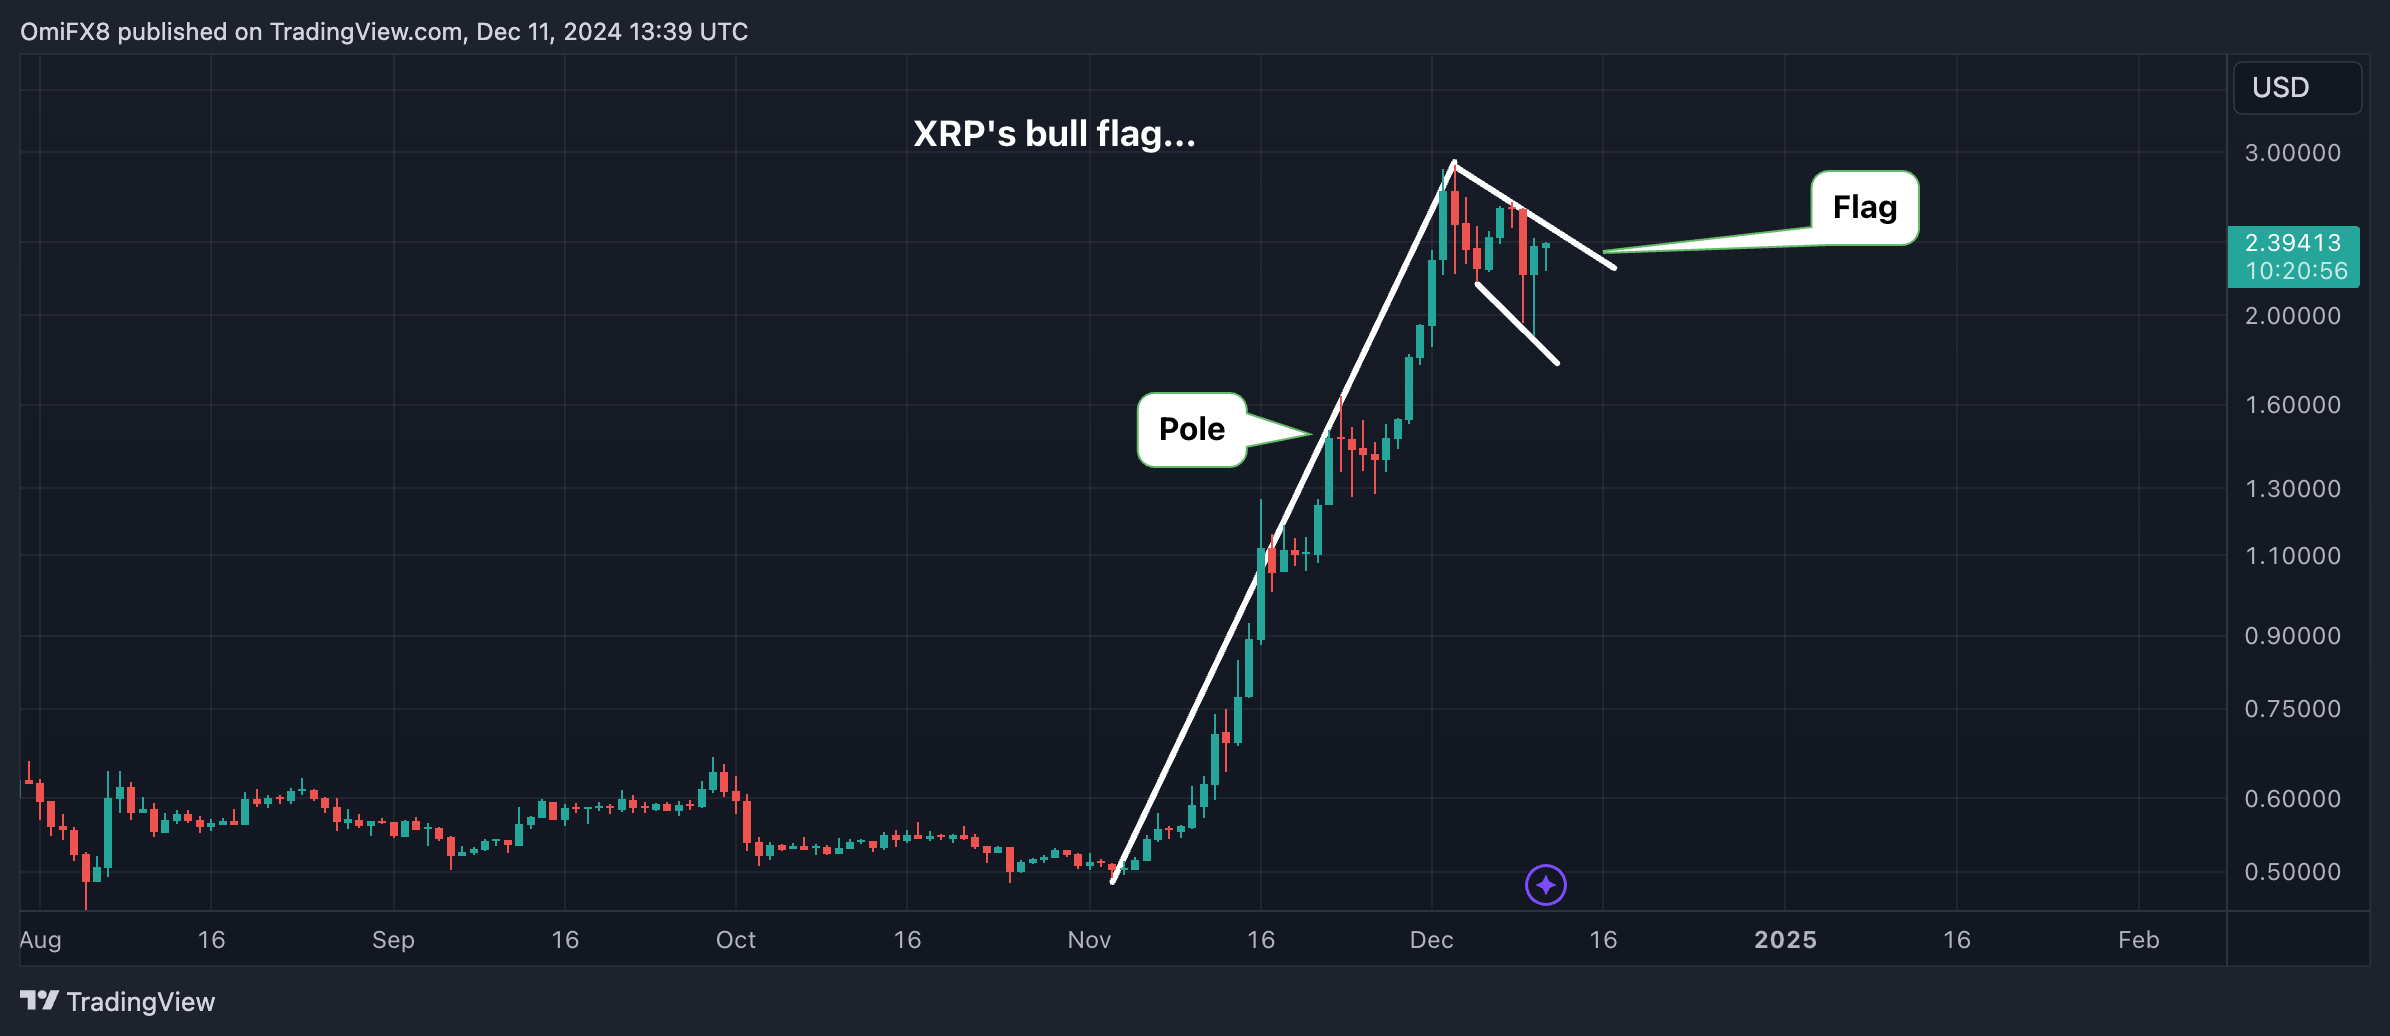
The payments-focused cryptocurrency is down 10% this week. The pullback, however, has taken the shape of a bull flag. This technical analysis pattern usually slopes in the opposite direction of the preceding sharp uptrend and, more often than not, recharges bulls’ engines for further gains.
«The breakout should be expected in the direction of the preceding trend, provided it is steep and sharp,» Charles Kirkpatrick, a chartered market technician and the president of Kirkpatrick & Company, Inc, said in the book «Technical Analysis, the Complete Resource For Finance Market Technicians.»
«Flags preceded by a rise of 90% or more have almost zero failure rate and an average return of 69%,» Kirkpatrick added.
XRP is forming a bull flag after a rally of nearly 500% to $2.9 in the four weeks to Dec. 3. An eventual breakout would mean scope for a rally to $5. The potential level is identified by adding the magnitude of the preceding uptrend to the breakout point, currently at around $2.5 in what is known as a measured height method in technical analysis terminology.
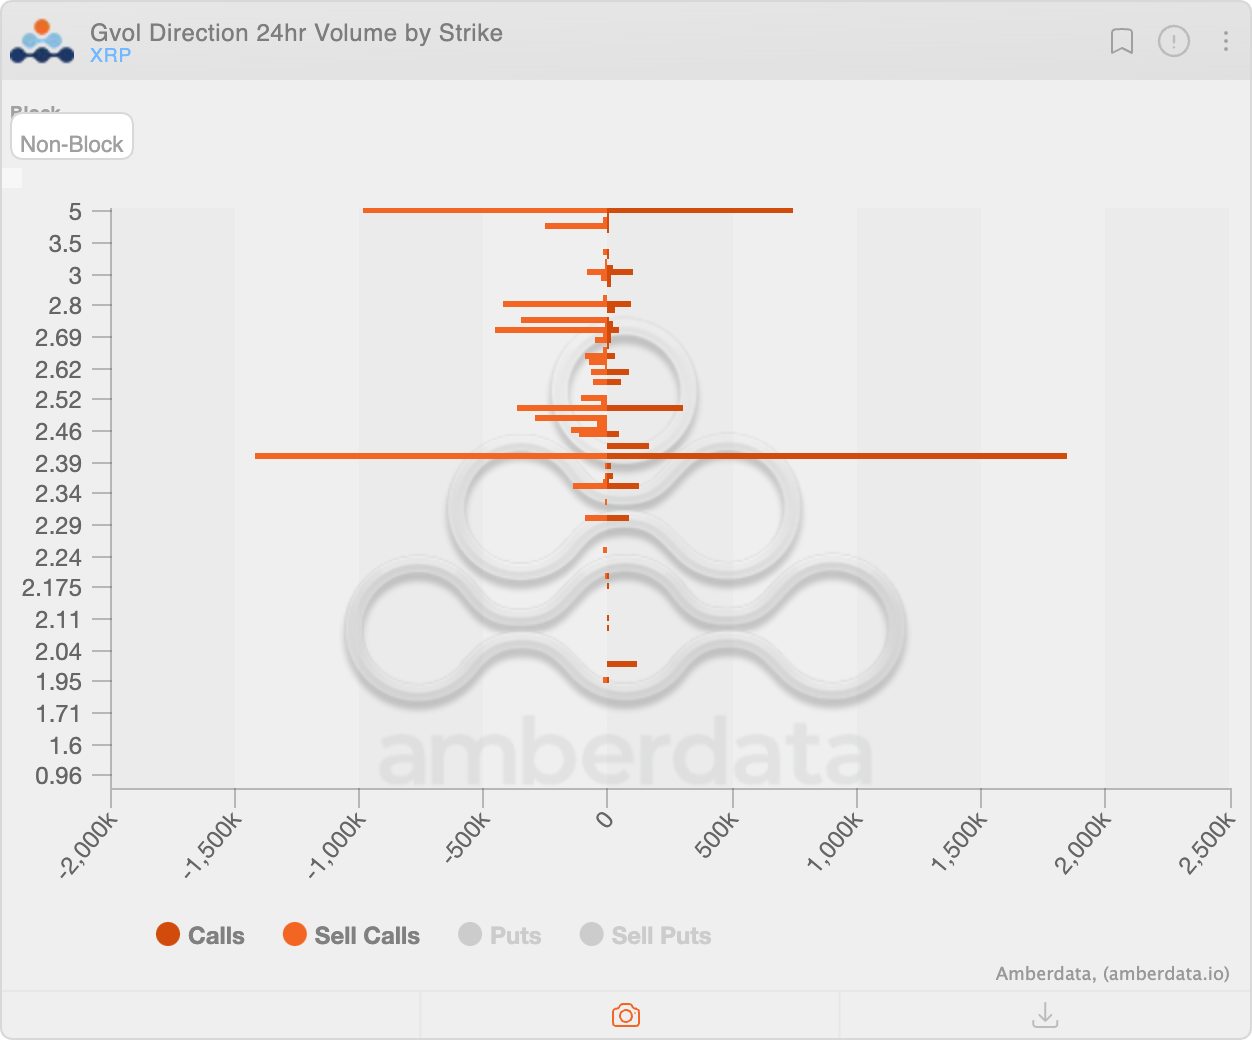
Interestingly, activity is heating up in the $5 strike call options on Deribit, offering an asymmetric upside to buyers on a potential move above that level.
The $5 call is the second-most traded XRP option of the past 24 hours, with a volume of 1.7 million contracts, according to data source Amberdata. (One contract represents 1 XRP).
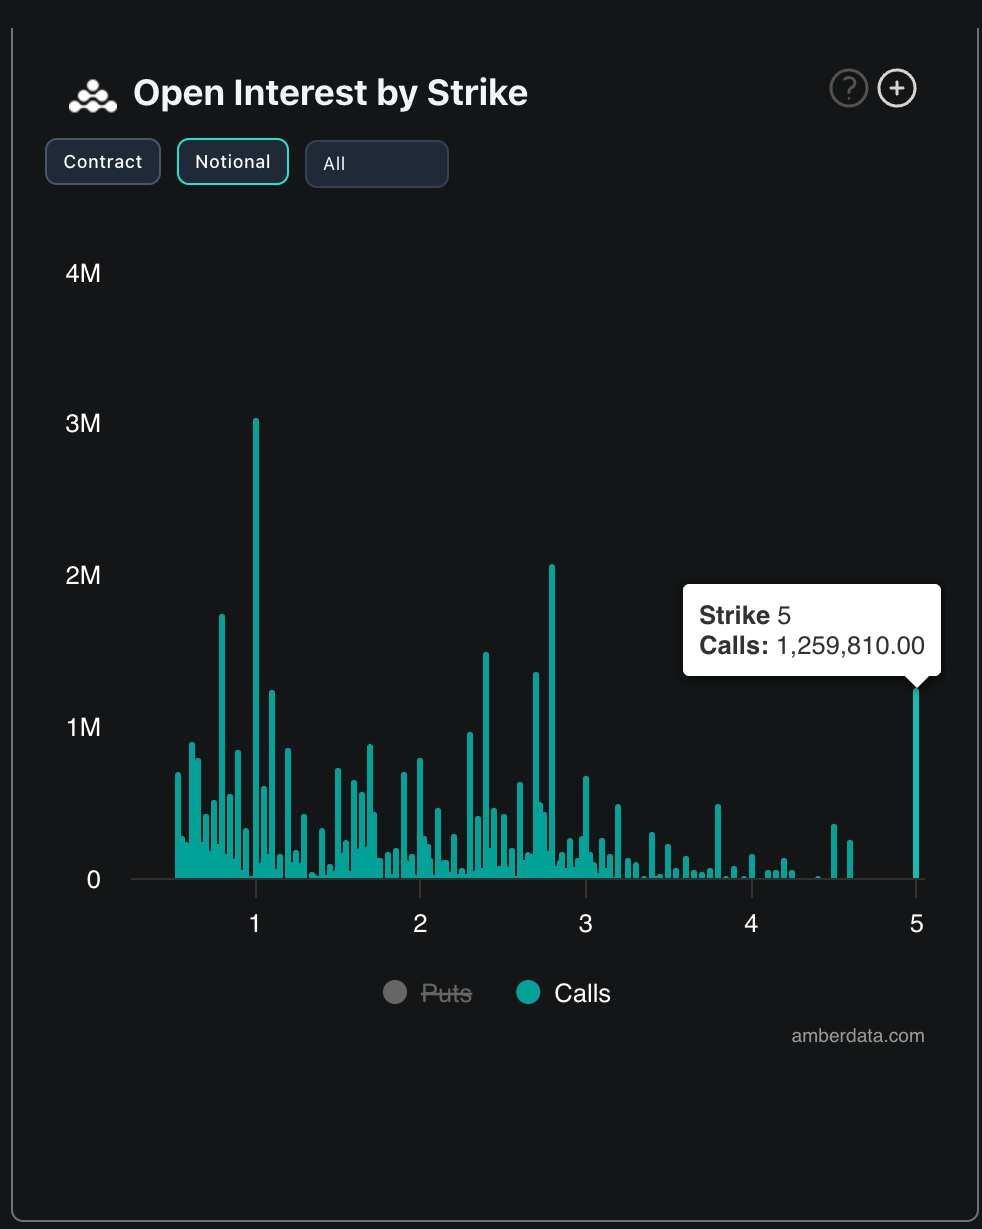
Besides, Deribit data shows the $5 call is the most popular out-of-the-money or higher strike call option with a notional open interest of $1.25 million. The increased activity indicates a bullish positioning, assuming the buyers are traders, not market makers.
Still, readers might want to note that technical analysis patterns do not always work as intended, and options market positioning can flip quickly per evolving price trends. As such, tracking the broader market sentiment is pivotal.
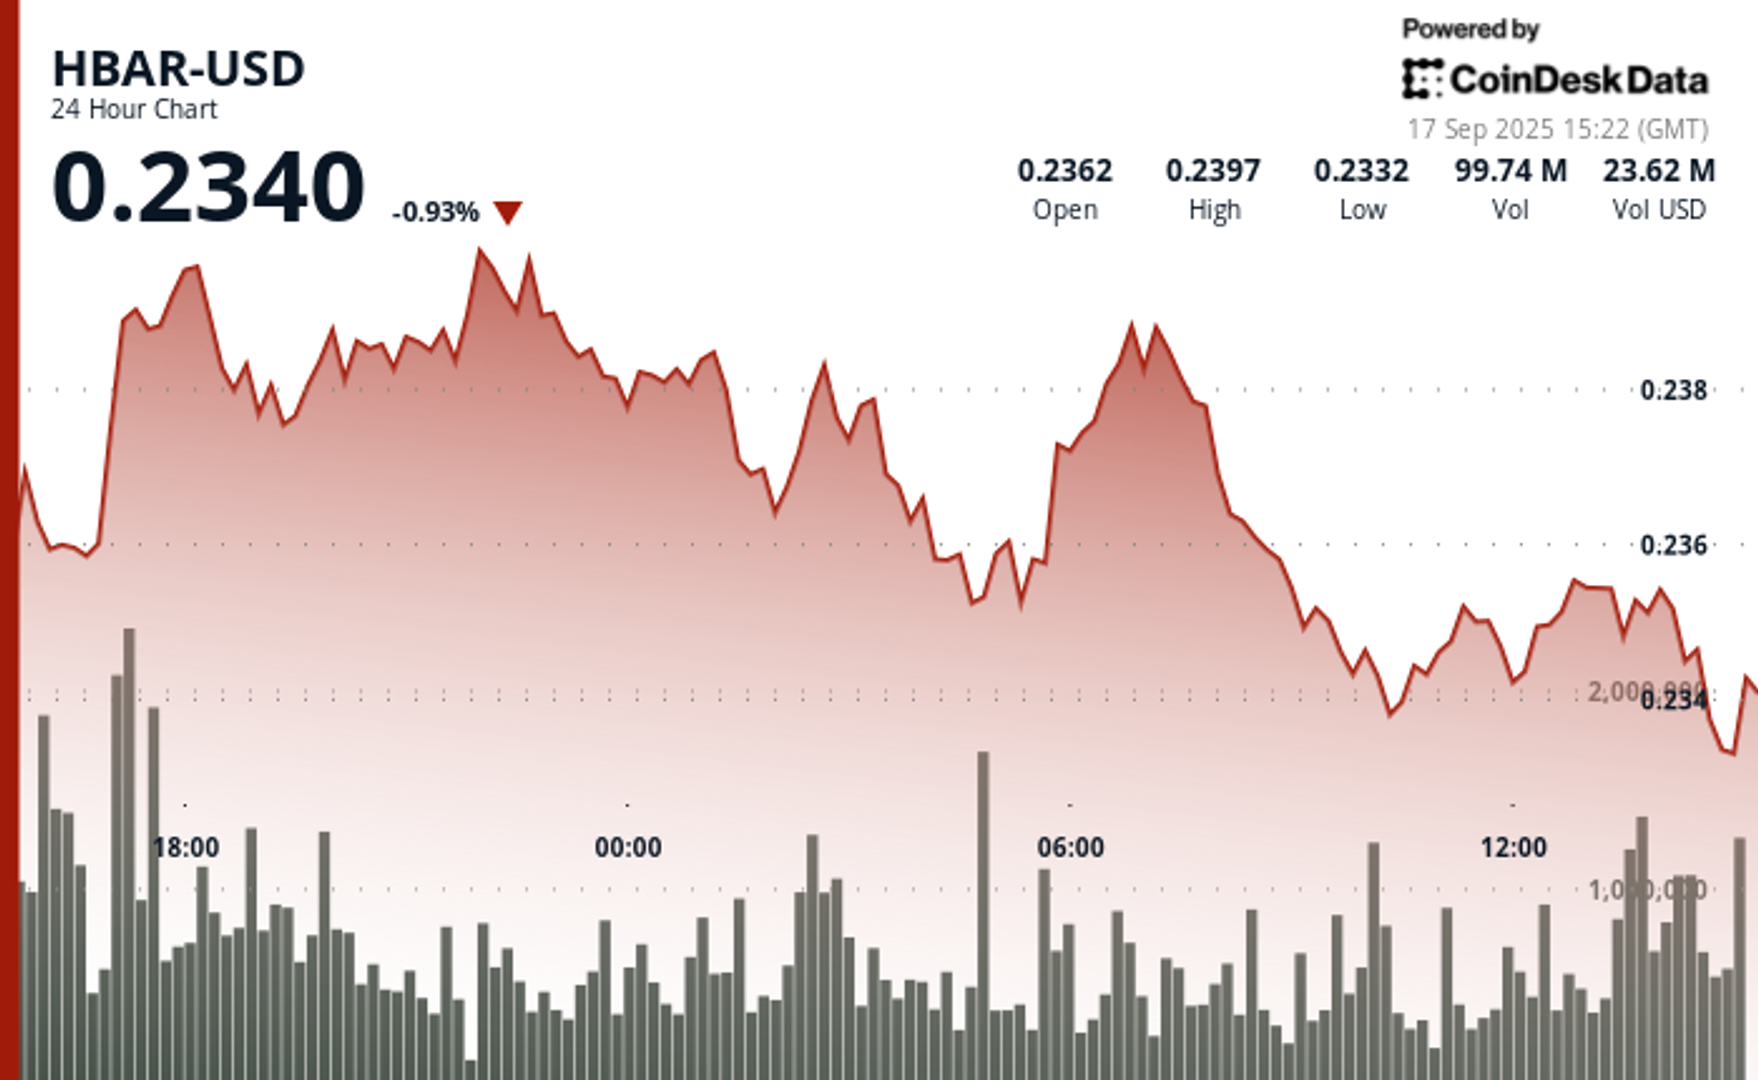
HBAR spent much of the past 23 hours locked in a narrow range, oscillating between $0.23 and $0.24 in what amounted to just 2% volatility. The token briefly touched session highs at $0.24 on Sept. 16 around 18:00 UTC before sliding lower, ultimately finding repeated support near $0.23. Multiple rebound attempts from that level throughout Sept. 17’s morning trading hinted at a potential price floor, though conviction remained limited.
Market activity tapered alongside the price drift. Trading volumes fell steadily after an early spike, underscoring weakening participation and suggesting that bullish momentum has largely faded. The constrained range and muted volatility reinforced the impression of indecision, with buyers and sellers unwilling to press for a breakout.
The final hour of the observed period offered a sharper display of market sentiment. At 13:33 UTC on Sept. 17, HBAR sold off abruptly from $0.24 to $0.23, accompanied by an outsized 2.56 million in volume just three minutes later. Yet the coin staged a measured recovery, climbing back to end near session highs, encapsulating the day’s push and pull between sellers and opportunistic dip buyers.
Overall, HBAR slipped 1% across the 23-hour window. While the establishment of support around $0.23 provides some stability, declining volumes and sustained downward pressure leave the market vulnerable. The swift sell-off and subsequent rebound illustrate the uncertainty still shaping HBAR’s outlook, with bearish sentiment prevailing but tempered by signs of technical resilience.
")
Technical Indicators Assessment
- Price action demonstrated consolidation within a 2% range between $0.23-$0.24 resistance and support thresholds.
- Volume contracted from 45.7 million to 4.7 million tokens indicating deteriorating market participation.
- Multiple rebounds at $0.23 support level suggest potential price floor establishment.
- Acute sell-off at 13:33 followed by recovery indicates volatile intraday sentiment fluctuations.
Disclaimer: Parts of this article were generated with the assistance from AI tools and reviewed by our editorial team to ensure accuracy and adherence to our standards. For more information, see CoinDesk’s full AI Policy.

Welcome to The Protocol, CoinDesk’s weekly wrap of the most important stories in cryptocurrency tech development. I’m Margaux Nijkerk, a reporter at CoinDesk.
In this issue:
- Ethereum Faces Validator Bottleneck With 2.5M ETH Awaiting Exit
- Is Ethereum’s DeFi Future on L2s? Liquidity, Innovation Say Perhaps Yes
- Ethereum Foundation Starts New AI Team to Support Agentic Payments
- American Express Introduces Blockchain-Based ‘Travel Stamps’
Network News
ETHEREUM VALIDATOR EXIT QUEUE FACES BOTTLENECK: Ethereum’s proof-of-stake system is facing its largest test yet. As of mid-September, roughly 2.5 million ETH — valued at roughly $11.25 billion — is waiting to leave the validator set, according to validator queue dashboards. The backlog pushed exit wait times to more than 46 days on Sept. 14, the longest in Ethereum’s short staking history, dashboards show. The last peak, in August, put the exit queue at 18 days. The initial spark came on Sept. 9, when Kiln, a large infrastructure provider, chose to exit all of its validators as a safety precaution. The move, triggered by recent security incidents including the NPM supply-chain attack and the SwissBorg breach, pushed around 1.6 million ETH into the queue at once. Though unrelated to Ethereum’s staking protocol itself, the hacks rattled confidence enough for Kiln to hit pause, highlighting how events in the broader crypto ecosystem can cascade into Ethereum’s validator dynamics. In a blog post from staking provider Figment, Senior Analyst Benjamin Thalman noted that the current exit queue build up isn’t only about security. After ETH has rallied more than 160% since April, some stakers are simply taking profits. Others, especially institutional players, are shifting their portfolios’ exposure. At the same time, the number of validators entering the Ethereum staking ecosystem has been steadily rising. Ethereum’s churn limit, which is a protocol safeguard that caps how many validators can enter or exit over a certain time period, is currently capped at 256 ETH per epoch (about 6.4 minutes), restricting how quickly validators can join or leave the network. The churn limit is meant to keep the network stable. With more than 2.5M ETH lined up, stakers on Sept. 16 face 44 days before even reaching the cooldown step. — Margaux Nijkerk Read more.
IS L2 DEFI EATING AT ETHEREUM’S L1 DEFI?: Ethereum is in the midst of a paradox. Even as ether hit record highs in late August, decentralized finance (DeFi) activity on Ethereum’s layer-1 (L1) looks muted compared to its peak in late 2021. Fees collected on mainnet in August were just $44 million, a 44% drop from the prior month. Meanwhile, layer-2 (L2) networks like Arbitrum and Base are booming, with $20 billion and $15 billion in total value locked (TVL) respectively. This divergence raises a crucial question: are L2s cannibalizing Ethereum’s DeFi activity, or is the ecosystem evolving into a multi-layered financial architecture? AJ Warner, the chief strategy officer of Offchain Labs, the developer firm behind layer-2 Arbitrum, argues that the metrics are more nuanced than just layer-2 DeFi chipping at the layer 1.In an interview with CoinDesk, Warner said that focusing solely on TVL misses the point, and that Ethereum is increasingly functioning as crypto’s “global settlement layer,” a foundation for high-value issuance and institutional activity. Products like Franklin Templeton’s tokenized funds or BlackRock’s BUIDL product launch directly on Ethereum L1 — activity that isn’t fully captured in DeFi metrics but underscores Ethereum’s role as the bedrock of crypto finance. Ethereum as a layer-1 blockchain is the secure but relatively slow and expensive base network. Layer-2s are scaling networks built on top of it, designed to handle transactions faster and at a fraction of the cost before ultimately settling back to Ethereum for security. That’s why they’ve become so appealing to traders and builders alike. Metrics like TVL, the amount of crypto deposited in DeFi protocols, highlight this shift as activity is moved to L2s where lower fees and quicker confirmations make everyday DeFi far more practical. — Margaux Nijkerk Read more.
EF STARTS DECENTRALIZED AI TEAM: The Ethereum Foundation (EF) is creating a dedicated artificial intelligence (AI) group to make Ethereum the settlement and coordination layer for what it calls the “machine economy,” according to research scientist Davide Crapis. Crapis, who announced the initiative on X, said the new dAI Team will pursue two priorities: enabling AI agents to pay and coordinate without intermediaries, and building a decentralized AI stack that avoids reliance on a small number of large companies. He said Ethereum’s neutrality, verifiability and censorship resistance make it a natural base layer for intelligent systems. The EF is a non-profit organization based in Zug, Switzerland, that funds and coordinates the development of the Ethereum blockchain. It does not control the network but plays a catalytic role by supporting researchers, developers and ecosystem projects. Its remit includes funding upgrades such as Ethereum 2.0, zero-knowledge proofs and layer-2 scaling, alongside community programs like the Ecosystem Support Program. The foundation also organizes events such as Devcon to foster collaboration and acts as a policy advocate for blockchain adoption. In 2025, EF restructured to handle Ethereum’s growth, emphasizing ecosystem acceleration, founder support and enterprise outreach. The new dAI Team represents a continuation of this shift toward specialized units addressing emerging technologies. — Siamak Masnavi Read more.
AMERICAN EXPRESS DABBLES IN BLOCKCHAIN TRAVEL STAMPS: American Express has introduced Ethereum-based «travel stamps» to create a commemorative record of travel experiences. The travel experience tokens, which are technically NFTs (ERC 721 tokens), are minted and stored on Coinbase’s Base network, said Colin Marlowe, vice president of Emerging Partnerships at Amex Digital Labs. The travel stamps, which can be collected anytime a traveler uses their card, are not tradable NTF tokens, Marlowe said, and neither do they function like blockchain-based loyalty points — at least for the time being. “It’s a valueless ERC-721, so technically an NFT, but we just didn’t brand it as such. We wanted to speak to it in a way that was natural for the travel experience itself, and so we talk about these things as stamps, and they’re represented as tokens,” Marlowe said in an interview. “As an identifier and representation of history the stamps could create interesting partnership angles over time. We weren’t trying to sell these or sort of generate any like short term revenue. The angle is to make a travel experience with Amex feel really rich, really different, and kind of set it apart,” he said. Fireblocks is also involved, supporting Amex as its Wallet-as-a-Service provider for the passport product, a Fireblocks representative said. The Amex travel app also includes a range of tools for travels and Centurion Lounge upgrades, the company said. – Ian Allison Read more.
In Other News
- Blockchain-based real world asset (RWA) specialists Centrifuge and Plume have launched the Anemoy Tokenized Apollo Diversified Credit Fund (ACRDX), backed by a $50 million anchor investment from Grove, a credit infrastructure protocol within the Sky Ecosystem. The fund gives blockchain investors exposure to Apollo’s diversified global credit strategy, spanning direct corporate lending, asset-backed lending and dislocated credit, a type of mispriced debt due to market stress and lack of liquidity. ACRDX will be distributed through Plume’s Nest Credit vaults under the ticker nACRDX, making the strategy accessible to institutional investors on-chain. By packaging Apollo’s portfolio in tokenized form, the fund aims to lower entry barriers and increase transparency for investors seeking exposure to private credit markets, according to a press release. — Ian Allison Read more.
- Google is taking a step toward merging artificial intelligence (AI) and digital money, rolling out a new open-source protocol that lets AI applications send and receive payments, which includes support for stablecoins, digital tokens pegged to fiat currencies such as the U.S. dollar, according to a press release. To incorporate stablecoin rails, Google teamed up with the U.S.-based crypto exchange Coinbase, which has been developing its own AI-integrated payments infrastructure. The company also worked with the Ethereum Foundation and coordinated with more than 60 other organizations, including Salesforce, American Express and Etsy, to cover traditional finance use cases. The move builds on Google’s earlier work to establish a standard for “AI agents.” These digital agents may eventually handle complex tasks, such as negotiating mortgages or shopping for clothes, without direct human input. — Oliver Knight Read more.
Regulatory and Policy
- Contrary to claims from the U.S. banking industry, stablecoins do not pose a risk to the financial system, according to the chief policy officer at crypto exchange Coinbase (COIN), Faryar Shirzad. Banks’ claims that they do are are myths crafted to defend their revenues, he wrote in a blog post. «The central claim — that stablecoins will cause a mass outflow of bank deposits — simply doesn’t hold up,» Shirzad wrote. «Recent analysis shows no meaningful link between stablecoin adoption and deposit flight for community banks and there’s no reason to believe big banks would fare any worse.» Larger lenders still hold trillions of dollars at the Federal Reserve and if deposits were really at risk, he argued, they would be competing harder for customer funds by offering higher interest rates rather than parking cash at the central bank. According to Shirzad, the real reason for banks’ opposition is the payments business. Stablecoins, digital tokens whose value is pegged to a real-life asset such as the dollar, offer faster and cheaper ways to move money, threatening an estimated $187 billion in annual swipe-fee revenue for traditional card networks and banks. He compared the current pushback to earlier battles against ATMs and online banking, when incumbents warned of systemic dangers but, he said, were ultimately trying to protect entrenched profits. — Jesse Hamilton Read more.
- U.S. SEC Chair Paul Atkins said crypto’s time has come, pledging to modernize the U.S. securities rulebook and expand “Project Crypto” to bring markets on-chain. Speaking in Paris on Sept. 10 at the OECD’s inaugural Roundtable on Global Financial Markets, Atkins said the SEC is shifting away from enforcement-driven policymaking and will provide clear rules for tokens, custody, and trading platforms. “Policy will no longer be set by ad hoc enforcement actions,” he said, calling the new approach “a golden age of financial innovation on U.S. soil.” Atkins said most tokens are not securities and promised bright-line rules for determining when crypto assets fall under SEC oversight. He said entrepreneurs must be able to raise capital on-chain without “endless legal uncertainty” and pledged a framework for platforms that integrate trading, lending, and staking under one license. Custody rules will also be updated to allow investors and intermediaries multiple options. — Siamak Masnavi Read more.
Calendar
- Sept. 22-28: Korea Blockchain Week, Seoul
- Oct. 1-2: Token2049, Singapore
- Oct. 13-15: Digital Asset Summit, London
- Oct. 16-17: European Blockchain Convention, Barcelona
- Nov. 17-22: Devconnect, Buenos Aires
- Dec. 11-13: Solana Breakpoint, Abu Dhabi
- Feb. 10-12, 2026: Consensus, Hong Kong
- Mar. 30-Apr. 2: EthCC, Cannes
- May 5-7, 2026: Consensus, Miami
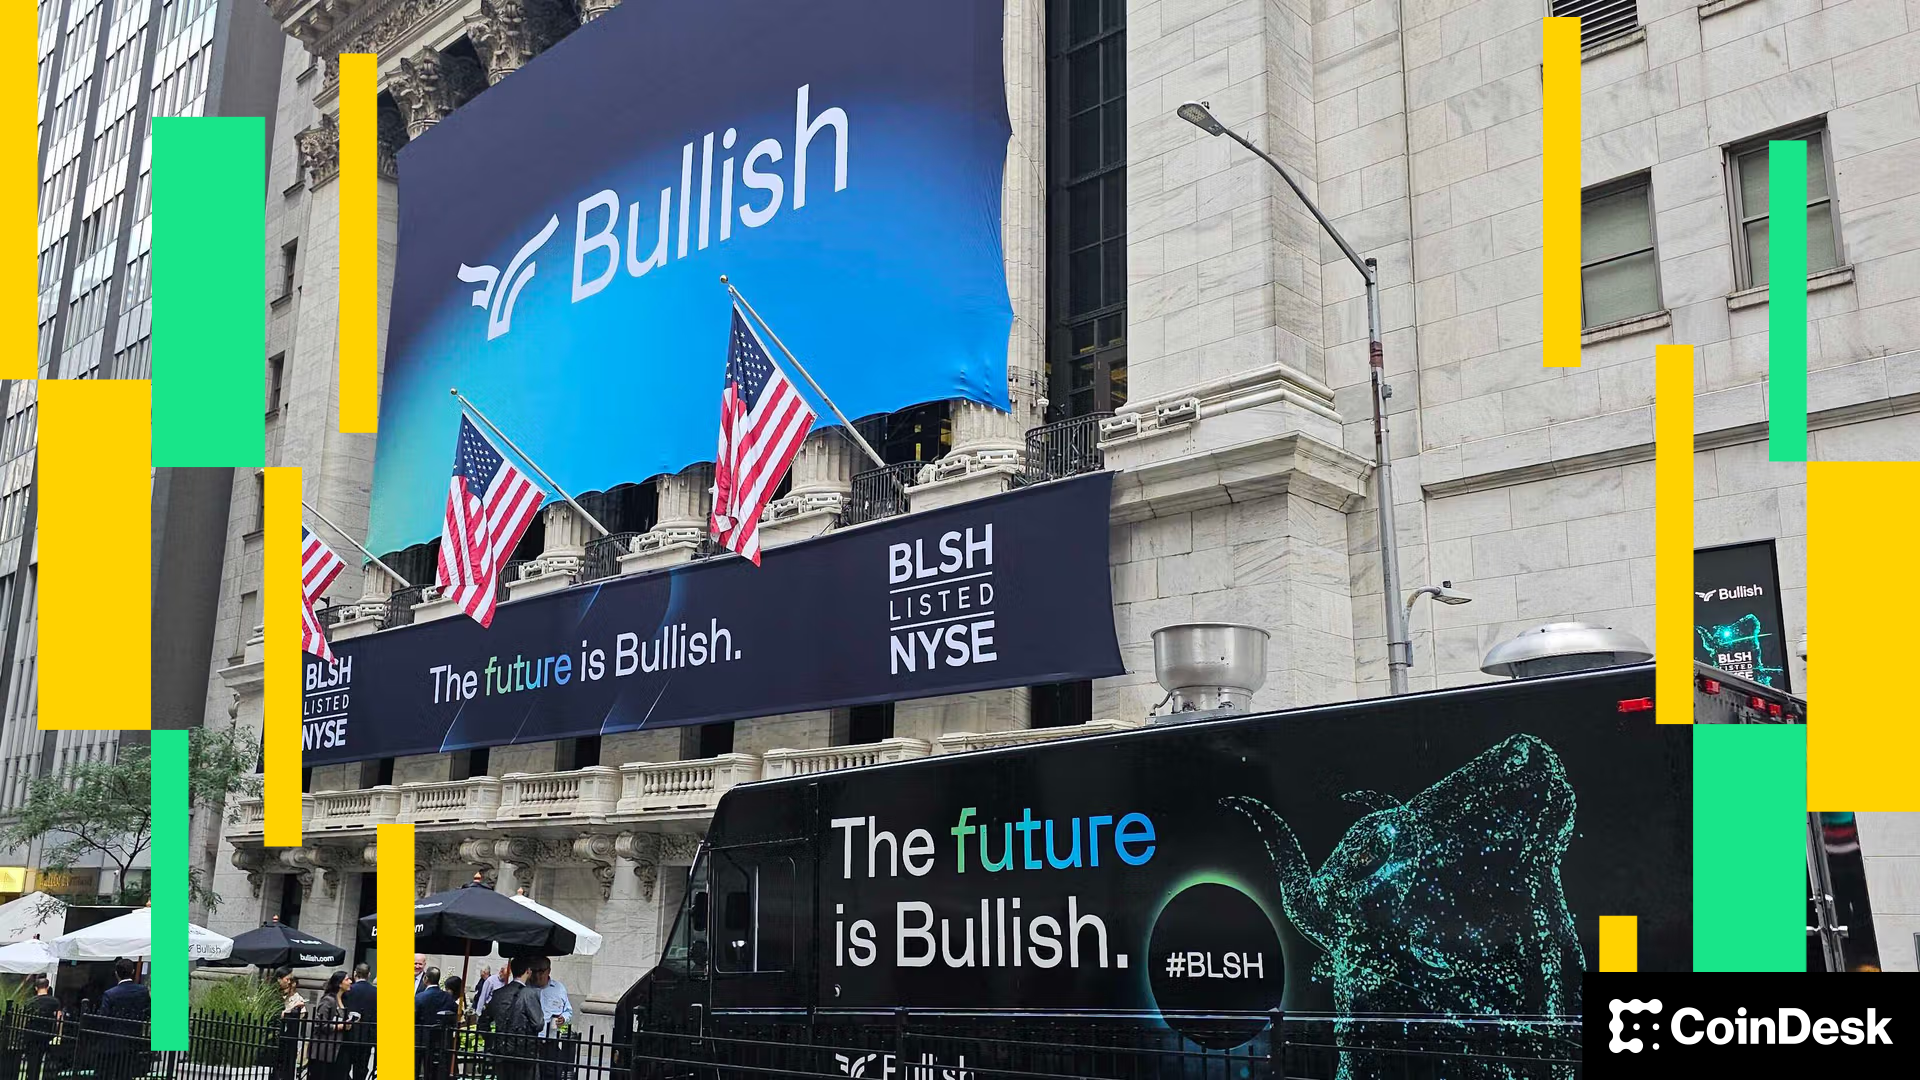
Shares of Bullish (BLSH) rose 5% to $53.12 on Tuesday after the crypto platform secured a BitLicense from the New York State Department of Financial Services, a crucial regulatory approval that opens the door to offering spot trading and custody services to institutional clients in New York.
With the license, Bullish’s U.S. arm — Bullish US Operations LLC — can now legally serve advanced traders in the financial capital of the U.S., an important step in the company’s push to expand domestically. Until now, Bullish was only regulated in Germany, Hong Kong and Gibraltar. Bullish’s global parent is also CoinDesk’s parent company.
The license comes just a day after Cathie Wood’s ARK Invest significantly increased its exposure to the company. The ARK Innovation ETF (ARKK) acquired 120,609 shares while ARK Next Generation Internet ETF (ARKW) picked up 40,574 shares, together worth about $8.21 million.
Bullish, which runs a trading platform aimed at institutional investors, will report second-quarter earnings after markets close on Wednesday.
Earlier this week, investment bank Keefe, Bruyette & Woods (KBW) initiated coverage on the company with a «market perform» rating and a $55 price target. The firm called Bullish “a rare public play” on a crypto exchange built for institutions and noted that its entry into the U.S. could drive growth. KBW sees domestic expansion as a key catalyst.
Bullish debuted on the New York Stock Exchange in August through a direct listing. Its stock surged to $104 on opening day before closing at $68. Since then, shares have fallen 22%, with today’s BitLicense announcement providing a boost.
If Bullish succeeds in expanding its footprint in the U.S., it could emerge as a legitimate competitor to Coinbase, according to brokerage firm Bernstein. The firm said success will depend on the platform’s ability to execute on its U.S. launch plans, currently targeted for 2026, Bernstein said.


HBAR Retreats Amid Constrained Range Trading and Diminishing Volumes

The Protocol: ETH Exit Queue Gridlocks As Validators Pile Up

Bullish Shares Rise 5% Ahead of Earnings After Crypto Exchange Secures New York BitLicense
-

 Business11 месяцев ago
3 Ways to make your business presentation more relatable
-
Fashion11 месяцев ago
According to Dior Couture, this taboo fashion accessory is back
-
Entertainment11 месяцев ago
10 Artists who retired from music and made a comeback
-
Entertainment11 месяцев ago
\’Better Call Saul\’ has been renewed for a fourth season
-
Entertainment11 месяцев ago
New Season 8 Walking Dead trailer flashes forward in time
-
Business11 месяцев ago
15 Habits that could be hurting your business relationships
-
Entertainment11 месяцев ago
Meet Superman\’s grandfather in new trailer for Krypton
-
Entertainment11 месяцев ago
Disney\’s live-action Aladdin finally finds its stars