Uncategorized
CANTO Rises From the Ashes, Spiking 250% Before Crashing Back Down
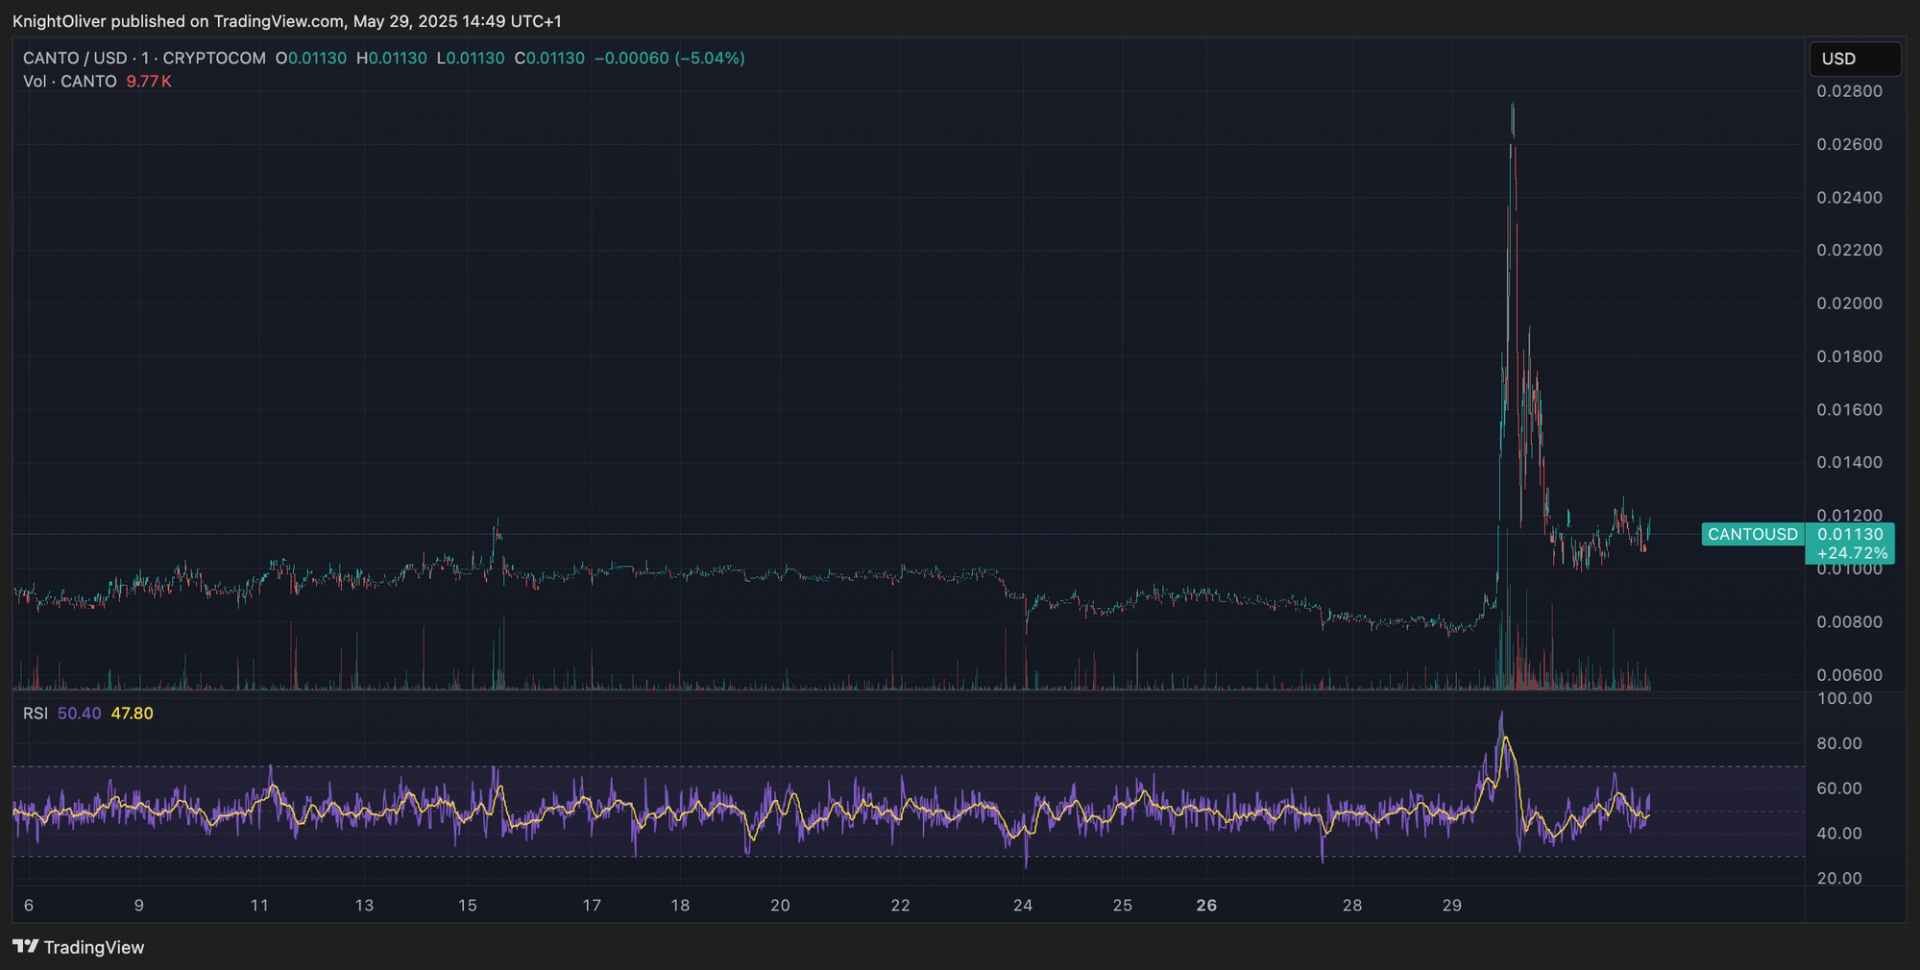
CANTO, the native token its namesake’s layer-1 blockchain, experienced a volatile trading session on Thursday, rising by 250% before losing 60% of its value over the subsequent six hours.
The platform had lost the majority of its TVL (total value locked) and trading appetite after a feverish launch last year that saw it reach a $238 million market cap with $204 million in TVL.
It currently has just $4.6 million worth of assets locked on the chain as a network outage prompted an exodus from the chain.
Canto’s plight also occurred during a wave of new layer-1 and layer-2 blockchains that caused an over saturation in protocols and liquidity.
The project has not posted an update on X since September, despite stating that a new roadmap «would be released soon.»
Thursday’s move can be attributed to a low liquidity low volume impulse in market buys, causing a momentary spike before a sell-off sparked by underwater positions taking profits.
Uncategorized
Chart of the Week: Crypto May Now Have Its Own ‘Inverse Cramer’ and Profits Are in the Millions

Meet James Wynn, the pseudonymous trader on Hyperliquid who became famous for his $1 billion bitcoin short bet, could now be gaining a new kind of fame: as crypto’s own “Inverse Cramer.”
For those unfamiliar with the Cramer lore: he’s the high-octane, loud-money mascot of CNBC’s Mad Money, a former hedge fund manager turned stock picker with a hit-or-miss track record that turned into a meme. Many retail traders started doing the exact opposite of his recommendations, and the idea became so famous that an “Inverse Cramer ETF” was launched (it was later shut down, but the meme lives on).
Now, crypto traders might have found their new «Inverse Jim Cramer» in James Wynn’s trading wallet.
«The winning strategy lately? Do the opposite of James Wynn,» said blockchain sleuth Lookonchain in an X post, pointing to a trader who has been making millions by doing exactly the opposite of James Wynn’s trades.
")
«0x2258 has been counter-trading James Wynn—shorting when James Wynn goes long, and going long when James Wynn shorts. In the past week, 0x2258 has made ~$17M, while James Wynn has lost ~$98M,» Lookonchain said in the post.
Seventeen million dollars in a week just by inverse-betting on one trader is not a bad payday. However, this might be a short-term trade, and one should be very cautious as things can change lightning fast in the trading world, leaving punters millions in losses if not hedged properly.
Even James Wynn said, «I’ll run it back, I always do. And I’ll enjoy doing it. I like playing the game,” after the trader got fully liquidated over the weekend.
So, maybe this Reddit gem: «How much money would you have made if you did the exact opposite of Jim Cramer?» would never translate to include James Wynn. But the sentiments, though, are loud and clear: in a market where perception is half the trade, even your PnL can get memed!
A bonus read: Jim Cramer Doesn’t Know Bitcoin«

XRP, used by Ripple to facilitate cross-border transactions, ended May with signs of indecision. Still, activity on the dominant crypto options exchange, Deribit, suggests that bulls aren’t ready to back down yet.
The payments-focused cryptocurrency formed a «doji» with a long upper shadow in May, a classic sign of indecision in the market, according to charting platform TradingView.
The long upper wick suggests that bulls pushed prices higher to $2.65, but bears stepped in and rejected those levels, driving prices down to near the level seen at the start of the month.
")
The appearance of the doji suggests the recovery rally from the early April lows near $1.60 has likely run out of steam. Doji candles appearing after uptrends often prompt technical analysts to call for bull exhaustion and a potential turn lower.
Accordingly, last week, some traders purchased the $ 2.40 strike put option expiring on May 30. A put option offers insurance against price drops.
Bullish options open interest
The overall picture remains bullish, with options open interest concentrated in higher-strike calls in a sign of persistent positive sentiment. Open interest refers to the number of active contracts at a given time. A call option gives the purchaser an asymmetric upside exposure to the underlying asset, in this case, XRP, representing a bullish bet.
«XRP open interest on Deribit is steadily increasing, with the highest concentration of strikes clustered on the upside between $2.60 and $3.0+, reflecting a notably bullish sentiment while the spot price currently trades at $2.16,» Luuk Strijers, CEO of Deribit, told CoinDesk.
")
The chart shows that the $4 call option is the most popular, with a notional open interest of $5.39 million. Calls at the $3 and $3.10 strikes have an open interest (OI) of over $5 million each. Notional open interest refers to the dollar value of the number of active contracts.
«XRP option open interest is split across June and September expiries, with monthly notional volumes approximating $65–$70 million, of which over 95% is traded on Deribit,» Strijers said.
The bullish mood likely stems from XRP’s positioning as a cross-border payments solution and mounting expectations of a spot XRP ETF listing in the U.S. Furthermore, the cryptocurrency is gaining traction as a corporate treasury asset.
Ripple, which uses XRP to facilitate cross-border transactions, recently highlighted its potential to address inefficiencies in SWIFT-based cross-border payments. The B2B cross-border payments market is projected to increase to $50 trillion by 2031, up 58% from $31.6 trillion in 2024.

Ethereum (ETH) faced renewed downside pressure in late trading, tumbling below the $2,500 level as selling volume surged and broader risk sentiment weakened. Global trade tensions and renewed U.S. tariff risks have triggered risk-off flows, with digital assets increasingly mirroring traditional markets in their reaction to geopolitical uncertainty.
On-chain data revealed sizable inflows to centralized exchanges — most notably 385,000 ETH to Binance —a dding to speculation that institutional players may be trimming positions. Although ETH has since recovered modestly to trade around $2,506, market observers are closely watching whether buyers can defend this level or if another leg lower is imminent.
Technical Analysis Highlights
- ETH traded within a volatile $48.61 range (1.95%) between $2,551.09 and $2,499.09.
- Price action formed a bullish ascending channel before breaking down in the final hour.
- Heavy selling emerged near $2,550, with profit-taking accelerating into a sharp reversal.
- ETH dropped from $2,521.35 to $2,499.09 between 01:53 and 01:54, with combined volume exceeding 48,000 ETH across two minutes.
- Volume normalized shortly after, and price recovered slightly, consolidating around the $2,504–$2,508 band.
- The $2,500 level is now acting as interim support, though momentum remains fragile with signs of distribution still evident in recent volume patterns.
External References
- «Ethereum Price Analysis: Is ETH Dumping to $2K Next as Momentum Fades?«, CryptoPotato, published May 31, 2025.
- «Ethereum Bulls Defend Support – Key Indicator Hints At Short-Term Rally«, NewsBTC, published May 31, 2025.


Chart of the Week: Crypto May Now Have Its Own ‘Inverse Cramer’ and Profits Are in the Millions

XRP’s Indecisive May vs. Bullish Bets – A Divergence Worth Watching

ETH Price Dips Below $2,500 on Whale Exit Fears, Then Bounces Back Above Key Level
-

 Fashion8 месяцев ago
These \’90s fashion trends are making a comeback in 2017
-
Entertainment8 месяцев ago
The final 6 \’Game of Thrones\’ episodes might feel like a full season
-
Fashion8 месяцев ago
According to Dior Couture, this taboo fashion accessory is back
-
Entertainment8 месяцев ago
The old and New Edition cast comes together to perform
-
Business8 месяцев ago
Uber and Lyft are finally available in all of New York State
-
Sports8 месяцев ago
Phillies\’ Aaron Altherr makes mind-boggling barehanded play
-
Entertainment8 месяцев ago
\’Better Call Saul\’ has been renewed for a fourth season
-
Entertainment8 месяцев ago
Disney\’s live-action Aladdin finally finds its stars