Uncategorized
Crypto Daybook Americas: Bitcoin, Ether Rise After Court Nixes Trump’s Tariffs

By Omkar Godbole (All times ET unless indicated otherwise)
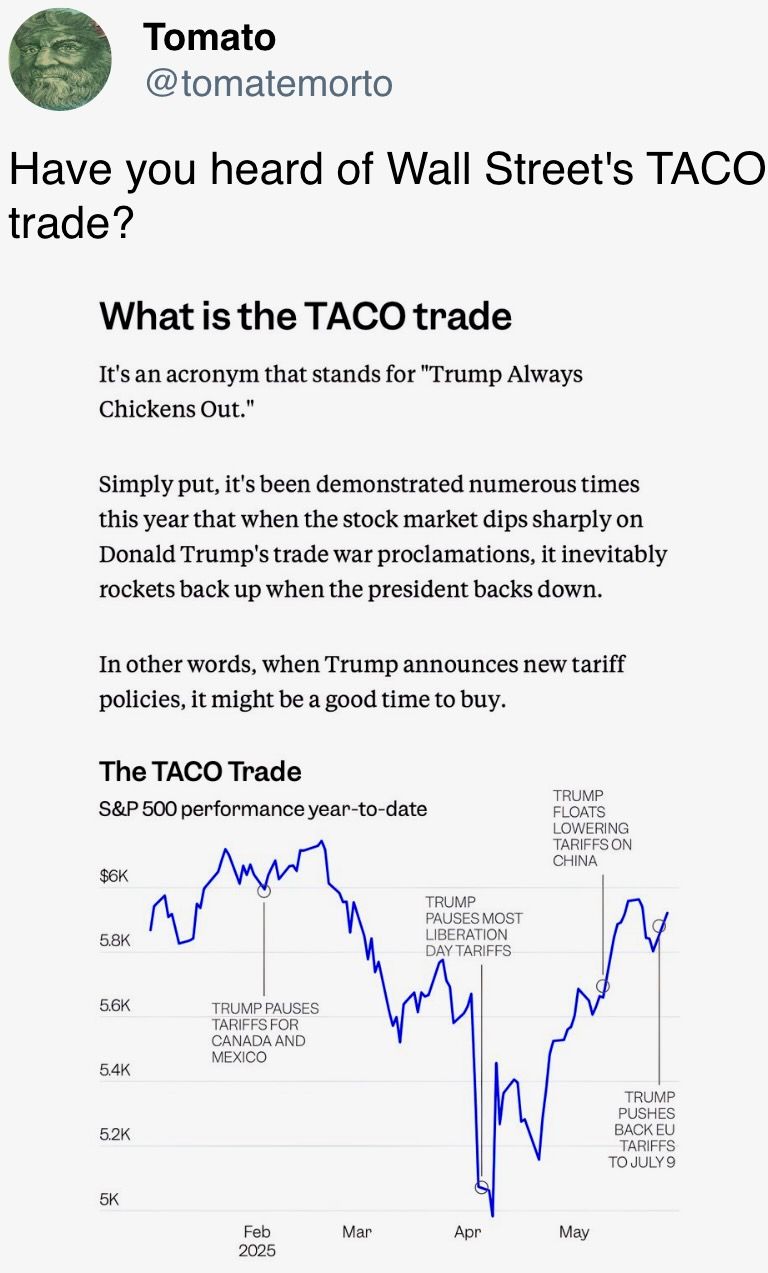
Bitcoin BTC rose and stock index futures surged early Thursday after a U.S. court declared President Donald Trump’s broad-based tariffs regime invalid. The positive sentiment was buoyed by AI giant Nvidia’s upbeat earnings.
On-chain data showed large wallets, those holding over 10,000 BTC, have shifted to selling from buying as the largest cryptocurrency holds close to its record high, with an increase in exchange deposits also pointing to selling pressure. Meanwhile, options market data signaled potential for volatility ahead of Friday’s monthly settlement.
Ether ETH, the second-largest cryptocurrency by market value, jumped to $2,780, the highest since Feb. 24, consistent with the bullish signals from the derivatives market. The token has been bid this week, supposedly on SharpLink’s $425 million Treasury plan. Notably, U.S.-listed spot ether ETFs saw a net inflow of $84.89 million on Wednesday, extending their streak to eight consecutive days.
Canada-listed investment firm Sol Strategies said it filed a preliminary prospectus with local securities regulators to raise up to $1 billion to boost its investment in the Solana ecosystem. Still, SOL was flattish at around $170.
In the broader market, TON, PEPE and FLOKI led other coins higher while FARTCOIN, PI and JUP nursed most losses. Open interest in TON perpetual futures surged 33% to $190 million, clocking the highest since Feb. 18.
Stablecoin issuer Circle froze wallets connected to the Libra token containing millions of dollars worth of USDC. Metaplanet issued $21M in bonds to finance more bitcoin purchases.
In traditional markets, some investment banks said Trump has other tools to sidestep the court ruling on tariffs. Yields on the longer duration Treasury notes ticked higher, suggesting dollar strength. Stay alert!
What to Watch
- Crypto
- May 30: The second round of FTX repayments starts.
- May 31 (TBC): Mezo mainnet launch.
- June 6, 1-5 p.m.: U.S. SEC Crypto Task Force Roundtable on «DeFi and the American Spirit«
- Macro
- May 29, 8 a.m.: The Brazilian Institute of Geography and Statistics (IBGE) releases April unemployment rate data.
- Unemployment Rate Est. 6.9% vs. Prev. 7%
- May 29, 8:30 a.m.: The U.S. Bureau of Economic Analysis (BEA) releases Q1 GDP data.
- GDP Growth Rate QoQ (2nd estimate) Est. -0.3% vs. Prev. 2.4%
- GDP Price Index QoQ (2nd estimate) Est. 3.7% vs. Prev. 2.3%
- GDP Sales QoQ (2nd estimate) Est. -2.5% vs. Prev. 3.3%
- May 29, 2 p.m.: Fed Governor Adriana D. Kugler will deliver a speech at the 5th Annual Federal Reserve Board Macro-Finance Workshop (virtual). Livestream link.
- May 30, 8 a.m.: The Brazilian Institute of Geography and Statistics (IBGE) releases Q1 GDP data.
- GDP Growth Rate QoQ Est. 1.4% vs. Prev. 0.2%
- GDP Growth Rate YoY Est. 3.2% vs. Prev. 3.6%
- May 30, 8 a.m.: Mexico’s National Institute of Statistics and Geography releases April unemployment rate data.
- Unemployment Rate Est. 2.5% vs. Prev. 2.2%
- May 30, 8:30 a.m.: Statistics Canada releases Q1 GDP data.
- GDP Growth Rate Annualized Est. 1.7% vs. Prev. 2.6%
- GDP Growth Rate QoQ Prev. 0.6%
- May 30, 8:30 a.m.: The U.S. Bureau of Economic Analysis (BEA) releases April consumer income and expenditure data.
- Core PCE Price Index MoM Est. 0.1% vs. Prev. 0%
- Core PCE Price Index YoY Est. 2.5% vs. Prev. 2.6%
- PCE Price Index MoM Est. 0.1% vs. Prev. 0%
- PCE Price Index YoY Est. 2.2% vs. Prev. 2.3%
- Personal Income MoM Est. 0.3% vs. Prev. 0.5%
- Personal Spending MoM Est. 0.2% vs. Prev. 0.7%
- May 30, 10 a.m.: The University of Michigan releases (final) May U.S. consumer sentiment data.
- Michigan Consumer Sentiment Est. 51 vs. Prev. 52.2
- May 29, 8 a.m.: The Brazilian Institute of Geography and Statistics (IBGE) releases April unemployment rate data.
- Earnings (Estimates based on FactSet data)
- None in the near future.
Token Events
- Governance votes & calls
- Arbitrum DAO is voting on a constitutional AIP to upgrade Arbitrum One and Arbitrum Nova to ArbOS 40 “Callisto,” bringing them in line with Ethereum’s May 7 Pectra upgrade. The proposal schedules activation for June 17, and voting ends on May 29.
- Sui DAO is voting on moving to recover approximately $220 million in funds stolen from the Cetus Protocol hack via a protocol upgrade. Voting ends June 3.
- May 29, 8 a.m.: NEAR Protocol to host a House of Stake Ask Me Anything (AMA) session.
- May 29, 2 p.m.: Wormhole to host an ecosystem call.
- June 4, 6:30 p.m.: Synthetic to host a community call.
- June 10, 10 a.m.: Ether.fi to host an analyst call followed by a Q&A session.
- Unlocks
- May 31: Optimism (OP) to unlock 1.89% of its circulating supply worth $24.43 million.
- June 1: Sui (SUI) to unlock 1.32% of its circulating supply worth $160.58 million.
- June 1: ZetaChain (ZETA) to unlock 5.34% of its circulating supply worth $11.18 million.
- June 12: Ethena (ENA) to unlock 0.7% of its circulating supply worth $15.83 million.
- June 12: Aptos (APT) to unlock 1.79% of its circulating supply worth $60.96 million.
- Token Launches
- June 1: Staking rewards for staking ERC-20 OM on MANTRA Finance end.
- June 16: Advised deadline to unstake stMATIC as part of Lido on Polygon’s sunsetting process ends.
- June 26: Coinbase to delist Helium Mobile (MOBILE), Render (RNDR), Ribbon Finance (RBN), & Synapse (SYN)
Conferences
- Day 3 of 3: Bitcoin 2025 (Las Vegas)
- Day 3 of 4: Web Summit Vancouver (Vancouver, British Columbia)
- May 29: Stablecon (New York)
- Day 1 of 2: Litecoin Summit 2025 (Las Vegas)
- Day 1 of 4: Balkans Crypto 2025 (Tirana, Albania)
- June 2-7: SXSW London
- June 19-21: BTC Prague 2025
- June 25-26: Bitcoin Policy Institute’s Bitcoin Policy Summit 2025 (Washington)
- June 26-27: Istanbul Blockchain Week
Token Talk
By Oliver Knight
- Markets on the Ethereum-based Cork Protocol remain paused after Wednesday’s $12 million smart-contract exploit.
- The attacker manipulated the smart contact’s exchange-rate function by issuing fake tokens, stealing 3,761.8 wrapped staked ether (wstETH) in the process.
- The exploit marked another attack on the decentralized finance (DeFi) industry just days after Sui-based Cetus Protocol lost $223 million to an exploit.
- TRM Labs estimates that $2.2 billion was stolen in crypto exploits and hacks in 2024.
- Ether remains unperturbed by the exploit, leading the market today on the back of renewed institutional interest and spot ETF flows. It is up 3.8% in the past 24 hours while bitcoin is down by 0.17%.
Derivatives Positioning
- TRX, XMR, ETH, LTC and BNB led major cryptocurrencies’ growth in perpetual futures open interest.
- Funding rates for majors, except TON, signal bullish sentiment, but nothing extraordinary.
- On the CME, ETH annualized one-month futures basis topped 10%, while BTC lagged at 8.7%.
- Signs of caution emerged on Deribit, with front-end BTC skew flipping to puts and ETH’s call skew softening. Block flows on Paradigm featured demand for short-dated BTC puts.
Market Movements
- BTC is up 1.15% from 4 p.m. ET Wednesday at $108,594.41 (24hrs: -0.29%)
- ETH is up 3.9% at $2,738.04 (24hrs: +3.63%)
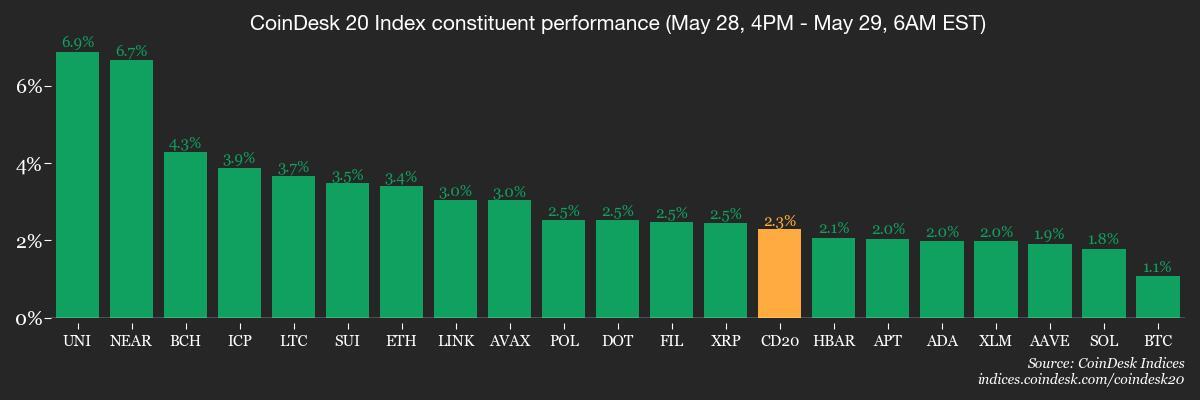
- CoinDesk 20 is up 2.21% at 3,278.84 (24hrs: +0.66%)
- Ether CESR Composite Staking Rate is unchanged at 3.1%
- BTC funding rate is at 0.0057% (6.3006% annualized) on Binance
- DXY is up 0.12% at 99.99
- Gold is up 0.32% at $3,304.20/oz
- Silver is up 1.24% at $33.41/oz
- Nikkei 225 closed +1.88% at 38,432.98
- Hang Seng closed +1.35% at 23,573.38
- FTSE is unchanged at 8,724.05
- Euro Stoxx 50 is unchanged at 5,378.39
- DJIA closed on Wednesday -0.58% at 42,098.70
- S&P 500 closed -0.56% at 5,888.55
- Nasdaq closed -0.51% at 19,100.94
- S&P/TSX Composite Index closed unchanged at 26,283.50
- S&P 40 Latin America closed -0.76 at 2,599.53
- U.S. 10-year Treasury rate is up 6 bps at 4.54%
- E-mini S&P 500 futures are up 1.53% at 5,993.25
- E-mini Nasdaq-100 futures are up 2.03% at 21,814.25
- E-mini Dow Jones Industrial Average Index futures are up 0.96% at 42,576.00
Bitcoin Stats
- BTC Dominance: 63.71 (-0.06%)
- Ethereum to bitcoin ratio: 0.02517 (1.12%)
- Hashrate (seven-day moving average): 910 EH/s
- Hashprice (spot): $57.0
- Total Fees: 8.03 BTC / $868,310
- CME Futures Open Interest: 152,995 BTC
- BTC priced in gold: 32.8 oz
- BTC vs gold market cap: 9.30%
Technical Analysis

- The VIRTUAL token has topped the 38.2% Fibonacci retracement of the January-April crash.
- The break out above the widely tracked resistance could entice more buyers, yielding a bigger rally.
Crypto Equities
- Strategy (MSTR): closed on Wednesday at $364.25 (-2.14%), +2.43% at $373.09 in pre-market
- Coinbase Global (COIN): closed at $254.29 (-4.55%), +3.01% at $261.95
- Galaxy Digital Holdings (GLXY): closed at C$28 (-6.57%)
- MARA Holdings (MARA): closed at $14.86 (-9.61%), +4.04% at $15.46
- Riot Platforms (RIOT): closed at $8.38 (-8.32%), +2.86% at $8.62
- Core Scientific (CORZ): closed at $10.78 (-4.43%), +2.97% at $11.10
- CleanSpark (CLSK): closed at $9.11 (-7.61%), +3.62% at $9.44
- CoinShares Valkyrie Bitcoin Miners ETF (WGMI): closed at $17.27 (-5.32%)
- Semler Scientific (SMLR): closed at $41.32 (-4.77%), +2.95% at $42.54
- Exodus Movement (EXOD): closed at $25.94 (-25.35%), +11.6% at $28.95
ETF Flows
Spot BTC ETFs
- Daily net flow: $432.7 million
- Cumulative net flows: $45.31 billion
- Total BTC holdings ~ 1.21 million
Spot ETH ETFs
- Daily net flow: $84.9 million
- Cumulative net flows: $2.9 billion
- Total ETH holdings ~ 3.57 million
Source: Farside Investors
Overnight Flows
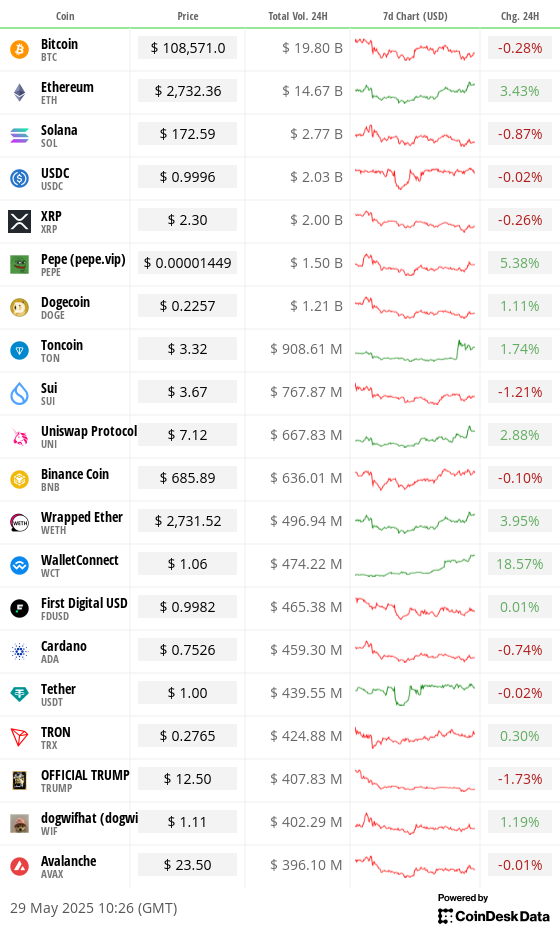
Chart of the Day
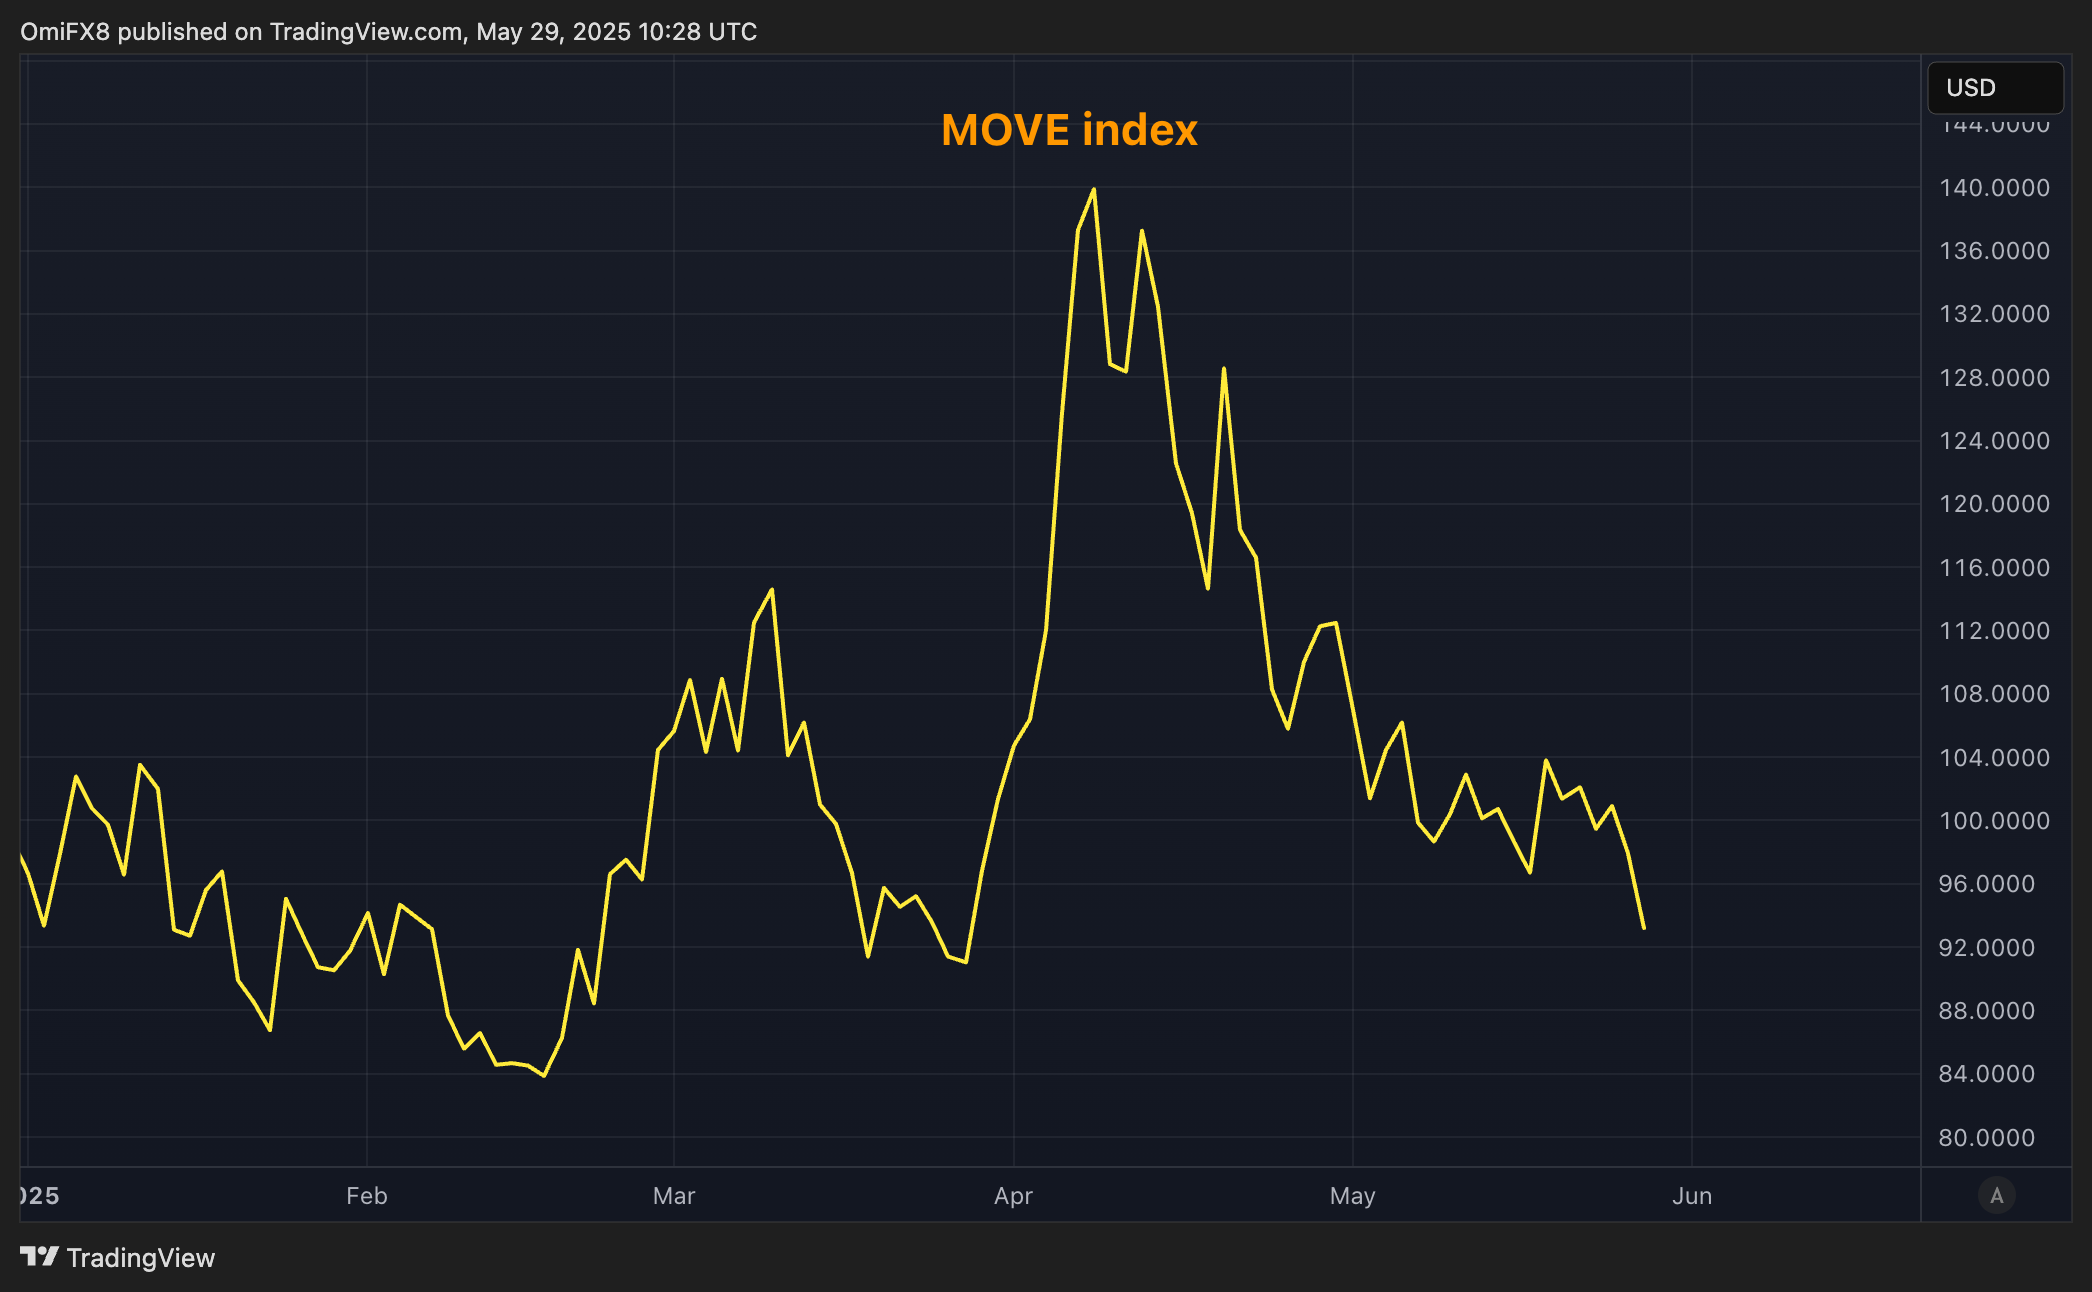
- The MOVE index, which measures the volatility in U.S. Treasury notes, has dropped to the lowest level since March.
- If it drops further, a continued decline is likely to ease financial conditions, greasing the bitcoin bull run.
While You Were Sleeping
- U.S. Trade Court Strikes Down Trump’s Global Tariffs (The Wall Street Journal): Judges said economic deficits don’t meet the legal threshold for a national emergency, and said unchecked executive authority over levies violates the constitutional separation of powers.
- Solana Scores Twin Institutional Wins With $1B Raise and First Public Liquid Staking Strategy (CoinDesk): Sol Strategies aims to raise $1 billion to expand Solana ecosystem exposure, while DeFi Development said it is the first public firm to hold Solana-based liquid staking tokens.
- Bitcoin Whales Seem to Be Calling a Top as BTC Price Consolidates (CoinDesk): Large holders are offloading BTC and sending it to exchanges after a period of accumulation, while smaller investors continue buying.
- XRP Army Is Truly Global as CME Data Reveals Nearly Half of XRP Futures Trading Occurs in Non-U.S. Hours (CoinDesk): These contracts recorded $86.6 million in volume over six days across 4,032 trades, with 46% of activity logged during overseas sessions.
- Goldman Urges Investors to Buy Gold and Oil as Long-Term Hedges (Bloomberg): Goldman Sachs said surging U.S. debt and concerns over monetary and fiscal governance have eroded trust in long-term Treasuries, making gold and oil essential hedges against inflation and supply shocks.
- UK Seeks to Speed Up Implementation of U.S. Trade Deal (Financial Times): The U.K. business secretary will meet the U.S. Trade Representative in Paris next week to discuss implementation timelines for the bilateral trade deal announced on May 8.
In the Ether
Uncategorized
Chart of the Week: Crypto May Now Have Its Own ‘Inverse Cramer’ and Profits Are in the Millions

Meet James Wynn, the pseudonymous trader on Hyperliquid who became famous for his $1 billion bitcoin short bet, could now be gaining a new kind of fame: as crypto’s own “Inverse Cramer.”
For those unfamiliar with the Cramer lore: he’s the high-octane, loud-money mascot of CNBC’s Mad Money, a former hedge fund manager turned stock picker with a hit-or-miss track record that turned into a meme. Many retail traders started doing the exact opposite of his recommendations, and the idea became so famous that an “Inverse Cramer ETF” was launched (it was later shut down, but the meme lives on).
Now, crypto traders might have found their new «Inverse Jim Cramer» in James Wynn’s trading wallet.
«The winning strategy lately? Do the opposite of James Wynn,» said blockchain sleuth Lookonchain in an X post, pointing to a trader who has been making millions by doing exactly the opposite of James Wynn’s trades.
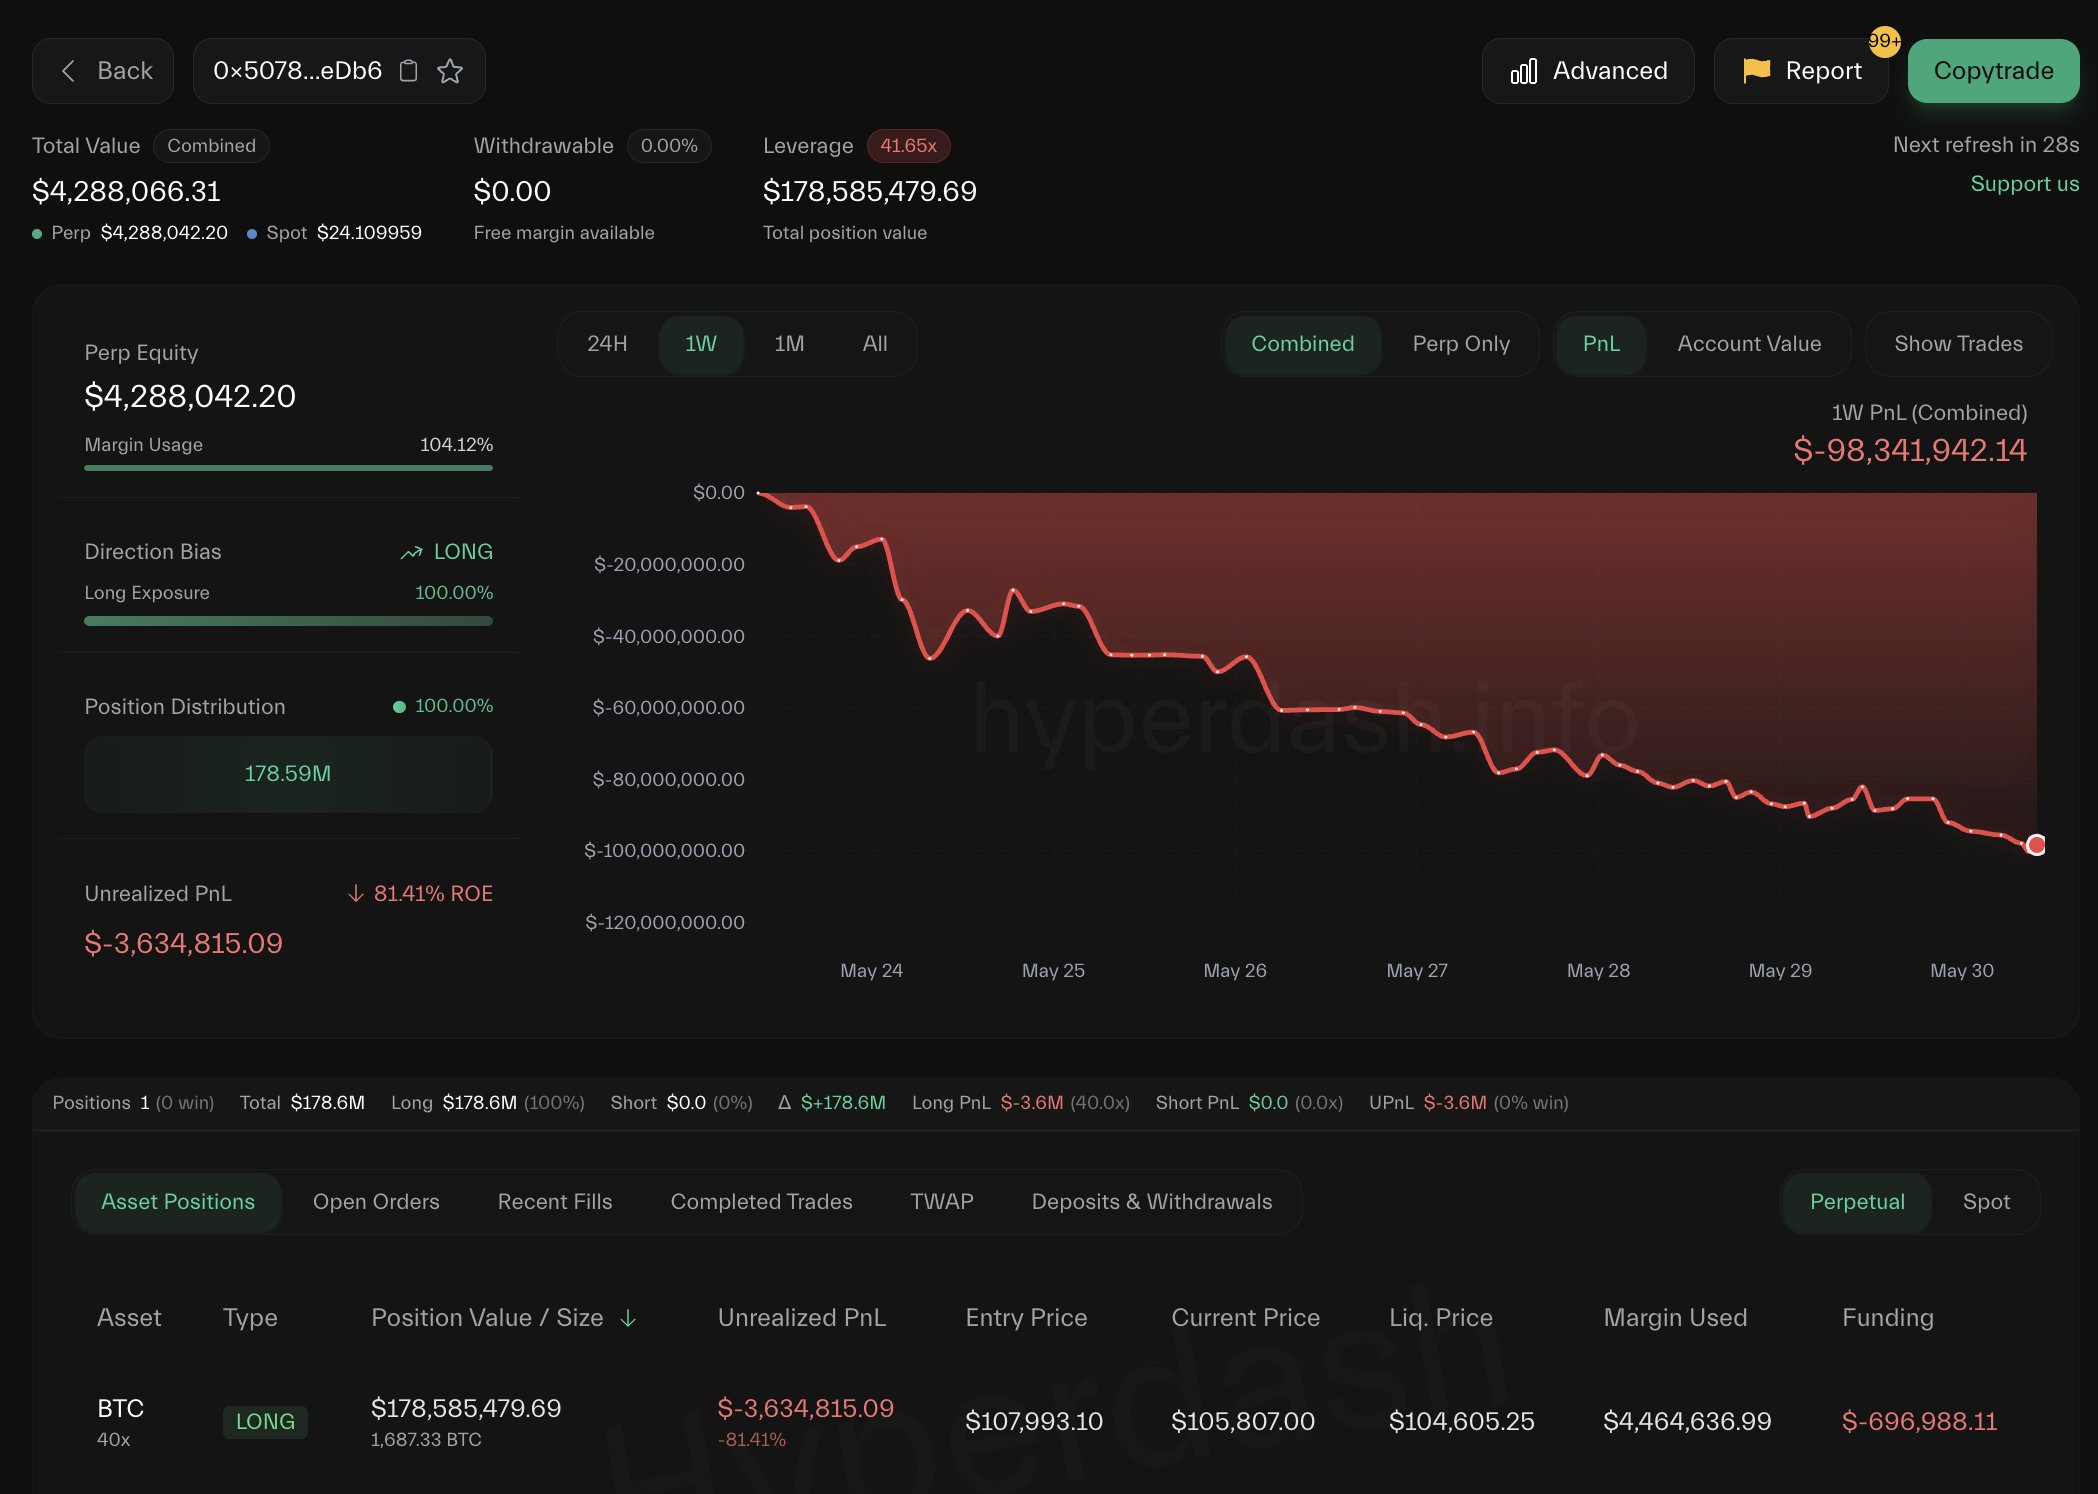
«0x2258 has been counter-trading James Wynn—shorting when James Wynn goes long, and going long when James Wynn shorts. In the past week, 0x2258 has made ~$17M, while James Wynn has lost ~$98M,» Lookonchain said in the post.
Seventeen million dollars in a week just by inverse-betting on one trader is not a bad payday. However, this might be a short-term trade, and one should be very cautious as things can change lightning fast in the trading world, leaving punters millions in losses if not hedged properly.
Even James Wynn said, «I’ll run it back, I always do. And I’ll enjoy doing it. I like playing the game,” after the trader got fully liquidated over the weekend.
So, maybe this Reddit gem: «How much money would you have made if you did the exact opposite of Jim Cramer?» would never translate to include James Wynn. But the sentiments, though, are loud and clear: in a market where perception is half the trade, even your PnL can get memed!
A bonus read: Jim Cramer Doesn’t Know Bitcoin«
Uncategorized
XRP’s Indecisive May vs. Bullish Bets – A Divergence Worth Watching

XRP, used by Ripple to facilitate cross-border transactions, ended May with signs of indecision. Still, activity on the dominant crypto options exchange, Deribit, suggests that bulls aren’t ready to back down yet.
The payments-focused cryptocurrency formed a «doji» with a long upper shadow in May, a classic sign of indecision in the market, according to charting platform TradingView.
The long upper wick suggests that bulls pushed prices higher to $2.65, but bears stepped in and rejected those levels, driving prices down to near the level seen at the start of the month.
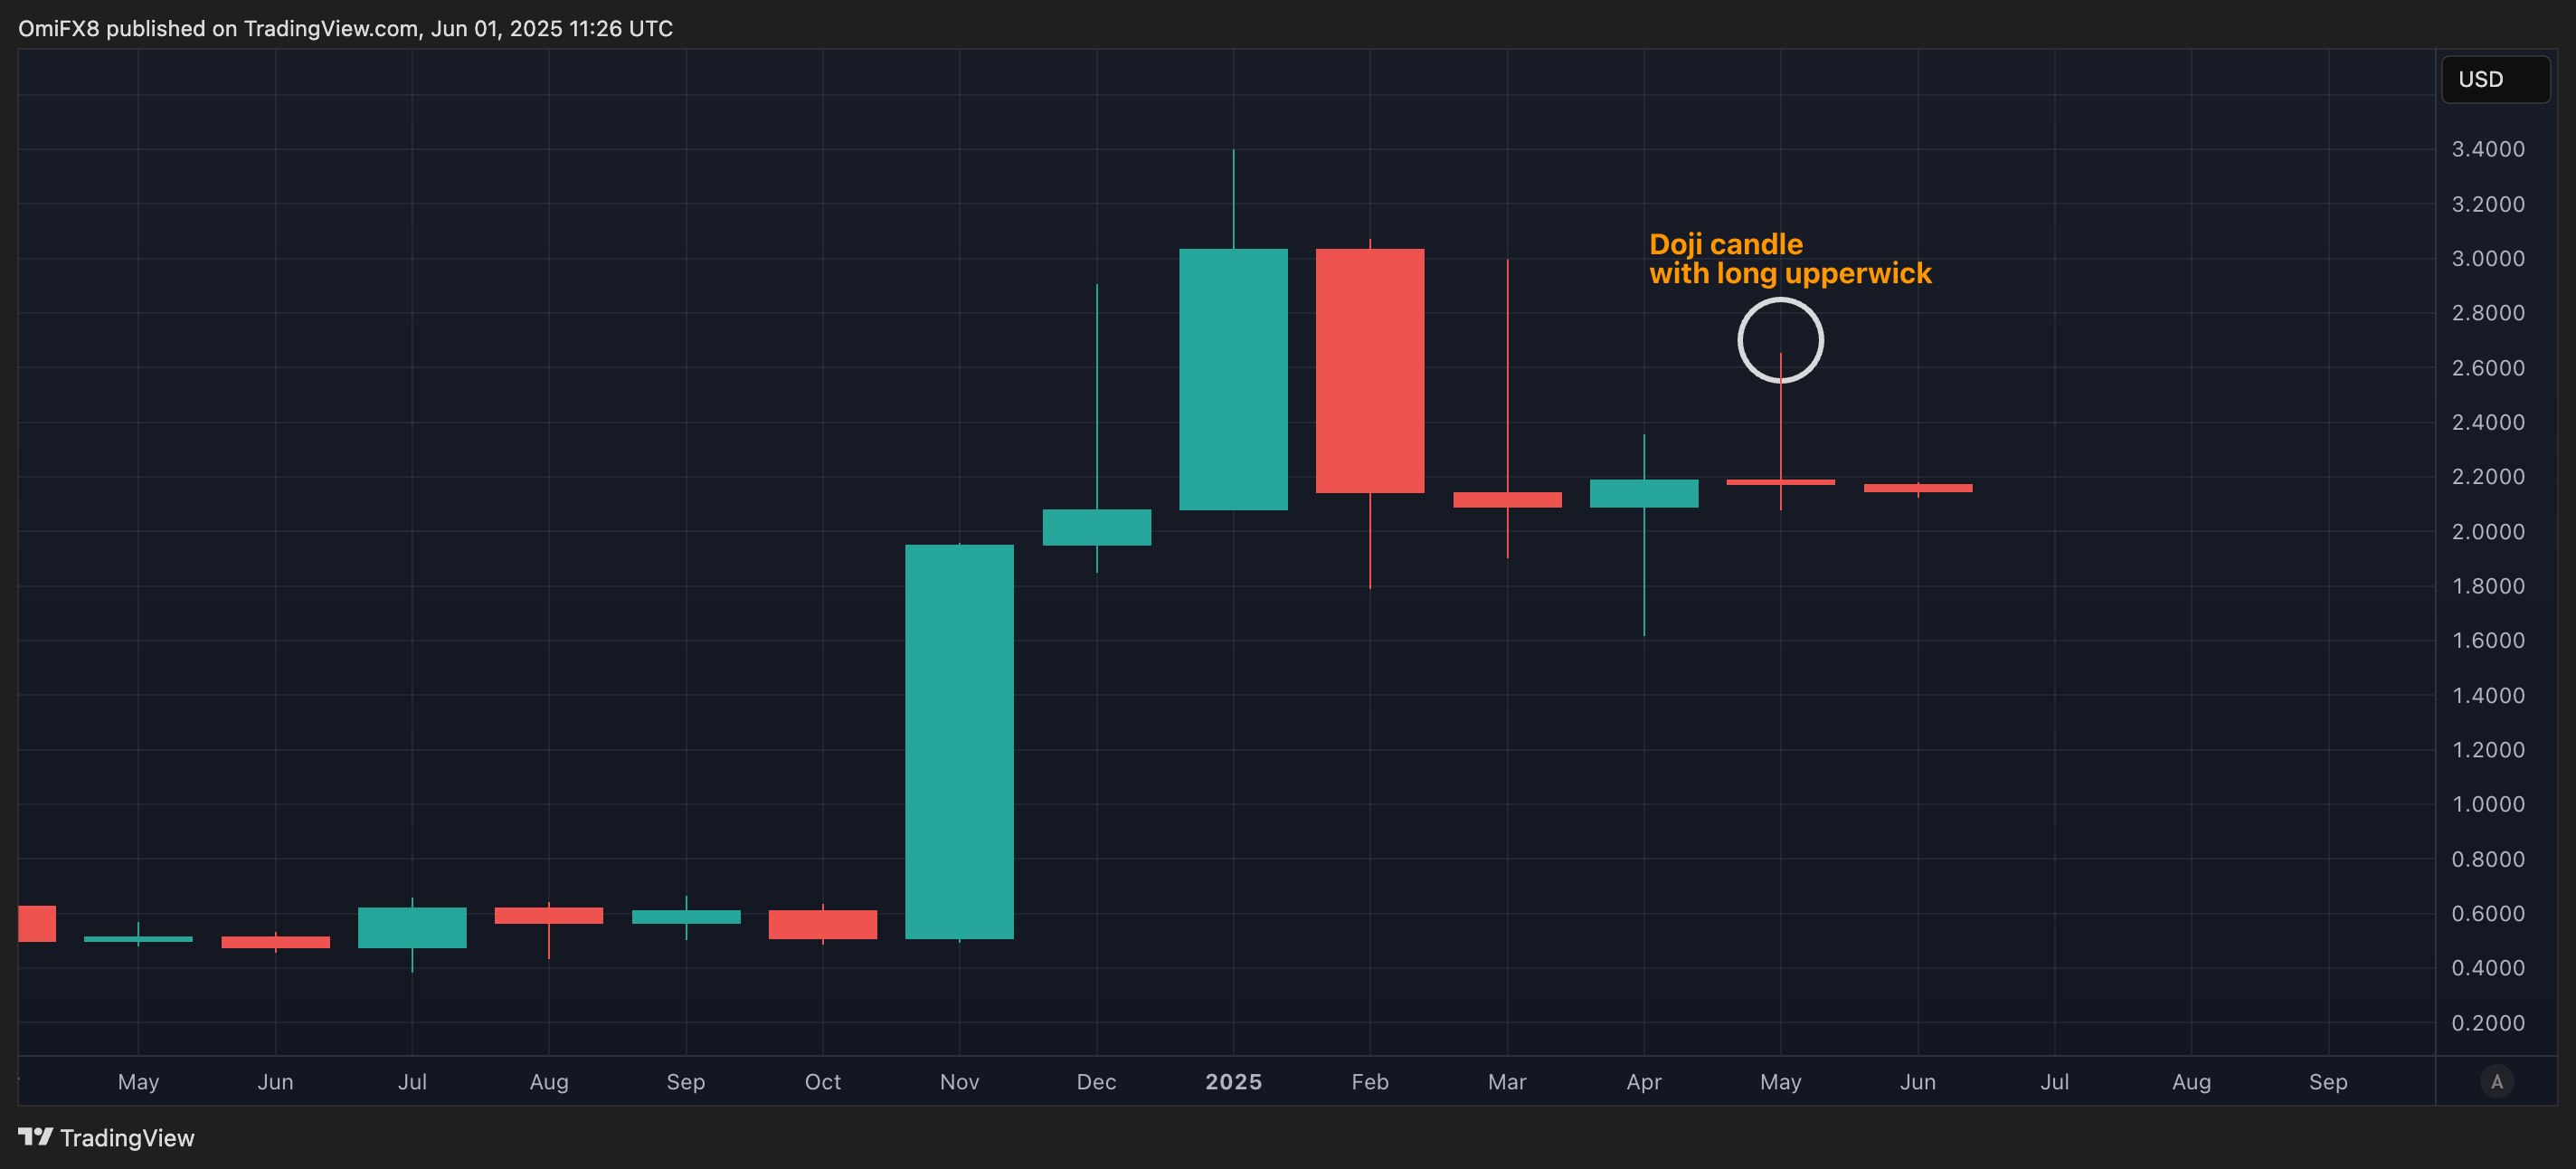
The appearance of the doji suggests the recovery rally from the early April lows near $1.60 has likely run out of steam. Doji candles appearing after uptrends often prompt technical analysts to call for bull exhaustion and a potential turn lower.
Accordingly, last week, some traders purchased the $ 2.40 strike put option expiring on May 30. A put option offers insurance against price drops.
Bullish options open interest
The overall picture remains bullish, with options open interest concentrated in higher-strike calls in a sign of persistent positive sentiment. Open interest refers to the number of active contracts at a given time. A call option gives the purchaser an asymmetric upside exposure to the underlying asset, in this case, XRP, representing a bullish bet.
«XRP open interest on Deribit is steadily increasing, with the highest concentration of strikes clustered on the upside between $2.60 and $3.0+, reflecting a notably bullish sentiment while the spot price currently trades at $2.16,» Luuk Strijers, CEO of Deribit, told CoinDesk.
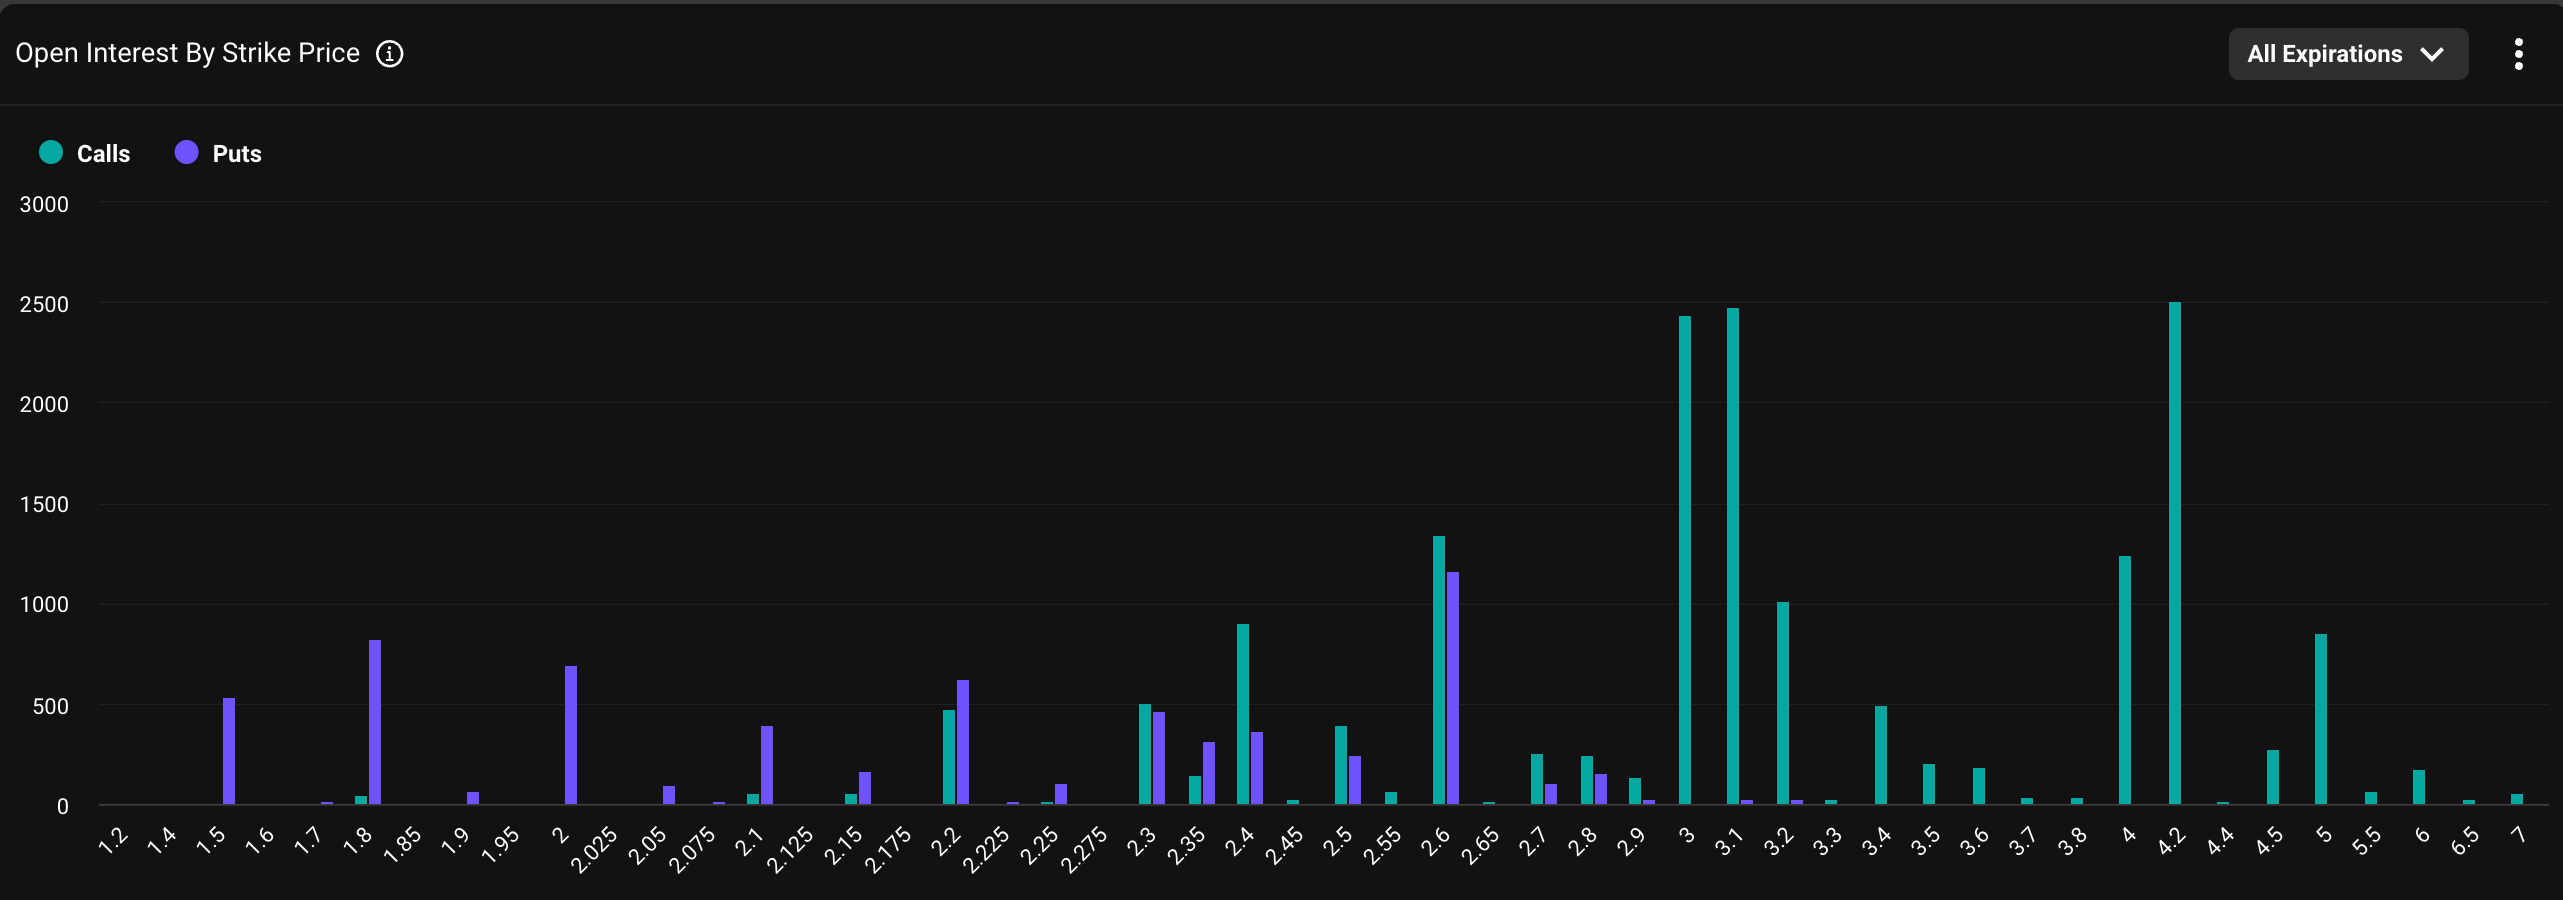
The chart shows that the $4 call option is the most popular, with a notional open interest of $5.39 million. Calls at the $3 and $3.10 strikes have an open interest (OI) of over $5 million each. Notional open interest refers to the dollar value of the number of active contracts.
«XRP option open interest is split across June and September expiries, with monthly notional volumes approximating $65–$70 million, of which over 95% is traded on Deribit,» Strijers said.
The bullish mood likely stems from XRP’s positioning as a cross-border payments solution and mounting expectations of a spot XRP ETF listing in the U.S. Furthermore, the cryptocurrency is gaining traction as a corporate treasury asset.
Ripple, which uses XRP to facilitate cross-border transactions, recently highlighted its potential to address inefficiencies in SWIFT-based cross-border payments. The B2B cross-border payments market is projected to increase to $50 trillion by 2031, up 58% from $31.6 trillion in 2024.
Uncategorized
ETH Price Dips Below $2,500 on Whale Exit Fears, Then Bounces Back Above Key Level

Ethereum (ETH) faced renewed downside pressure in late trading, tumbling below the $2,500 level as selling volume surged and broader risk sentiment weakened. Global trade tensions and renewed U.S. tariff risks have triggered risk-off flows, with digital assets increasingly mirroring traditional markets in their reaction to geopolitical uncertainty.
On-chain data revealed sizable inflows to centralized exchanges — most notably 385,000 ETH to Binance —a dding to speculation that institutional players may be trimming positions. Although ETH has since recovered modestly to trade around $2,506, market observers are closely watching whether buyers can defend this level or if another leg lower is imminent.
Technical Analysis Highlights
- ETH traded within a volatile $48.61 range (1.95%) between $2,551.09 and $2,499.09.
- Price action formed a bullish ascending channel before breaking down in the final hour.
- Heavy selling emerged near $2,550, with profit-taking accelerating into a sharp reversal.
- ETH dropped from $2,521.35 to $2,499.09 between 01:53 and 01:54, with combined volume exceeding 48,000 ETH across two minutes.
- Volume normalized shortly after, and price recovered slightly, consolidating around the $2,504–$2,508 band.
- The $2,500 level is now acting as interim support, though momentum remains fragile with signs of distribution still evident in recent volume patterns.
External References
- «Ethereum Price Analysis: Is ETH Dumping to $2K Next as Momentum Fades?«, CryptoPotato, published May 31, 2025.
- «Ethereum Bulls Defend Support – Key Indicator Hints At Short-Term Rally«, NewsBTC, published May 31, 2025.
-

 Fashion8 месяцев ago
These \’90s fashion trends are making a comeback in 2017
-

 Entertainment8 месяцев ago
The final 6 \’Game of Thrones\’ episodes might feel like a full season
-

 Fashion8 месяцев ago
According to Dior Couture, this taboo fashion accessory is back
-

 Entertainment8 месяцев ago
The old and New Edition cast comes together to perform
-

 Business8 месяцев ago
Uber and Lyft are finally available in all of New York State
-

 Sports8 месяцев ago
Phillies\’ Aaron Altherr makes mind-boggling barehanded play
-

 Entertainment8 месяцев ago
\’Better Call Saul\’ has been renewed for a fourth season
-

 Entertainment8 месяцев ago
Disney\’s live-action Aladdin finally finds its stars


