Uncategorized
Ether Likely Building Energy To Smash Through $3K

This is a daily technical analysis by CoinDesk analyst and Chartered Market Technician Omkar Godbole.
Ether ETH appears poised to surpass the $3,000 mark as it forms an «ascending triangle» pattern on the price chart.
The ascending triangle is characterized by horizontal upper-bound resistance or supply point that repeatedly caps gains and an upward-sloping support line.
Ether has faced resistance at $2,735 multiple times over the past two weeks, while subsequent reaction lows have been rising. The price action represents an ascending triangle.
The higher lows indicate that buying pressure is rising, which is what gives the ascending triangle its bullish nature. In other words, the pattern represents accumulation that usually sets the stage for the next leg of higher prices.
")
An expected breakout from the ascending triangle would signal a resumption of the rally from April lows near $1,390, opening the door for a move above $3,000.
The impending crossover of the 50-day simple moving average (SMA) above the 100-day SMA supports the bullish case.
The move could be explosive, as the gap between the Bollinger Bands has narrowed to nearly $250, which has consistently presaged volatility explosion since November.
Bollinger bands are volatility bands placed two standard deviations above and below the cryptocurrency’s 20-day Simple Moving Average (SMA).
«Upward breakouts occur 77% of the time, and breakouts happen roughly 61% of the distance from the base to the cradle,» Chartered Market Technician Charles Kirkpatrick wrote in his book on technical analysis.
A potential downside break of the triangular consolidation would negate the bull case and may invite stronger selling pressure.
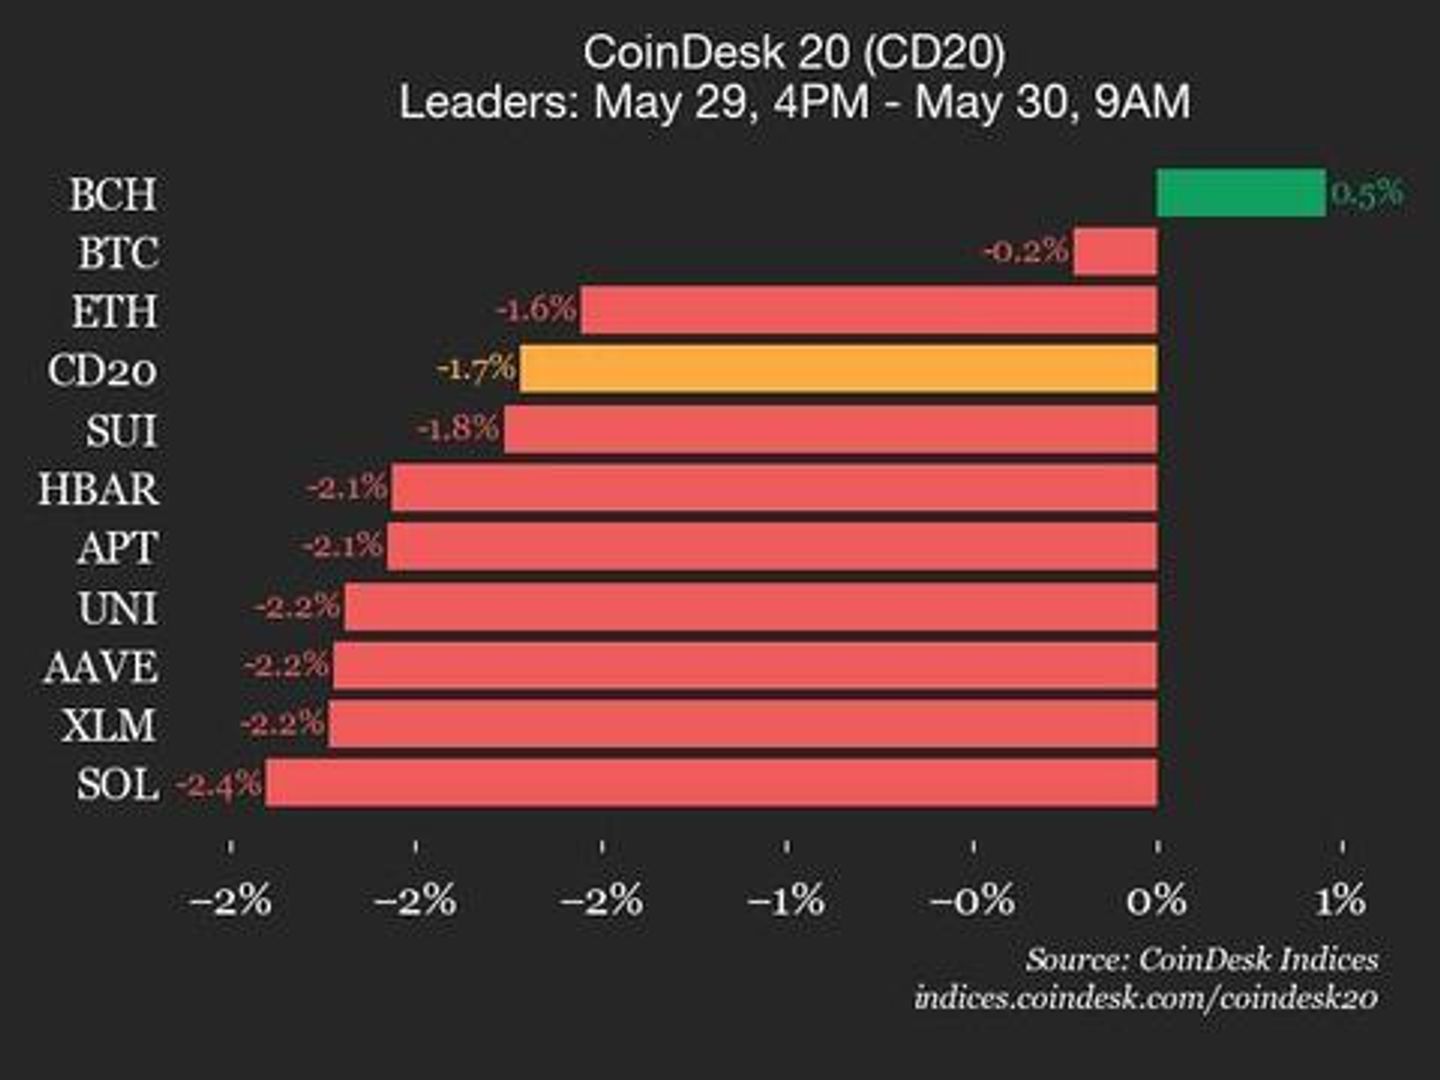
CoinDesk Indices presents its daily market update, highlighting the performance of leaders and laggards in the CoinDesk 20 Index.
The CoinDesk 20 is currently trading at 3130.42, down 1.7% (-54.58) since 4 p.m. ET on Thursday.
One of 20 assets are trading higher.

Leaders: BCH (+0.5%) and BTC (-0.2%).
Laggards: NEAR (-5.4%) and DOT (-5.3%).
The CoinDesk 20 is a broad-based index traded on multiple platforms in several regions globally.
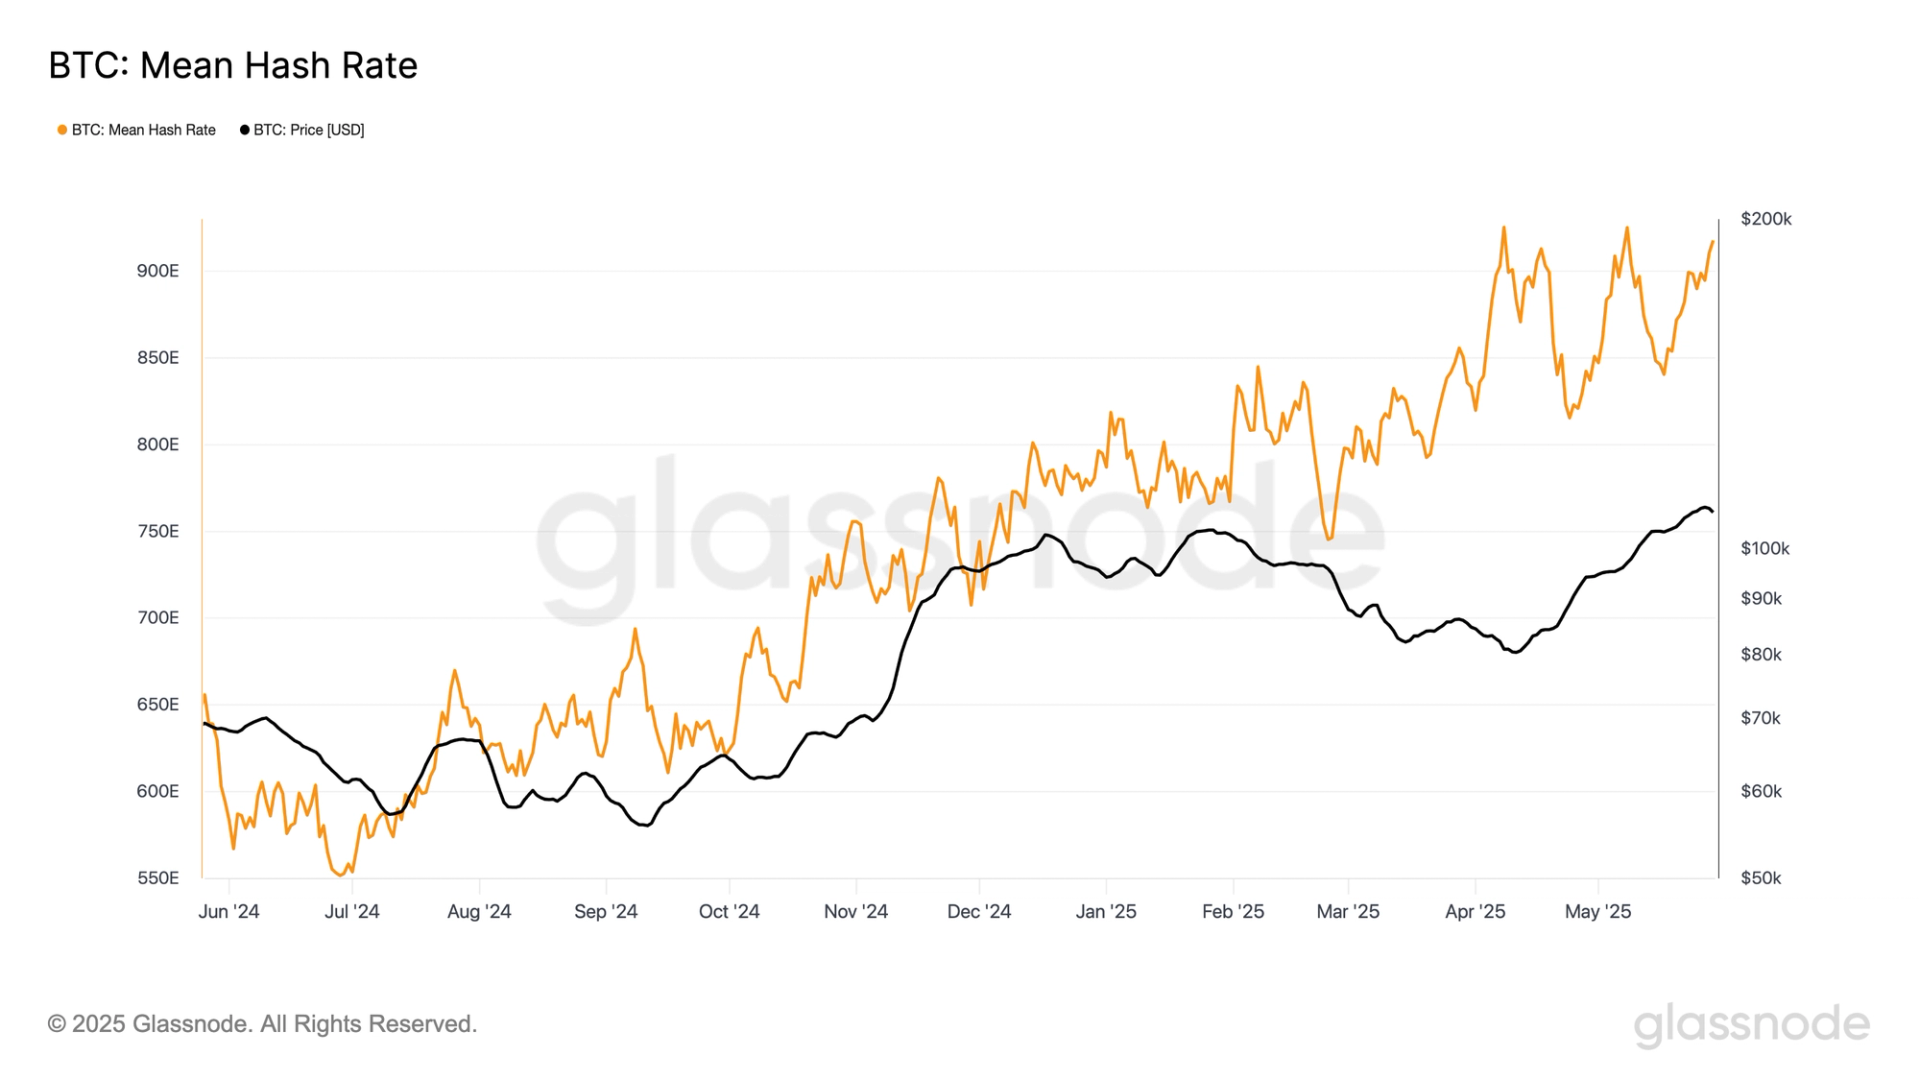
Bitcoin BTC mining difficulty is on track to reach a new all-time high sometime around midnight UTC in a sign of increased participation by miners that makes the blockchain more secure.
The adjustment is likely to finalize within the next 100 blocks, with projections showing the measure will rise about 4% to 126.95 trillion (T), eclipsing the current 123 T record. Difficulty was 109 T at the start of the year, according to Coinwarz.
The increase reflects growing long-term confidence in bitcoin’s value, even as on-chain activity and transaction fees remain low.
Difficulty is adjusted every 2,016 blocks, and is driven by the network hashrate, which measures the total computational power dedicated to securing the network. The hashrate’s seven-day moving average is now 918 exahashes per second (EH/s), having risen from 840 (EH/s) over the past two weeks. With previous peaks at 925 EH/s, any further increase would mark a new record high in hashrate.
Despite the increase in mining activity, transaction fees remain exceptionally low. A high-priority transaction currently requires only 2 satoshis per virtual byte (sat/vB), equating to roughly $0.30. The higher the fee, the faster a transaction will be confirmed, as miners prioritize transactions that pay more.
These figures suggest that while transaction demand on the Bitcoin network is subdued, mining power continues to scale to new heights, highlighting a divergence between usage and infrastructure growth.
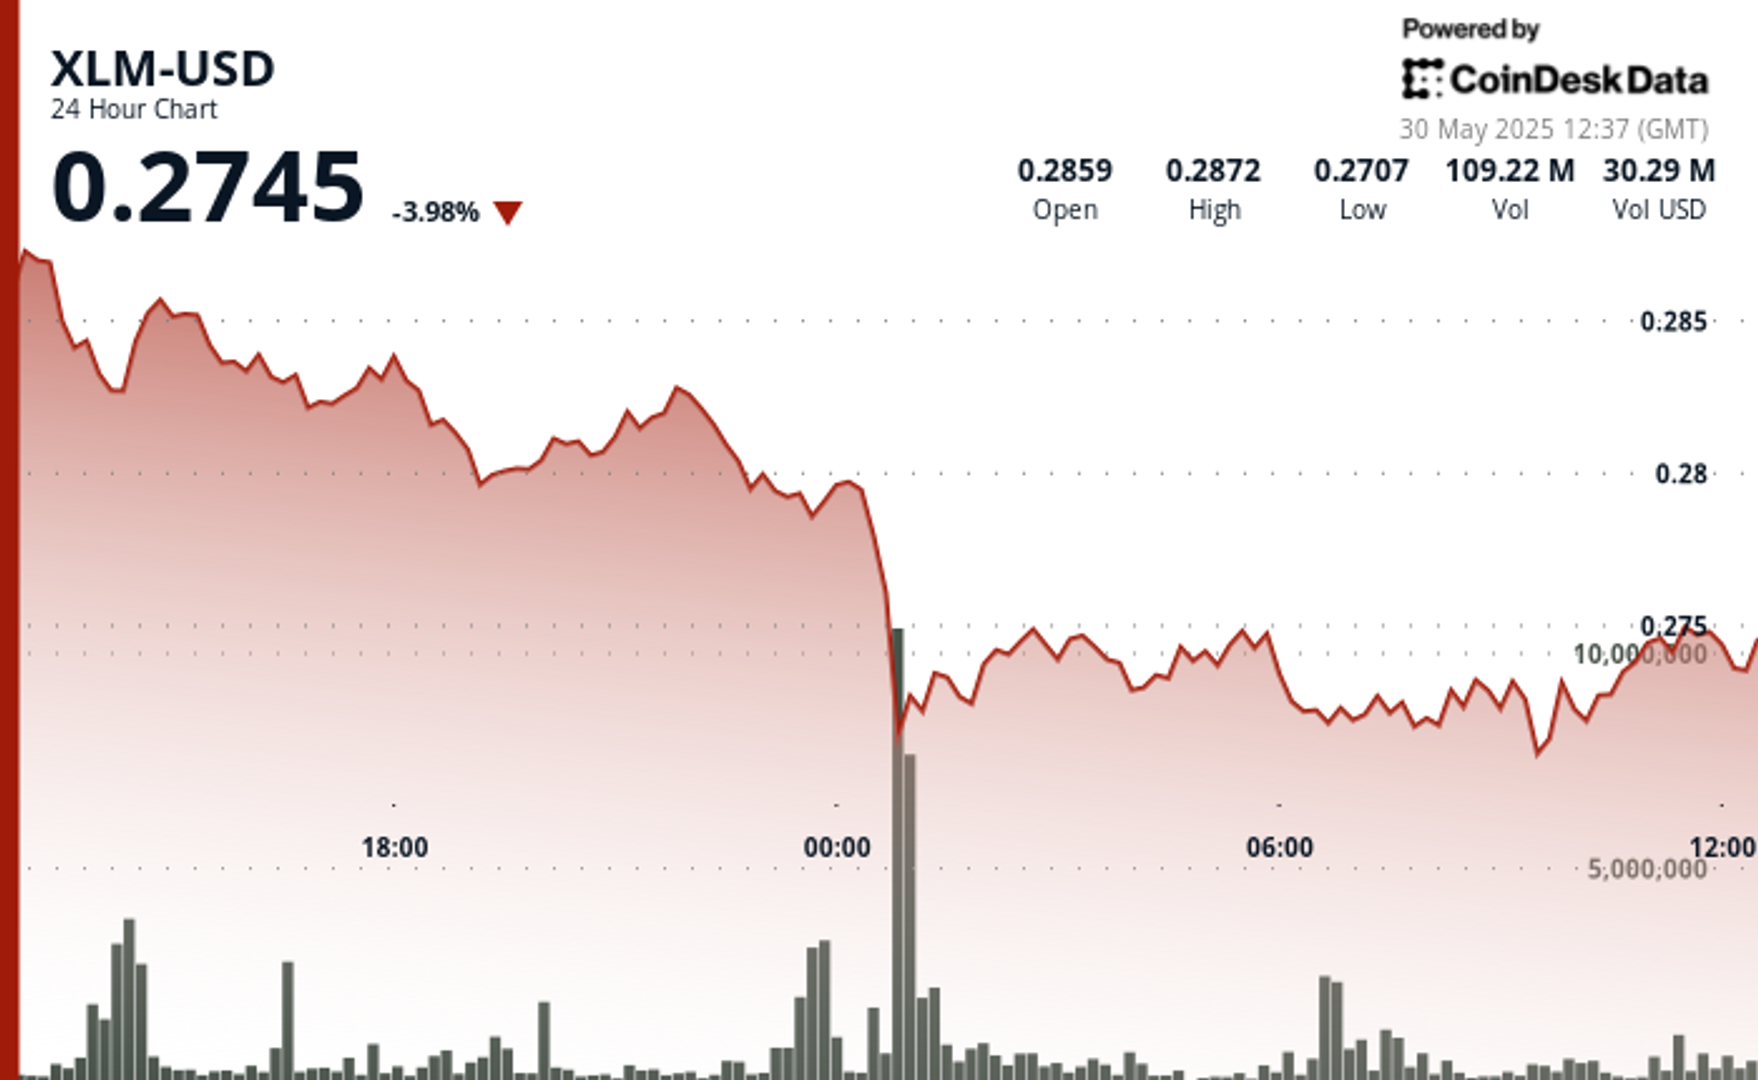
Stellar’s native token XLM fell along with the broader market in the past 24 hours, with large volumes occurring at the turn of the day. The decline happened even as Rain, the global card issuing platform powered by stablecoins, announced Thursday support for Stellar alongside integration with Solana and Tron.
XLM has plummeted 7% over 24 hours, dropping from 0.288 to 0.271, with exceptionally high selling volume. The cryptocurrency dived out of a trendline, marking the recovery from April lows, mimicking a pattern seen in payments-focused cryptocurrency XRP.
Still, despite the price drop, Stellar’s integration with Rain offers a rare bright spot in an otherwise dour market sentiment. The integration is a meaningful step toward mainstream adoption, allowing users to spend stablecoins held on these high-throughput networks for everyday purchases.
Technical Analysis
- XLM-USD experienced a significant 7% decline over 24 hours, dropping from 0.288 to 0.271.
- An exceptionally high selling volume of 76.9M occurred at midnight (00:00), establishing strong resistance at 0.280.
- Support emerged around 0.270-0.271, with substantial buying volume (74.7M) during the 01:00 hour.
- Price formed a critical support zone at 0.270-0.271 that was tested multiple times with high volume.
- A temporary recovery began at 09:43, forming an ascending channel pattern before selling pressure returned.
- The final hour showed volatile trading, with prices dropping to 0.270 before recovering slightly to 0.273, then falling back to 0.271 on high volume (2.24M).


CoinDesk 20 Performance Update: NEAR Drops 5.4% as Almost All Assets Trade Lower

Bitcoin Mining Difficulty Is Set to Reach Record High Amid Surging Hashrate

Stellar’s Midnight Mayhem: XLM Plunged 6% on High-Volume Despite Rain Integration
-

 Fashion8 месяцев ago
These \’90s fashion trends are making a comeback in 2017
-
Entertainment8 месяцев ago
The final 6 \’Game of Thrones\’ episodes might feel like a full season
-
Fashion8 месяцев ago
According to Dior Couture, this taboo fashion accessory is back
-
Entertainment8 месяцев ago
The old and New Edition cast comes together to perform
-
Business8 месяцев ago
Uber and Lyft are finally available in all of New York State
-
Sports8 месяцев ago
Phillies\’ Aaron Altherr makes mind-boggling barehanded play
-
Entertainment8 месяцев ago
\’Better Call Saul\’ has been renewed for a fourth season
-
Sports8 месяцев ago
Steph Curry finally got the contract he deserves from the Warriors