Uncategorized
Watch Out Bitcoin Bulls, $99.9K Price May Test Your Mettle

The recent bitcoin (BTC) price rally above $90,000 might have some holders eyeing a run to a new record topping the $109,000 hit in January.
However, the path higher may not be so straightforward. The latest analysis by Glassnode shows potential for increased selling pressure from some groups of market participants at around $99,900.
For a start, long-term holders — defined by Glassnode as wallets that have held coins for at least 155 days — may take profits at $99,900. This aligns with their historical behavior of selling at price levels that deliver roughly 350% paper gains.
«Historically, LTHs begin distributing more aggressively around a 350% unrealized profit margin, which aligns with a $BTC price of ~$99.9k. As the market nears this level, increased sell-side pressure is likely, requiring strong demand to absorb it,» Glassnode said in an analysis post on X.
A second source of selling pressure could be wallets that acquired coins early this year, when the largest cryptocurrency traded between $95,000 and $98,000. They weathered the sell-off to $75,000 last month and may be tempted to exit their positions at the breakeven or minor profit, at least partially. That’s consistent with the behavioral aspects of trading, which suggests investors are quick to take gains while holding on to losing positions.
«A large cluster of coins was acquired between $95k–$98k, meaning some $BTC holders may exit at breakeven. This, combined with rising LTH profits, creates a key resistance zone,» Glassnode said. «A clean breakout could open the path to price discovery above $100k.»
Read more: Bitcoin Traders’ Favorite Lottery Ticket for the First Half of the Year — The $300K BTC Call
Bitcoin (BTC) is now up 3% since the beginning of May, after gaining 14% gain in April.
Inflows into BTC exchange-traded funds (ETFs) have accelerated over the past two weeks, while consistent bitcoin treasury accumulation continues to support the market.
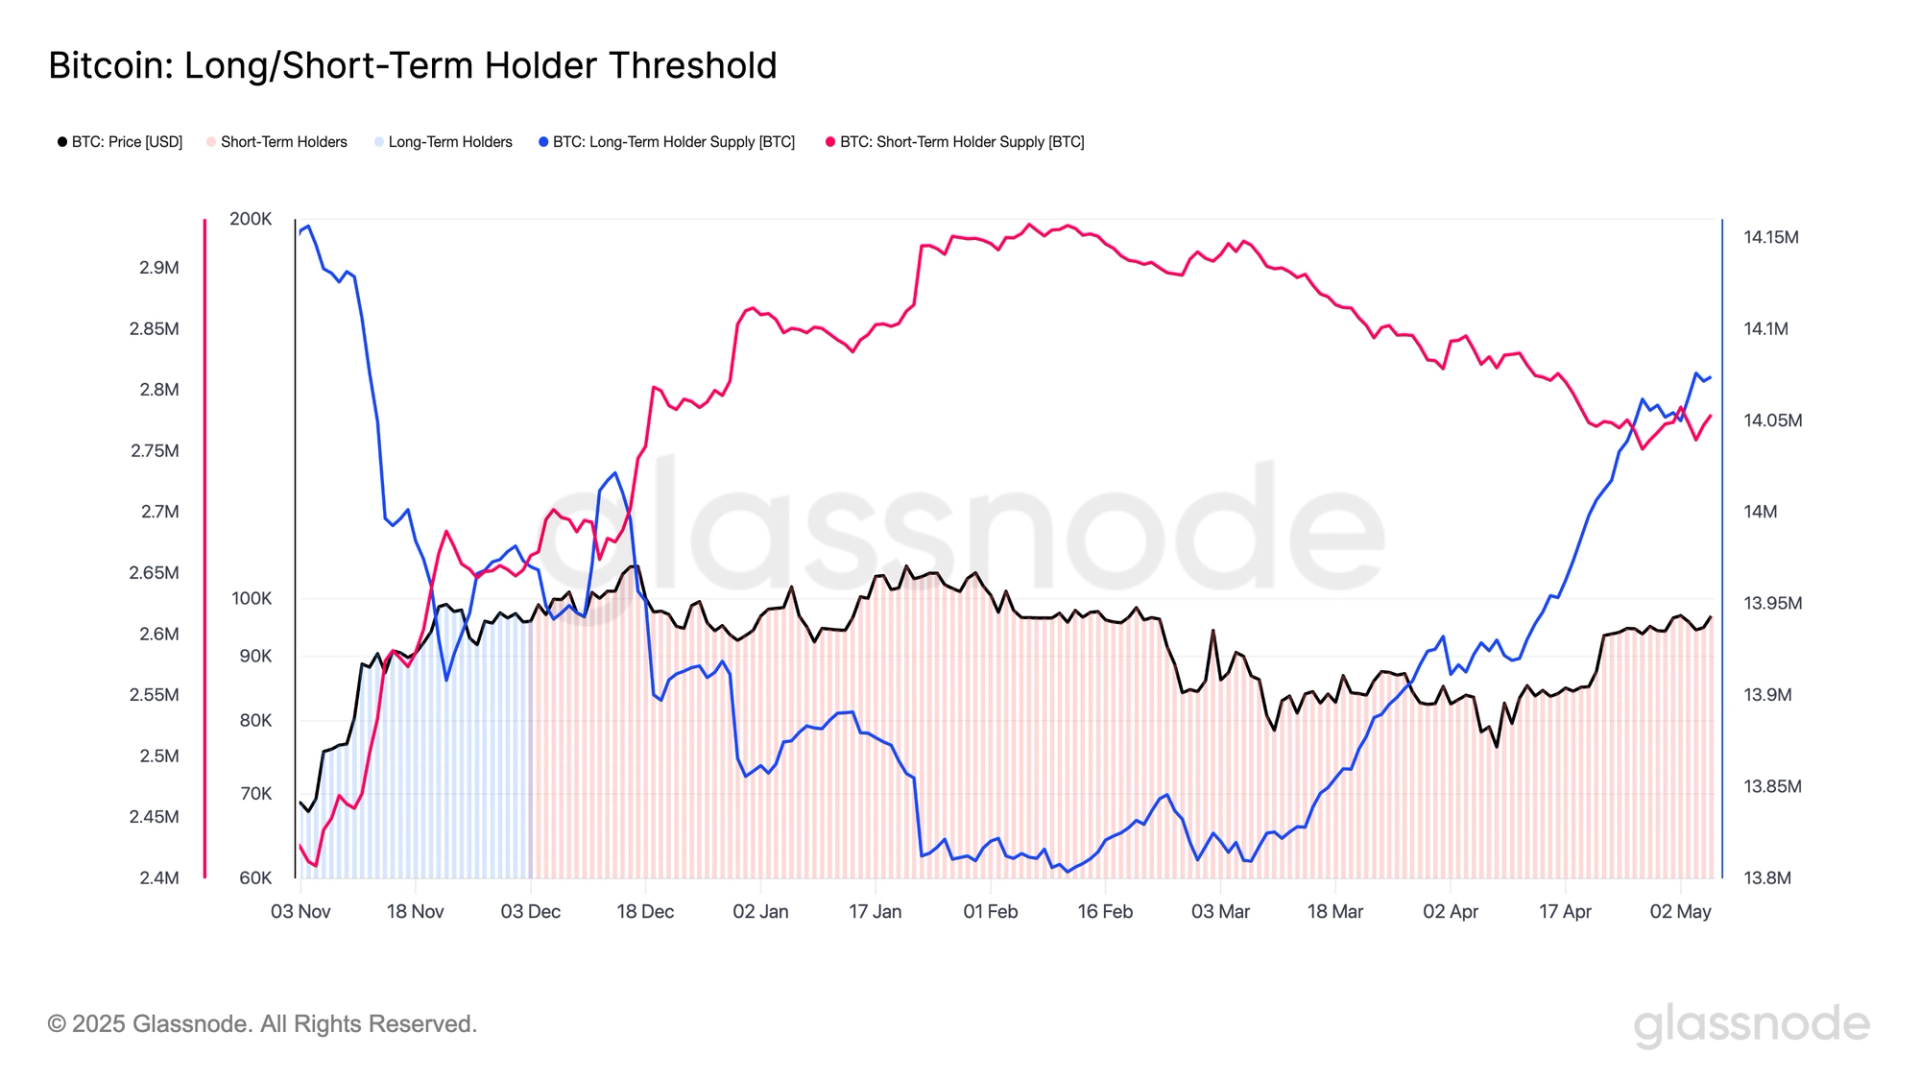
From an on-chain perspective, Glassnode data shows that both short-term holders (STHs) and long-term holders (LTHs) have increased their supply holdings, LTHs since early March, while STHs have begun accumulating over the past week.
Glassnode defines LTHs as investors who have held BTC for 155 days or more, while STHs have held for less than 155 days. In their latest weekly report, Glassnode notes that LTHs have increased their holdings by over 250,000 BTC, since the start of March, taking the cohort’s total supply to over 14 million BTC.
«This suggests a degree of confidence has returned, and accumulation pressures are outweighing the propensity for investors to spend and de-risk,” according to Glassnode.
While STHs often act in opposition to LTHs, they too have shown signs of renewed accumulation, adding over 25,000 BTC in the past week. This marks a reversal from the net distribution of more than 200,000 BTC that began in February 2025, coinciding with the onset of bitcoin’s 30% drawdown.
With BTC currently flirting with the $97,000 level, this broad-based accumulation indicates a restoration of confidence across investor cohorts. However, Glassnode also identifies a major resistance level at $99,900, where long-term holders may begin to realize profits when they start to hold a +350% unrealized profit margin, according to Glassnode data.
“As such, we can anticipate an uptick in sell-side pressure as the market approaches this zone, making it an area that will likely require substantial buy-side demand to absorb the distribution, and sustain upwards momentum».
Read more: Massive Bitcoin Bull Run Ahead? Two Chart Patterns Mirror BTC’s Rally to $109K
Global payments service provider Visa’s (V) venture capital arm made a strategic investment in BVNK, a startup building stablecoin-based payment infrastructure, in a move that reflects legacy financial financial firms’ push into blockchain-powered money movement.
«Visa’s deep expertise in building global payment networks, combined with our stablecoin infrastructure, creates powerful possibilities for redefining how businesses operate in today’s digital economy,» BVNK co-founder and CEO Jesse Hemson-Struthers wrote in a blog post on Wednesday.
A BVNK spokesperson confirmed in an email that the deal has closed but declined to reveal the size of the investment.
BVNK builds software that allows businesses to send and receive stablecoins — crypto tokens pegged to fiat currencies like the U.S. dollar — across global markets. The London-based company said it’s already processing $12 billion in annualized stablecoin volume, and has recently expanded into the U.S. with offices in New York and San Francisco. It has applied for licenses in all U.S. states, securing approval in several.
The backdrop to this deal is a broader shift in finance. Blockchain rails and stablecoins have become increasingly central to payments, offering faster, cheaper alternative to traditional channels for uses like remittances, payroll and commerce. Global firms are racing to jump on the trend: Payments giant Stripe is testing a stablecoin tool following its $1.1 billion acquisition of Bridge; PayPal introduced its own stablecoin; and Visa has developed a platform to help banks issue stablecoins and tokenized assets.
«Stablecoins are fast becoming a part of global payment flows, and Visa invests in new technologies and builders like BVNK, staying at the forefront of what’s next in commerce to better serve our clients and partners,» said Rubail Birwadker, head of growth products and partnerships at Visa.
The investment follows BVNK’s $50 million fundraising round last year with backers including Haun Ventures and Tiger Global.
Read more: Stablecoins Could Bring ‘ChatGPT’ Moment to Blockchain Adoption, Hit $3.7T by 2030: Citi

This is a daily technical analysis by CoinDesk analyst and Chartered Market Technician Omkar Godbole.
Crypto bears might want to closely watch bitcoin’s (BTC) recent chart patterns, which mirror those that preceded the late 2024 rally from $70,000 to $109,000.
The first pattern involves the weekly chart’s Moving Average Convergence Divergence (MACD) histogram, a momentum indicator used to identify trend changes and reversals. MACD crossovers above or below the zero line typically signal bullish or bearish shifts in momentum.
However, traders interpret these signals in context with price action. A bearish crossover, for example, needs validation through weakening prices; otherwise, it could indicate underlying strength and a bear trap. Currently, that seems to be the case in BTC.
The cryptocurrency initially fell after the MACD flipped negative in mid-February, but quickly found support at the 50-week simple moving average (SMA) in March and has since bounced back above $ 90k. All the while, the MACD has held below zero.
This pattern is reminiscent of last August and September, when prices held the SMA support amid persistent bearish MACD signals. The indicator flipped bullish around mid-October, confirming the trend with a rally from $70K to $100K by December.
. (TradingView/CoinDesk)")
The second pattern involves the 50- and 200-day SMAs. About four weeks ago, these averages formed a bearish crossover—commonly known as the death cross—signaling a potential long-term downtrend. However, this turned out to be a bear trap, with bitcoin finding support around $75K and reversing course.
Recently, the 50-day SMA has begun to rise again and could soon cross above the 200-day SMA, setting up a bullish golden cross in the coming weeks.
This pattern closely mirrors last year’s trend: the death cross in August marked a bottom, quickly followed by a golden cross that sparked a breakout above $70K and ultimately led to a rally above $109K to new highs.
In other words, bullish volatility could be on the horizon, potentially taking bitcoin well past the January high of $109K.
Chart patterns are commonly used to assess market strength and forecast future movements. However, it’s important to remember that history doesn’t always repeat itself, and macroeconomic factors can rapidly swing market directions, making chart analysis far from foolproof.
. (TradingView/CoinDesk)")


Bitcoin Accumulation Strengthens as BTC Approaches Key Resistance

Visa Doubles Down on Stablecoins With Investment in Blockchain Payments Firm BVNK

Massive Bitcoin Bull Run Ahead? Two Chart Patterns Mirror BTC’s Rally to $109K
-

 Fashion7 месяцев ago
These \’90s fashion trends are making a comeback in 2017
-
Entertainment7 месяцев ago
The final 6 \’Game of Thrones\’ episodes might feel like a full season
-
Fashion7 месяцев ago
According to Dior Couture, this taboo fashion accessory is back
-
Entertainment7 месяцев ago
The old and New Edition cast comes together to perform
-
Business7 месяцев ago
Uber and Lyft are finally available in all of New York State
-
Sports7 месяцев ago
Phillies\’ Aaron Altherr makes mind-boggling barehanded play
-
Entertainment7 месяцев ago
Disney\’s live-action Aladdin finally finds its stars
-
Sports7 месяцев ago
Steph Curry finally got the contract he deserves from the Warriors