Uncategorized
Mike Novogratz’s Galaxy Digital Swaps $100M ETH for SOL, On-Chain Data Shows
Mike Novogratz’s Galaxy Digital has apparently swapped $100 million worth of ether (ETH) for solana’s SOL.
According to Wu Blockchain, on-chain data suggests that Galaxy has swapped out a considerable amount of its ETH holdings for SOL. Over the last two weeks, Galaxy has transferred 65,600 ETH – or about $105 million – to Binance and has withdrawn 752,240 SOL (approximately $98.37 million).
Galaxy may have made the move because ETH continues to be in «structural decline» according to a recent note from Standard Chartered, which slashed its year-end target price for the asset.
Data from an Arkham dashboard shows that the firm holds $87.9 million ETH versus $23.86 million SOL.
Galaxy did not immediately return a request for comment from CoinDesk.
Market data shows that in the last month, SOL is up 8% while ETH is down nearly 20%.
")
Standard Chartered estimated in its note that Base has cut $50 billion from its market cap, but also argued that tokenized real-world assets could help stabilize Ethereum.
Many blockchain metrics would support Standard Chartered’s thesis, as transactions on Solana have rocketed past Ethereum in the last three months.
")
A Dune dashboard shows that decentralized exchange (DEX) volume on Solana has moved past $500 billion in the last three months, while DEX volume on Ethereum is less than $400 billion. Active addresses on Solana are over 220 million while Ethereum and Ethereum Layer-2 addresses are just over 80 million.
One idea, first proposed by Tron’s Justin Sun, to reverse this «structural decline» of Ethereum has been a tax on Layer-2s.
«All collected taxes will be used to repurchase ETH and burn it in a fully decentralized manner,» he wrote on X. This idea, however, hasn’t been formalized into an Ethereum Improvement Proposal (EIP) which would be the first step in it becoming reality.
Meanwhile, flow data from the Ether ETFs shows that investors moved nearly $600 million out of these listed products over the last two months.
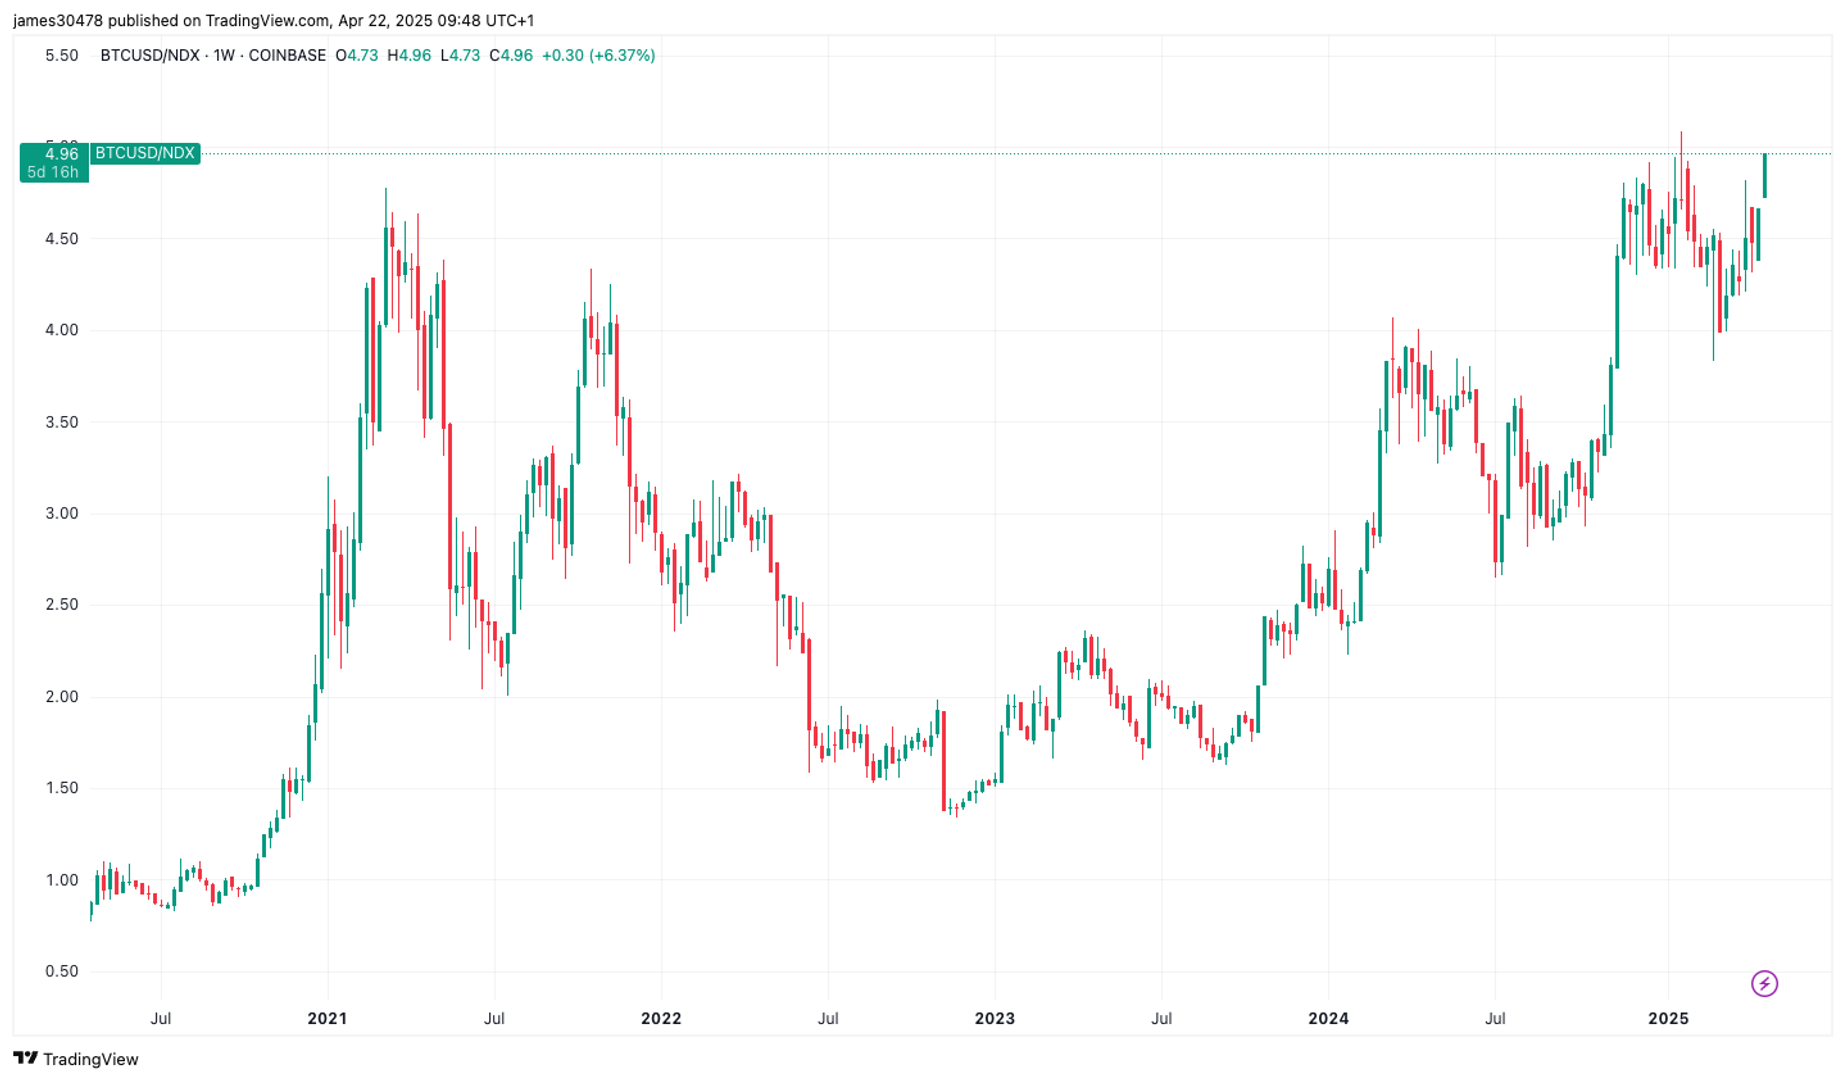
Bitcoin (BTC) is on the cusp of breaking out relative to the Nasdaq 100 Composite, with the current BTC/Nasdaq ratio sitting at 4.96. This means it now takes nearly five Nasdaq units to match the value of one bitcoin. The previous record of 5.08 was set in January 2025, when bitcoin hit its all-time high of over $109,000.
Historically, each market cycle has seen the ratio reach new highs—2017, 2021, and now 2025—highlighting bitcoin’s continued outperformance against the Nasdaq.
Across multiple timeframes, bitcoin is increasingly diverging from U.S. tech stocks. Year-to-date, bitcoin is down just 6%, compared to the Nasdaq’s 15% decline. Since Donald Trump’s election victory in November 2024, bitcoin has rallied 30%, while the Nasdaq has fallen 12%.
When measured against the «Magnificent Seven» mega-cap tech stocks, bitcoin remains around 20% below its all-time high from February this year. This indicates that while bitcoin has shown strength, the top tech names are holding up better than the broader Nasdaq Composite.
Strategy (MSTR), a well-known proxy for bitcoin exposure, is also holding up better than the U.S tech stocks. Since joining the QQQ ETF on Dec. 23, MSTR is down 11%, while the ETF itself has dropped over 16%. The divergence has become more pronounced in 2025: MSTR is up 6% year-to-date, compared to QQQ’s 15% decline.

This is a daily technical analysis by CoinDesk analyst and Chartered Market Technician Omkar Godbole.
Bitcoin’s (BTC) bullish advance has encountered a resistance zone above $88,000, marked by crucial levels that could make or break the ongoing recovery rally.
The resistance cluster’s first and perhaps most critical level is the 200-day simple moving average (SMA) at $88,356. The SMA is widely regarded as a key indicator of long-term momentum. Early this month, Coinbase institutional analysts called the downside break of the 200-day SMA in March a sign of the onset of a potential crypto winter.
So, a fresh move above the 200-day SMA could be taken to represent a renewed bullish shift in momentum.
Such a move would trigger a dual breakout, as the Ichimoku cloud’s upper end is located close to the 200-day SMA. A move above the Ichimoku cloud is also said to reflect a bullish shift in momentum.
Developed by a Japanese journalist in the 1960s, the Ichimoku cloud is a technical analysis indicator that offers a comprehensive view of market momentum, support, and resistance levels. The indicator comprises five lines: Leading Span A, Leading Span B, Conversion Line or Tenkan-Sen (T), Base Line or Kijun-Sen (K) and a lagging closing price line. The difference between Leading Span A and B forms the Ichimoku Cloud.
The third and final level forming the resistance cluster is the high of $88,804 on March 24, from where the market turned lower and fell back to $75,000.
")
A make-or-break resistance zone?
Behavioural aspects of trading come into play when an asset approaches a resistance zone, especially at key levels like the 200-day SMA and the Ichimoku cloud.
Prospect theory suggests that people are typically risk-averse with respect to gains and risk-seeking with respect to losses, known as the “reflection effect.» So, as traders, people tend to be risk-averse while locking in profits and keep losing trades open.
This tendency is amplified when an asset encounters a significant resistance zone. Traders who entered the bitcoin market around $75K, anticipating a rebound, may feel pressured to take profits as the price approaches this resistance. Such selling could, in turn, slow the price ascent or even trigger a new downturn.
Conversely, if bitcoin successfully breaks through the resistance zone, the fear of missing out could prompt more traders to make bullish bets, further fueling bullish momentum and pushing the price higher.

Bithumb plans to split its core crypto exchange business from other activities as it reorganizes in preparation for an initial public offering (IPO).
The Seoul-based company will split in two, with Bithumb Korea focusing solely on operating the core crypto exchange business. Bithumb Korea will be the entity seeking a public listing, local media reported, citing the country’s corporate registry.
The other unit, a newly created company called Bithumb A, will oversee venture investments, asset management and new business initiatives. The restructuring is set to take effect on July 31.
Bithumb A will consolidate the exchange’s investment arms, including Bithumb Partners, which has shifted from NFT and metaverse projects to financial product investments such as equities, bonds and convertible bonds. According to local media, Bithumb is in talks with licensed entities to offer these services in the country.
Bithumb Investment, which manages equity stakes and strategic partnerships with external companies, will also fall under Bithumb A’s oversight.
Last year Bithumb was said to be considering a NASDAQ listing, but now its plans have shifted to a listing on South Korea’s Kosdaq first, with a U.S. listing as a secondary objective.
Bithumb posted an operating profit of 130.8 billion won ($95 million) in 2024, reversing a 149 billion-won loss from the previous year, local media reported.


Bitcoin Closing In on Historic Breakout vs Nasdaq

Bitcoin Runs Into Resistance Cluster Above $88K. What Next?

Bithumb to Split in Two as Crypto Exchange Inches Toward South Korean IPO
-

 Fashion6 месяцев ago
These \’90s fashion trends are making a comeback in 2017
-
Entertainment6 месяцев ago
The final 6 \’Game of Thrones\’ episodes might feel like a full season
-
Fashion6 месяцев ago
According to Dior Couture, this taboo fashion accessory is back
-
Entertainment6 месяцев ago
The old and New Edition cast comes together to perform
-
Sports6 месяцев ago
Phillies\’ Aaron Altherr makes mind-boggling barehanded play
-
Business6 месяцев ago
Uber and Lyft are finally available in all of New York State
-
Entertainment6 месяцев ago
Disney\’s live-action Aladdin finally finds its stars
-
Sports6 месяцев ago
Steph Curry finally got the contract he deserves from the Warriors