Uncategorized
FBI Arrests Alleged SEC Hacker Linked to Fake Tweet Saying Bitcoin ETFs Were Approved

When Core Scientific signed a $3.5 billion deal to host artificial intelligence (AI) data centers earlier this year, it wasn’t chasing the next crypto token — it was chasing a steadier paycheck. Once known for its vast fleets of bitcoin mining rigs, the company is now part of a growing trend: converting energy-intensive mining operations into high-performance AI facilities.
Bitcoin miners like Core, Hut 8 (HUT) and TeraWulf (WULF) are swapping ASIC machines — the dedicated bitcoin mining computer — for GPU clusters, driven by the lure of AI’s explosive growth and the harsh economics of crypto mining.
Power play
It’s no secret that bitcoin mining requires an extensive amount of energy, which is the biggest cost of minting a new digital asset.
Back in the 2021 bull run, when the Bitcoin network’s hashrate and difficulty were low, miners were making out like bandits with margins as much as 90%. Then came the brutal crypto winter and the halving event, which slashed the mining reward in half. In 2025, with surging hashrate and energy prices, miners are now struggling to survive with razor-thin margins.
However, the need for power—the biggest input cost—became a blessing in disguise for these miners, who needed a different strategy to diversify their revenue sources.
Due to rising competition for mining, the miners continued to procure more machines to stay afloat, and with it came the need for more megawatts of electricity at a cheaper price. Miners invested heavily in securing these low-cost energy sources, such as hydroelectric or stranded natural gas sites, and developed expertise in managing high-density cooling and electrical systems—skills honed during the crypto boom of the early 2020s.
This is what captured the attention of AI and cloud computing firms. While bitcoin relies on specialized ASICs, AI thrives on versatile GPUs like Nvidia’s H100 series, which require similar high-power environments but for parallel processing tasks in machine learning. Instead of building out data centers from scratch, taking over mining infrastructure, which already has power ready, became a faster way to grow an increasing appetite for AI-related infrastructure.
Essentially, these miners aren’t just pivoting—they’re retrofitting.
The cooling systems, low-cost energy contracts, and power-dense infrastructure they built during the crypto boom now serve a new purpose: feeding the AI models of companies like OpenAI and Google.
Firms like Crusoe Energy sold off mining assets to focus solely on AI, deploying GPU clusters in remote, energy-rich locations that mirror the decentralized ethos of crypto but now fuel centralized AI hyperscalers.
Terraforming AI
Bitcoin mining has effectively «terraformed» the terrain for AI compute by building out scalable, power-efficient infrastructure that AI desperately needs.
As Nicholas Gregory, Board Director at Fragrant Prosperity, noted, «It can be argued bitcoin paved the way for digital dollar payments as can be seen with USDT/Tether. It also looks like bitcoin terraformed data centres for AI/GPU compute.»
This pre-existing «terraforming» allows miners to retrofit facilities quickly, often in under a year, compared to the multi-year timelines for traditional data center builds. Firms like Crusoe Energy sold off mining assets to focus solely on AI, deploying GPU clusters in remote, energy-rich locations that mirror the decentralized ethos of crypto but now fuel centralized AI hyperscalers.
Higher returns
In practice, it means miners can flip a facility in less than a year—far faster than the multi-year timeline of a new data center.
But AI isn’t a cheap upgrade.
Bitcoin mining setups are relatively modest, with costs ranging from $300,000 to $800,000 per megawatt (MW) excluding ASICs, allowing for quick scalability in response to market cycles. Meanwhile, AI infrastructure demands significantly higher capex due to the need for advanced liquid cooling, redundant power systems, and the GPUs themselves, which can cost tens of thousands per unit and face global supply shortages. Despite the steeper upfront costs, AI offers miners up to 25 times more revenue per kilowatt-hour than bitcoin mining, making the pivot economically compelling amid rising energy prices and declining crypto profitability.
A niche industry worth billions
As AI continues to surge and crypto profits tighten, bitcoin mining could become a niche game—one reserved for energy-rich regions or highly efficient players, especially as the next in 2028 could render many operations unprofitable without breakthroughs in efficiency or energy costs.
While projections show the global crypto mining market growing to $3.3 billion by 2030, at a modest 6.9% CAGR, the billions would be overshadowed by AI’s exponential expansion. According to KBV Research, the global AI in mining market is projected to reach $435.94 billion by 2032, expanding at a compound annual growth rate (CAGR) of 40.6%.
With investors already seeing dollar signs in this shift, the broader trend suggests the future is either a hybrid or a full conversion to AI, where stable contracts with hyperscalers promise longevity over crypto’s boom-bust cycles.
This evolution not only repurposes idle assets but also underscores how yesterday’s crypto frontiers are forging tomorrow’s AI empires.

Bitcoin (BTC) is about 4% higher than it was a week ago—good news for the digital asset but bad news for the economy.
The recent negative tone of the economic data points from last week raised expectations that the Federal Reserve will cut interest rates on Wednesday, making riskier assets such as stocks and bitcoin more attractive.
Let’s recap the data that backs up that thesis.
The most important one, the U.S. CPI figures, came out on Thursday. The headline rate was slightly higher than expected, a sign inflation might be stickier than anticipated.
Before that, we had Tuesday’s revisions to job data. The world’s largest economy created almost 1 million fewer jobs than reported in the year ended March, the largest downward revision in the country’s history.
The figures followed the much-watched monthly jobs report, which was released the previous Friday. The U.S. added just 22,000 jobs in August, with unemployment rising to 4.3%, the Bureau of Labor Statistics said. Initial jobless claims rose 27,000 to 263,000 — the highest since October 2021.
")
Higher inflation and fewer jobs are not great for the U.S. economy, so it’s no surprise that the word «stagflation» is starting to creep back into macroeconomic commentary.
Against this backdrop, bitcoin—considered a risk asset by Wall Street—continued grinding higher, topping $116,000 on Friday and almost closing the CME futures gap at 117,300 from August.
Not a surprise, as traders are also bidding up the biggest risk assets: equities. Just take a look at the S&P 500 index, which closed at a record for the second day on the hope of a rate cut.
So how should traders think about BTC’s price chart?
To this chart enthusiast, price action remains constructive, with higher lows forming from the September bottom of $107,500. The 200-day moving average has climbed to $102,083, while the Short-Term Holder Realized Price — often used as support in bull markets — rose to a record $109,668.
")
Bitcoin-linked stocks: A mixed bag
However, bitcoin’s weekly positive price action didn’t help Strategy (MSTR), the largest of the bitcoin treasury companies, whose shares were about flat for the week. Its rivals performed better: MARA Holdings (MARA) 7% and XXI (CEP) 4%.
Strategy (MSTR) has underperformed bitcoin year-to-date and continues to hover below its 200-day moving average, currently $355. At Thursday’s close of $326, it’s testing a key long-term support level seen back in September 2024 and April 2025.
The company’s mNAV premium has compressed to below 1.5x when accounting for outstanding convertible debt and preferred stock, or roughly 1.3x based solely on equity value.
")
Preferred stock issuance remains muted, with only $17 million tapped across STRK and STRF this week, meaning that the bulk of at-the-money issuance is still flowing through common shares. According to the company, options are now listed and trading for all four perpetual preferred stocks, a development that could provide additional yield on the dividend.
Bullish catalysts for crypto stocks?
The CME’s FedWatch tool shows traders expect a 25 basis-point U.S. interest-rate cut in September and have priced in a total of three rate cuts by year-end.
That’s a sign risk sentiment could tilt back toward growth and crypto-linked equities, underlined by the 10-year U.S. Treasury briefly breaking below 4% this week.
")
Still, the dollar index (DXY) continues to hold multiyear support, a potential inflection point worth watching.
")
Uncategorized
Fed’s Sept. 17 Rate Cut Could Spark Short-Term Jitters but Supercharge Bitcoin, Gold and Stocks Long Term
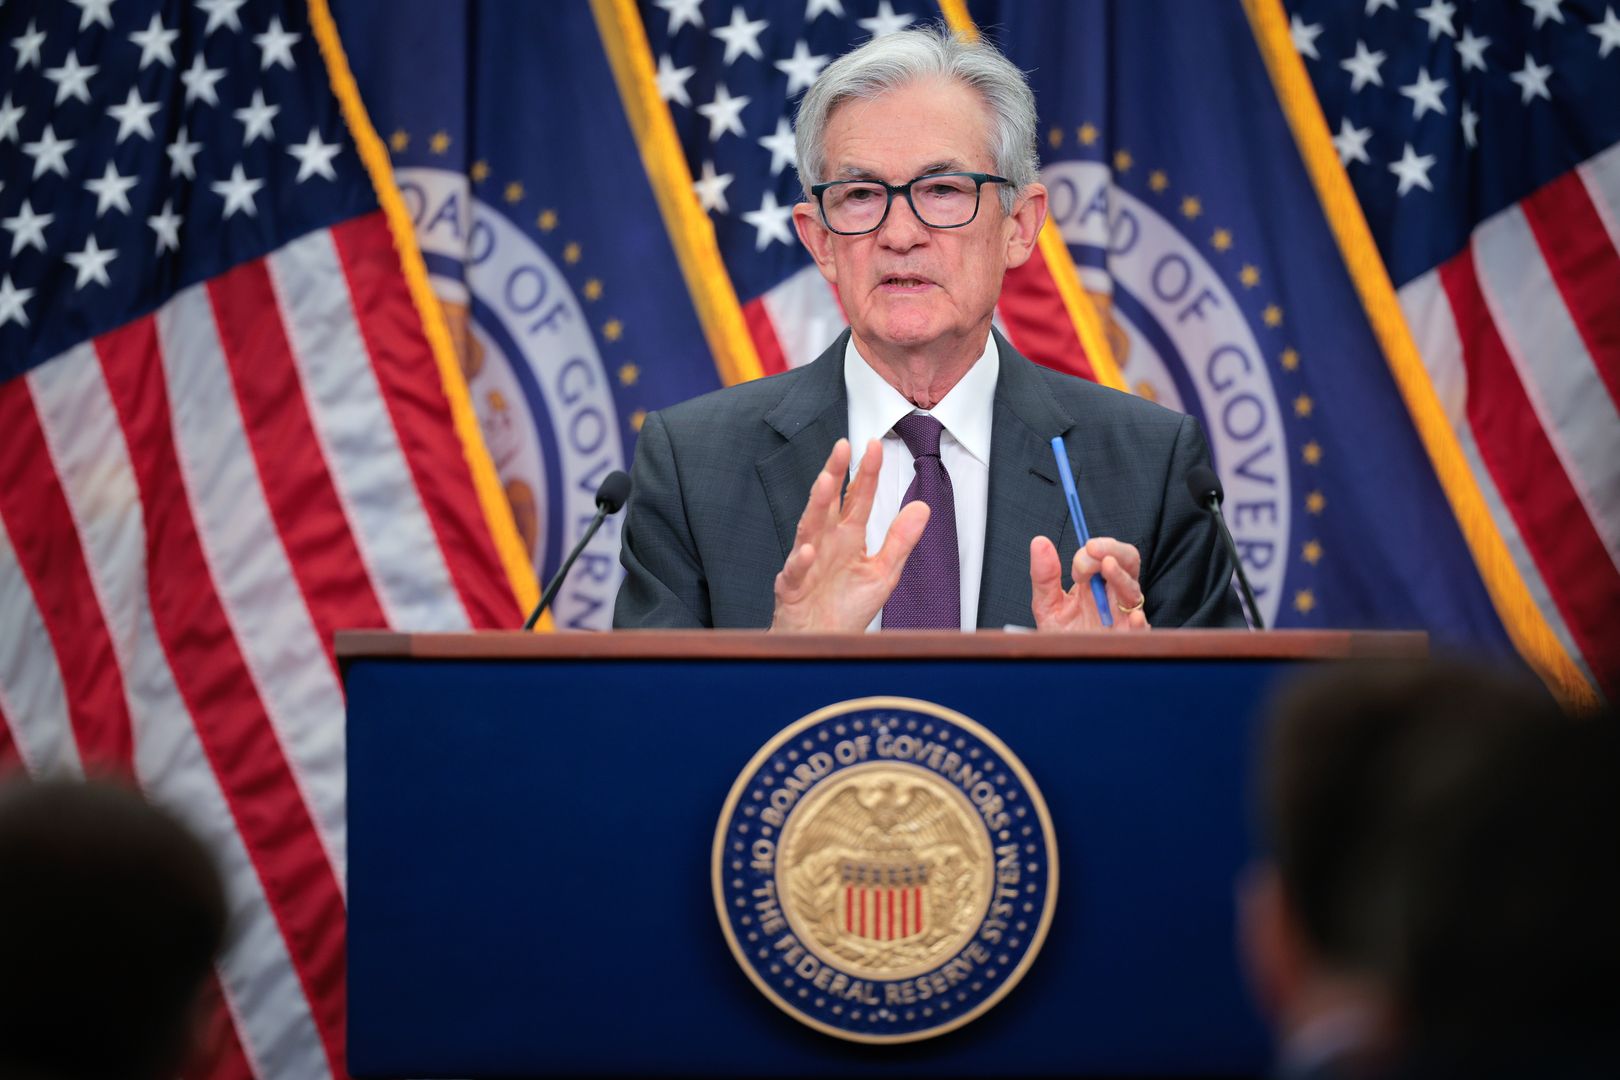
Investors are counting down to the Federal Reserve’s Sept. 17 meeting, where markets expect a quarter-point rate cut that could trigger short-term volatility but potentially fuel longer-term gains across risk assets.
The economic backdrop highlights the Fed’s delicate balancing act.
According to the latest CPI report released by the U.S. Bureau of Labor Statistics on Thursday, consumer prices rose 0.4% in August, lifting the annual CPI rate to 2.9% from 2.7% in July, as shelter, food, and gasoline pushed costs higher. Core CPI also climbed 0.3%, extending its steady pace of recent months.
Producer prices told a similar story: per the latest PPI report released on Wednesday, the headline PPI index slipped 0.1% in August but remained 2.6% higher than a year earlier, while core PPI advanced 2.8%, the largest yearly increase since March. Together, the reports underscore stubborn inflationary pressure even as growth slows.
The labor market has softened further.
Nonfarm payrolls increased by just 22,000 in August, with federal government and energy sector job losses offsetting modest gains in health care. Unemployment held at 4.3%, while labor force participation remained stuck at 62.3%.
Revisions showed June and July job growth was weaker than initially reported, reinforcing signs of cooling momentum. Average hourly earnings still rose 3.7% year over year, keeping wage pressures alive.
Bond markets have adjusted accordingly. The 2-year Treasury yield sits at 3.56%, while the 10-year is at 4.07%, leaving the curve modestly inverted. Futures traders see a 93% chance of a 25 basis point cut, according to CME FedWatch.
If the Fed limits its move to just 25 bps, investors may react with a “buy the rumor, sell the news” response, since markets have already priced in relief.
Equities are testing record levels.
Equities are testing record levels. The S&P 500 closed Friday at 6,584 after rising 1.6% for the week, its best since early August. The index’s one-month chart shows a strong rebound from its late-August pullback, underscoring bullish sentiment heading into Fed week.

The Nasdaq Composite also notched five straight record highs, ending at 22,141, powered by gains in megacap tech stocks, while the Dow slipped below 46,000 but still booked a weekly advance.
Crypto and commodities have rallied alongside.
Bitcoin is trading at $115,234, below its Aug. 14 all-time high near $124,000 but still firmly higher in 2025, with the global crypto market cap now $4.14 trillion.

Gold has surged to $3,643 per ounce, near record highs, with its one-month chart showing a steady upward trajectory as investors price in lower real yields and seek inflation hedges.

Gold has climbed steadily toward record highs, while bitcoin has consolidated below its August peak, reflecting ongoing demand for alternative stores of value.
Historical precedent supports the cautious optimism.
Analysis from the Kobeissi Letter — reported in an X thread posted Saturday — citing Carson Research, shows that in 20 of 20 prior cases since 1980 where the Fed cut rates within 2% of S&P 500 all-time highs, the index was higher one year later, averaging gains of nearly 14%.
The shorter term is less predictable: in 11 of those 22 instances, stocks fell in the month following the cut. Kobeissi argues this time could follow a similar pattern — initial turbulence followed by longer-term gains as rate relief amplifies the momentum behind assets like equities, bitcoin, and gold.
The broader setup explains why traders are watching the Sept. 17 announcement closely.
Cutting rates while inflation edges higher and stocks hover at records risks denting credibility, yet staying on hold could spook markets that have already priced in easing. Either way, the Fed’s message on growth, inflation, and its policy outlook will likely shape the trajectory of markets for months to come.


AI, Mining News: GPU Gold Rush: Why Bitcoin Miners Are Powering AI’s Expansion

Bitcoin Climbs as Economy Cracks — Is it Bullish or Bearish?

Fed’s Sept. 17 Rate Cut Could Spark Short-Term Jitters but Supercharge Bitcoin, Gold and Stocks Long Term
-

 Business11 месяцев ago
3 Ways to make your business presentation more relatable
-
Fashion11 месяцев ago
According to Dior Couture, this taboo fashion accessory is back
-
Entertainment11 месяцев ago
10 Artists who retired from music and made a comeback
-
Entertainment11 месяцев ago
\’Better Call Saul\’ has been renewed for a fourth season
-
Entertainment11 месяцев ago
New Season 8 Walking Dead trailer flashes forward in time
-
Business11 месяцев ago
15 Habits that could be hurting your business relationships
-
Entertainment11 месяцев ago
Meet Superman\’s grandfather in new trailer for Krypton
-
Entertainment11 месяцев ago
Disney\’s live-action Aladdin finally finds its stars