Uncategorized
Crypto Daybook Americas: Market in Sea of Red, BTC Seen Diving to $80K
By Omkar Godbole (All times ET unless indicated otherwise)
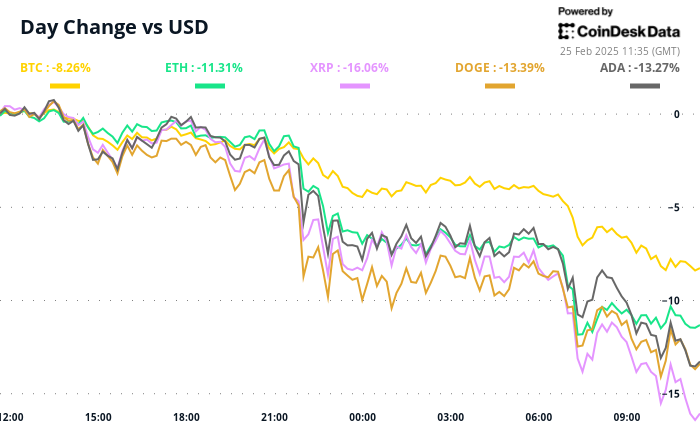
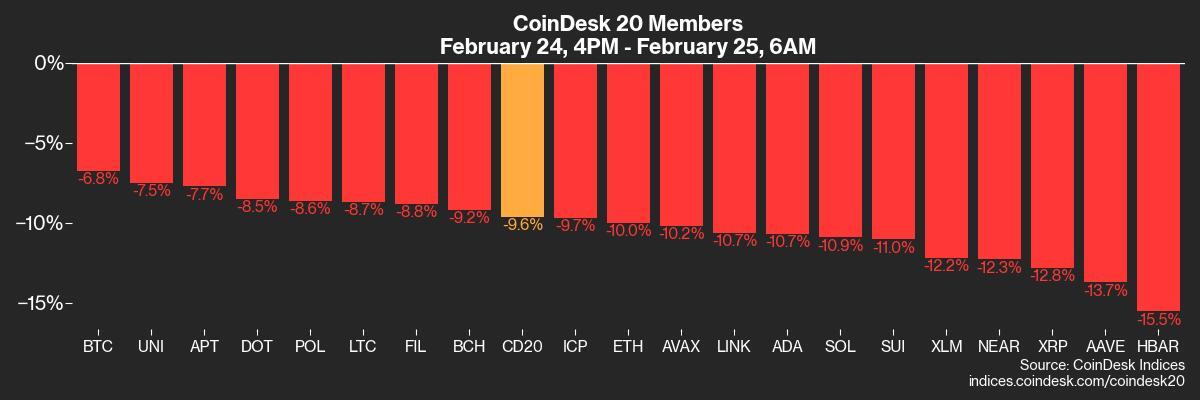
The crypto market is a sea of red, with bitcoin trading at three-month lows under $88,000 and the CoinDesk 20 Index down more than 10% in 24 hours. There are several catalysts for the swoon, including risk-off sentiment in traditional markets and influence from memecoins, especially the recent trading in TRUMP and LIBRA.
As we discussed Monday, market makers attending the Consensus Hong Kong conference last week were worried the memecoin frenzy had sucked liquidity from the productive crypto sub-sectors, leaving the broad market vulnerable.
Another reason is President Donald Trump’s inaction. Although he made significant promises in the lead-up to the elections, concrete action has been scarce. The anticipated strategic BTC reserve remains absent, and even state-level reserves are proving challenging to implement.
«The industry is still waiting for this to manifest in a tangible way in the form of measures such as a mooted Bitcoin Strategic Reserve,» Petr Kozyakov, co-founder and CEO at Mercuryo told CoinDesk. «In the meantime, sentiment has been hit hard by the biggest ever hack at the Bybit exchange, leaking 401,000 ETH, and a memecoin sector plagued with high-profile pump and dump schemes.»
Lastly, renewed concerns about the U.S. economy are zapping demand for riskier assets.
«There is also some concern about the slowdown in U.S. growth since last week’s U.S. Services PMI release, the lowest in 22 months and consistent with GDP growth tracking at 0.6% only,» Nansen’s principal research analyst Aurelie Barthere said. «Our Nansen Risk Barometer also just turned Risk-off from Neutral today.»
Together, they sent BTC diving out of its two-month-long range play between $90,000 and $110,000. Technical analysis theory suggests it could drop to $70,000, though the maximum open interest in BTC put options listed on Deribit sits at the $80,000 strike, indicating that this level could provide some support.
What could stabilize prices? Perhaps an announcement from Trump regarding a strategic reserve or a sharp reversal by the Nasdaq 100. However, that index has fallen below its 50-day SMA, while the yen, a risk-aversion signal, continues to strengthen against G7 currencies, including the dollar.
The next major catalysts for risk assets are Nvidia’s earnings on Feb. 26 and core PCE inflation on Feb. 28. Stay alert!
What to Watch
Crypto:
Feb. 25, 9:00 a.m.: Ethereum Foundation research team AMA on Reddit.
Feb. 25: Pascal hard fork network upgrade goes live on the BNB Smart Chain (BSC) testnet.
Feb. 25, 9:00 a.m. (approximate): Reactive Network mainnet launch, as well as the initial creation and distribution of the REACT token.
Feb. 26, 9:00 a.m. (approximate): Cosmos (ATOM) network upgrade.
Feb. 26: RedStone (RED) farming starts on Binance Launchpool.
Feb. 27, 4:00 a.m.: Alchemy Pay (ACH) community AMA on Discord.
Feb. 27: Solana-based L2 Sonic SVM (SONIC) mainnet launch (“Mobius”).
Macro
Feb. 25, 10:00 a.m.: The Conference Board (CB) releases February’s Consumer Confidence Index.
CB Consumer Confidence Est. 102.5 vs. Prev. 104.1
Feb. 25, 1:00 p.m.: Richmond Fed President Tom Barkin delivers a speech titled “Inflation Then and Now.”
Feb. 25, 7:30 p.m.: The Australian Bureau of Statistics releases January’s Consumer Price Index.
Monthly CPI Indicator Est. 2.6% vs. Prev. 2.5%
Feb. 26, 10:00 a.m.: The U.S. Census Bureau releases January’s New Residential Sales report.
New Home Sales Est. 0.68M vs. Prev. 0.698M
New Home Sales MoM Prev. 3.6%
Feb. 26-27: 2025’s first G20 finance ministers and central bank governors meeting (Cape Town).
Earnings
Feb. 25: Bitdeer Technologies Group (BTDR), pre-market, $-0.17
Feb. 25: Cipher Mining (CIFR), pre-market, $-0.09
Feb. 26: MARA Holdings (MARA), post-market, $-0.13
Feb. 26: NVIDIA (NVDA), post-market
Token Events
Governances votes & calls
Ampleforth DAO is voting on reducing the Flash Mint fee to 0.5% and the Flash Redeem fee to 5% to increase the system’s adaptability.
DYdX DAO is discussing the establishment of a DYDX buyback program. Its initial step would allocate 25% of the dYdX’s protocol net revenue to buy back token.
Frax DAO is discussing upgrading the protocol by renaming FXS to FRAX, making it the gas token on Fraxtal, implementing the Frax North Star Hardfork, and introducing a Tail Emission Plan with gradually decreasing emissions, among other enhancements.
Unlocks
Feb. 28: Optimism (OP) to unlock 2.32% of circulating supply worth $30.21 million.
Mar. 1: DYdX to unlock 1.14% of circulating supply worth $5.36 million.
Mar. 1: ZetaChain (ZETA) to unlock 6.48% of circulating supply worth $11.86 million.
Mar. 1: Sui (SUI) to unlock 0.74% of circulating supply worth $61.32 million.
Mar. 7: Kaspa (KAS) to unlocked 0.63% of circulating supply worth $14.02 million.
Mar. 8: Berachain (BERA) to unlock 9.28% of circulating supply worth $61.6 million.
Mar. 12: Aptos (APT) to unlock 1.93% of circulating supply worth $69.89 million.
Token Listings
Feb. 25: Zoo (ZOO) to be listed on KuCoin.
Feb. 25: Ethena (ENA) to be listed on Bithumb.
Feb. 26: Moonwell (WELL) to be listed on Kraken.
Feb. 27: Venice token (VVV) to be listed on Kraken.
Feb. 28: Worldcoin (WLD) to be listed on Kraken.
Conferences:
CoinDesk’s Consensus to take place in Toronto on May 14-16. Use code DAYBOOK and save 15% on passes.
Day 3 of 8: ETHDenver 2025 (Denver)
Feb. 25: HederaCon 2025 (Denver)
March 2-3: Crypto Expo Europe (Bucharest, Romania)
March 8: Bitcoin Alive (Sydney, Australia)
March 10-11: MoneyLIVE Summit (London)
March 13-14: Web3 Amsterdam ‘25 (Netherlands)
March 19-20: Next Block Expo (Warsaw, Poland)
March 26: DC Blockchain Summit 2025 (Washington)
March 28: Solana APEX (Cape Town, South Africa)
Token Talk
By Shaurya Malwa
A token tied to a fake Sam Bankman-Fried account became the rug-pull of the day.
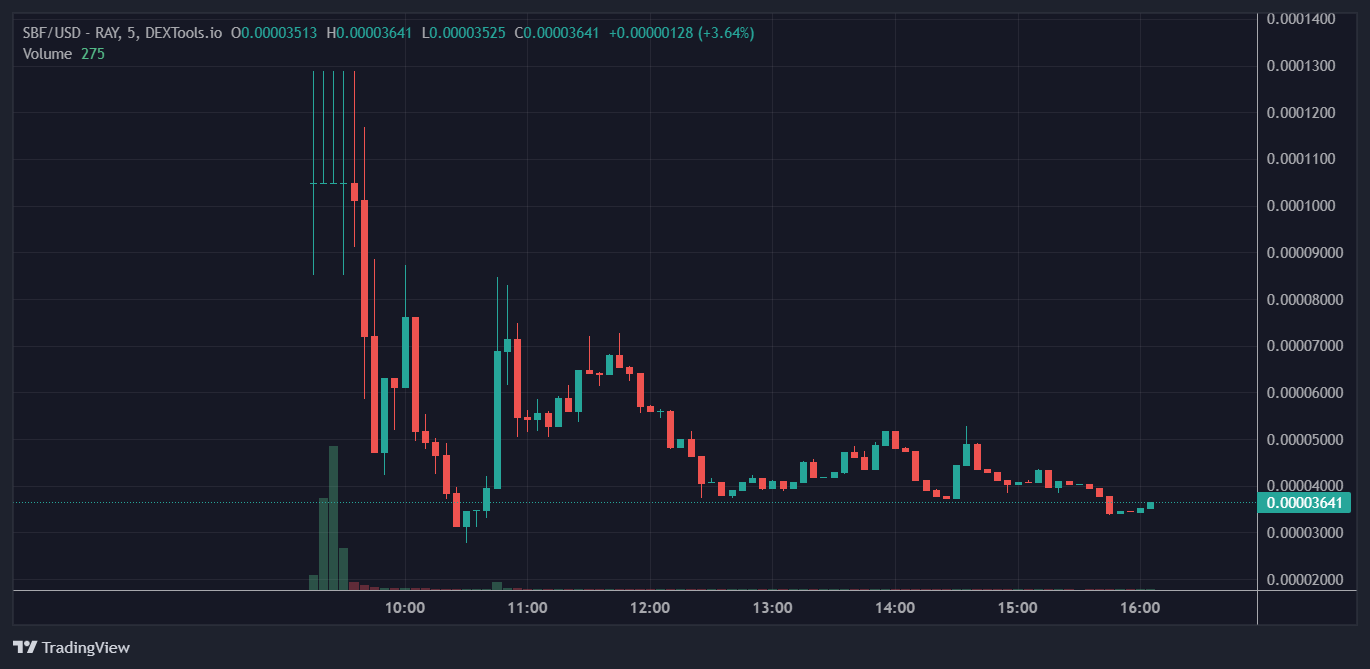
The scam started with the account “Comune Guardiagrele,” a small Italian city with a verified grey checkmark indicating it’s an official government or organization account, based on web results on identity verification.
Scammers probably hijacked or bought the account and changed the name to “@SBF_Doge» mimicking Sam Bankman-Fried (SBF), the disgraced crypto mogul jailed for the FTX fraud.
The account then launched a memecoin, likely tricking unsuspecting traders or bots into thinking it was legitimate due to the verification badge.
The memecoin’s market capitalization rose to $10 million before its creators pulled liquidity, crashing it to a $100,000 capitalization and pocketing fees and proceeds gained from the sale.
Derivatives Positioning
The top 25 cryptocurrencies by market value, excluding stablecoins, have registered price losses in the past 24 hours. At the same time, most have seen increases in open interest in perpetual futures and negative cumulative volume deltas, indicating an influx of bearish short positions. Perhaps there is more pain ahead.
On Deribit, XRP’s February expiry puts trade at a 8 vol premium relative to calls. Talk about sentiment being notably bearish.
BTC, ETH options show downside concerns till mid-to-late March, with subsequent expiries retaining the bullish call bias.
Market Movements:
BTC is down 6.23% from 4 p.m. ET Monday at $88,118.16 (24hrs: -7.7%)
ETH is down 9.4% at $2,393.03 (24hrs: -10.6%)
CoinDesk 20 is down 9.19% at 2,750.01 (24hrs: -11.61%)
Ether CESR Composite Staking Rate is unchanged at 2.99%
BTC funding rate is at 0.0008% (0.84% annualized) on Binance
DXY is unchanged at 106.7
Gold is down 0.28% at $2,937.90/oz
Silver is down 0.43% at $32.14/oz
Nikkei 225 closed -1.39% at 38,237.79
Hang Seng closed -1.32% at 23,034.02
FTSE is up 0.34% at 8,688.48
Euro Stoxx 50 is unchanged at 5,449.69
DJIA closed on Monday unchanged at 43,461.21
S&P 500 closed -0.5% at 5,983.25
Nasdaq closed -1.21% at 19,286.93
S&P/TSX Composite Index closed unchanged at 25,151.26
S&P 40 Latin America closed -0.92% at 2,386.34
U.S. 10-year Treasury rate is down 6 bps at 4.35%
E-mini S&P 500 futures are down 0.78% at 5,981.75
E-mini Nasdaq-100 futures are down 0.53% at 21,306.25
E-mini Dow Jones Industrial Average Index futures are down 0.13% at 43,479.00
Bitcoin Stats:
BTC Dominance: 61.81% (-0.15%)
Ethereum to bitcoin ratio: 0.02720 (-0.95%)
Hashrate (seven-day moving average): 745 EH/s
Hashprice (spot): $56.8
Total Fees: 7.5 BTC / $1.3 million
CME Futures Open Interest: 166,510 BTC
BTC priced in gold: 29.7 oz
BTC vs gold market cap: 8.42%
Technical Analysis
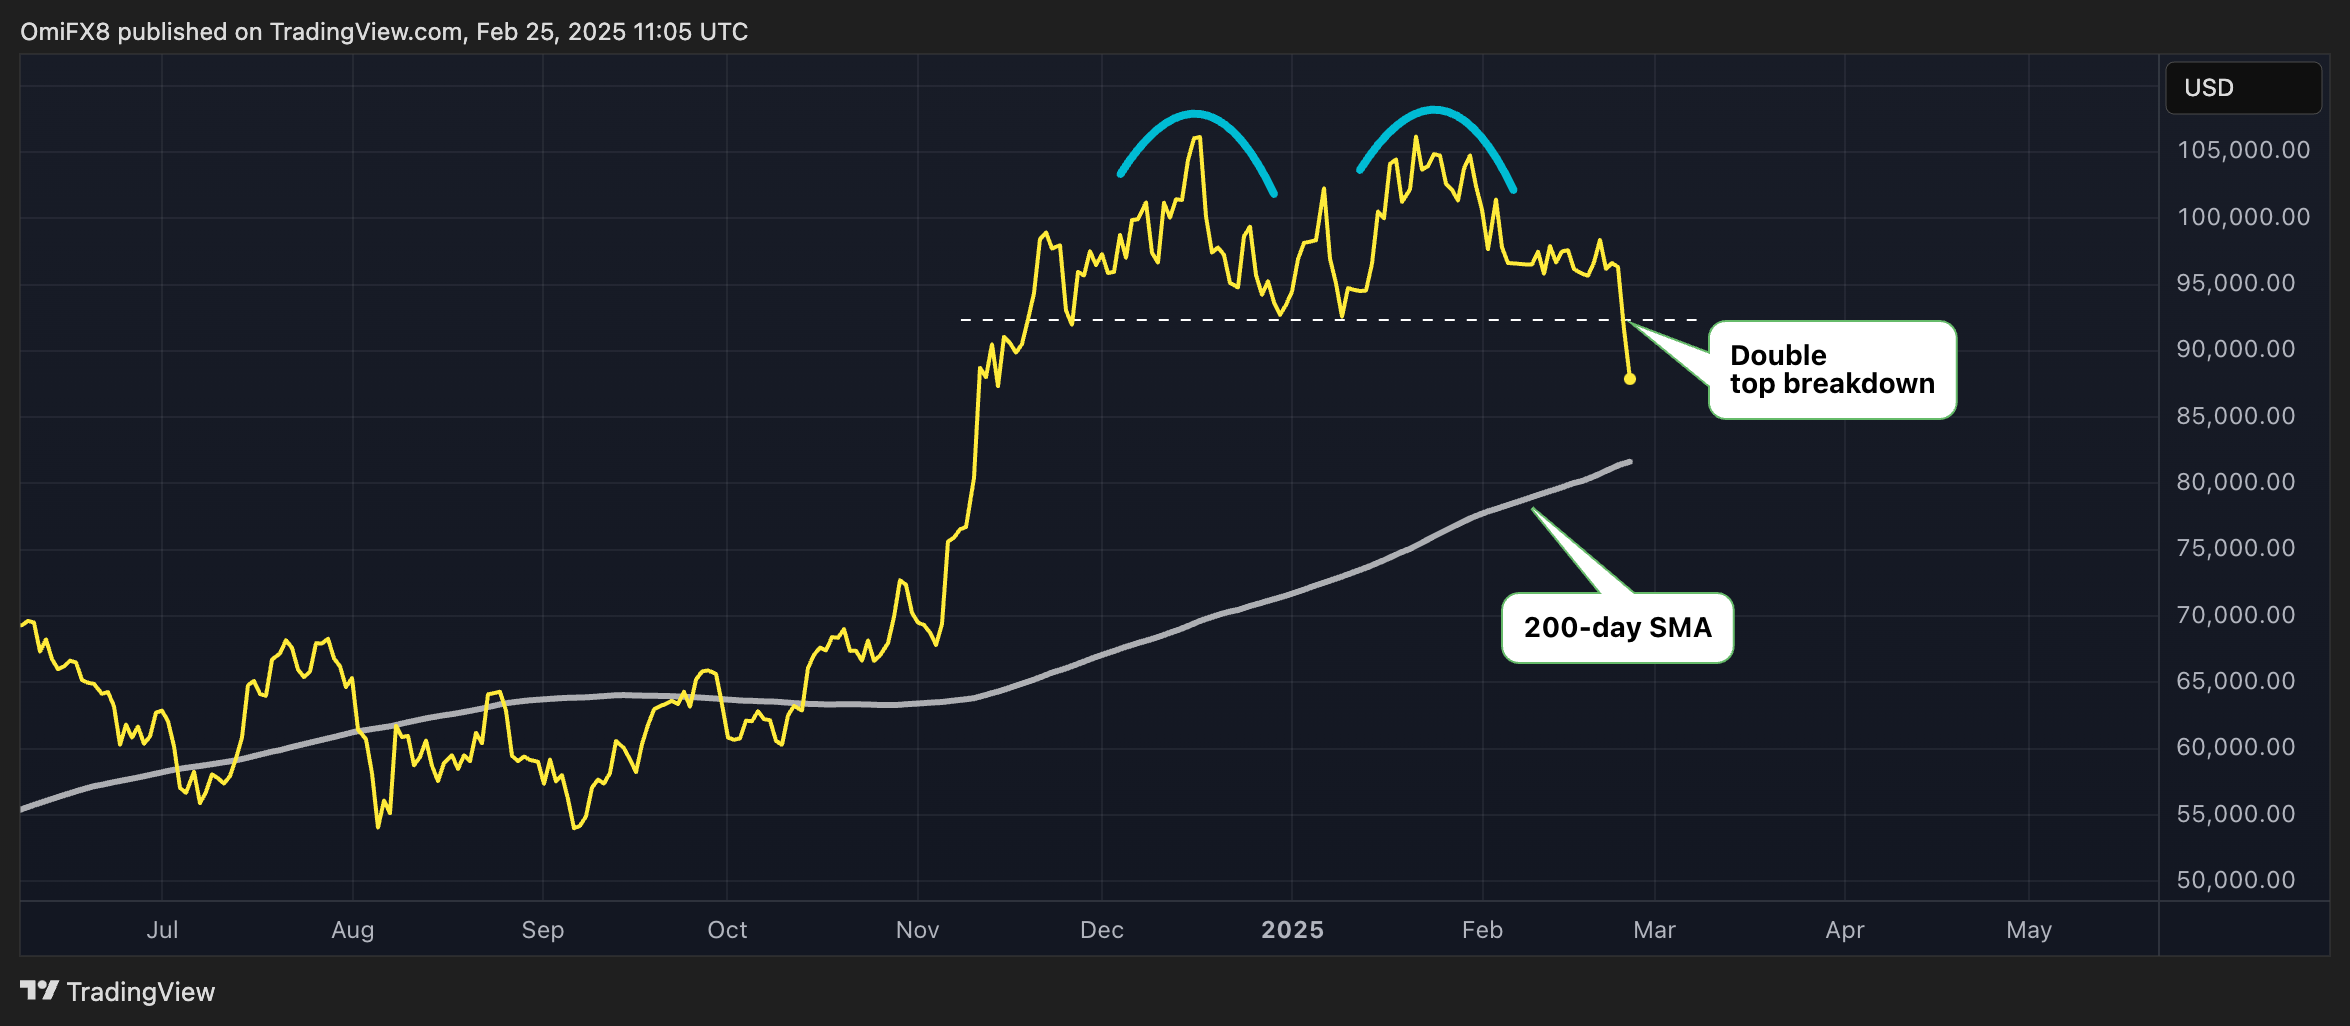
BTC’s daily chart shows the cryptocurrency has triggered a double top bearish reversal pattern.
The shift in trend supports the case for a protracted weakness to the 200-day simple moving average, presently stationed below $82,000.
Crypto Equities
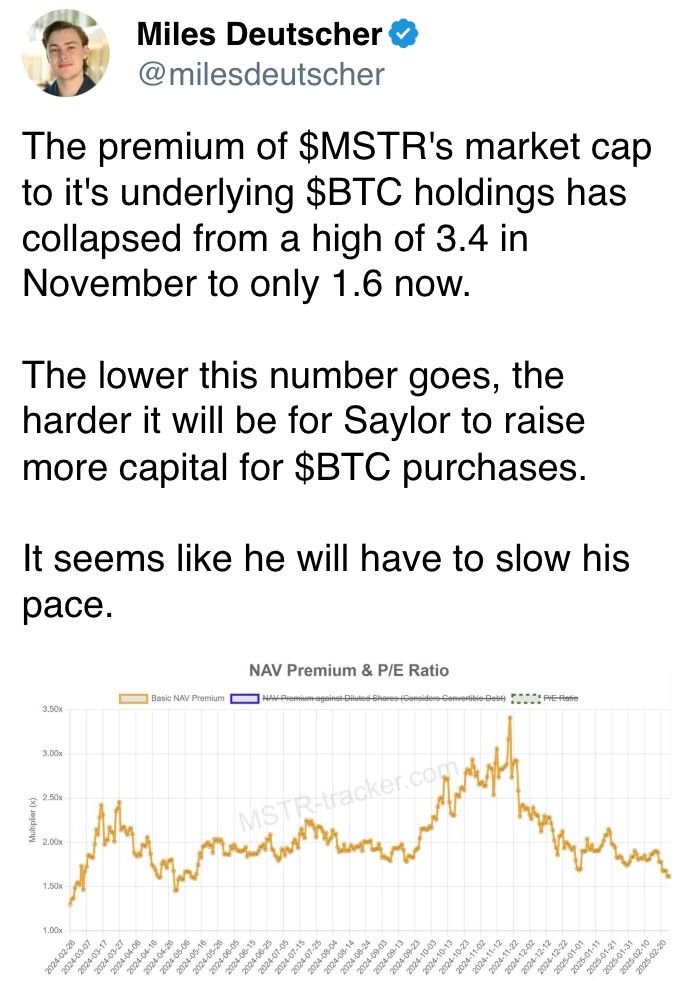
MicroStrategy (MSTR): closed on Monday at $282.76 (-5.65%), down 6.35% at $264.81 in pre-market
Coinbase Global (COIN): closed at $227.07 (-3.53%), down 5.6% at $214.14
Galaxy Digital Holdings (GLXY): closed at C$21.80 (-4.22%)
MARA Holdings (MARA): closed at $13.25 (-4.68%), down 5.76% at $13.09
Riot Platforms (RIOT): closed at $9.99 (-4.49%), down 5.01% at $9.49
Core Scientific (CORZ): closed at $9.86 (-8.7%), down 5.58% at $9.31
CleanSpark (CLSK): closed at $8.90 (-3.78%), down 5.39% at $8.42
CoinShares Valkyrie Bitcoin Miners ETF (WGMI): closed at $19.20 (-6.43%), down 5.21% at $18.20
Semler Scientific (SMLR): closed at $44.38 (-7.04%), down 1.8% at $43.58
Exodus Movement (EXOD): closed at $41.16 (-13.91%), unchanged in pre-market
ETF Flows
Spot BTC ETFs:
Daily net flow: -$516.4 million
Cumulative net flows: $39.05 billion
Total BTC holdings ~ 1,105 million.
Spot ETH ETFs
Daily net flow: -$78 million
Cumulative net flows: $3.07 billion
Total ETH holdings ~ 3.331 million.
Source: Farside Investors
Overnight Flows
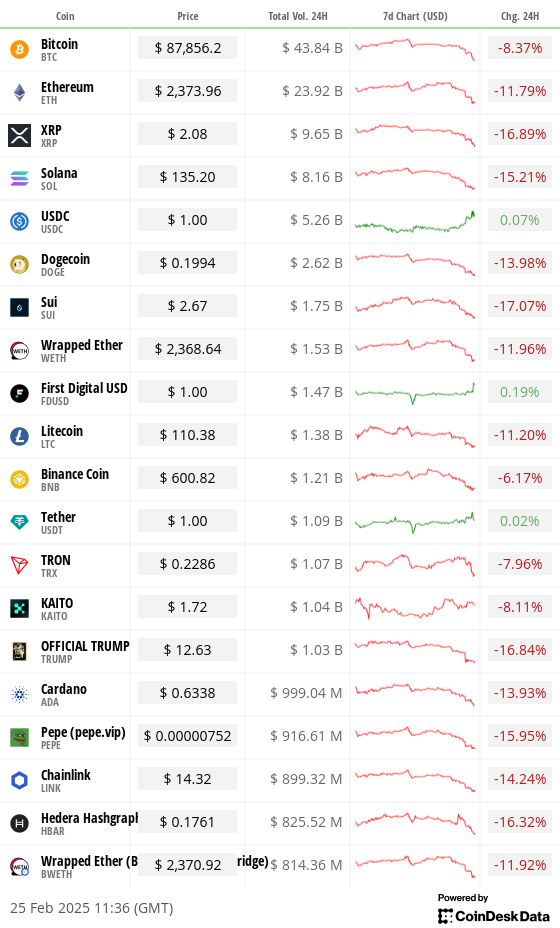
Chart of the Day
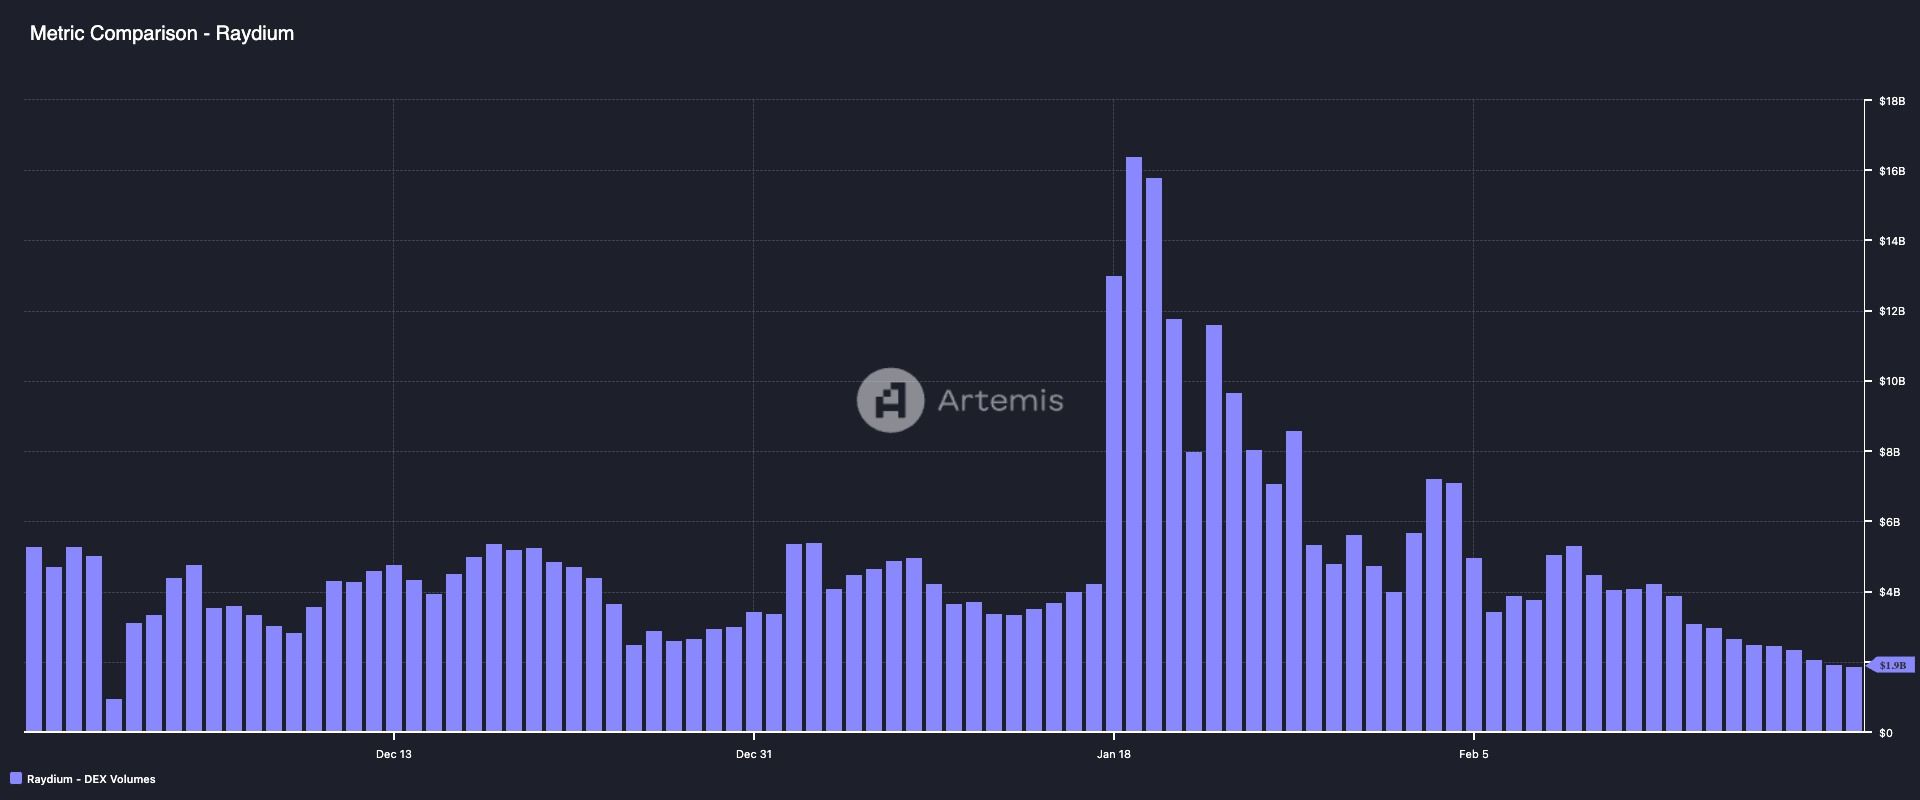
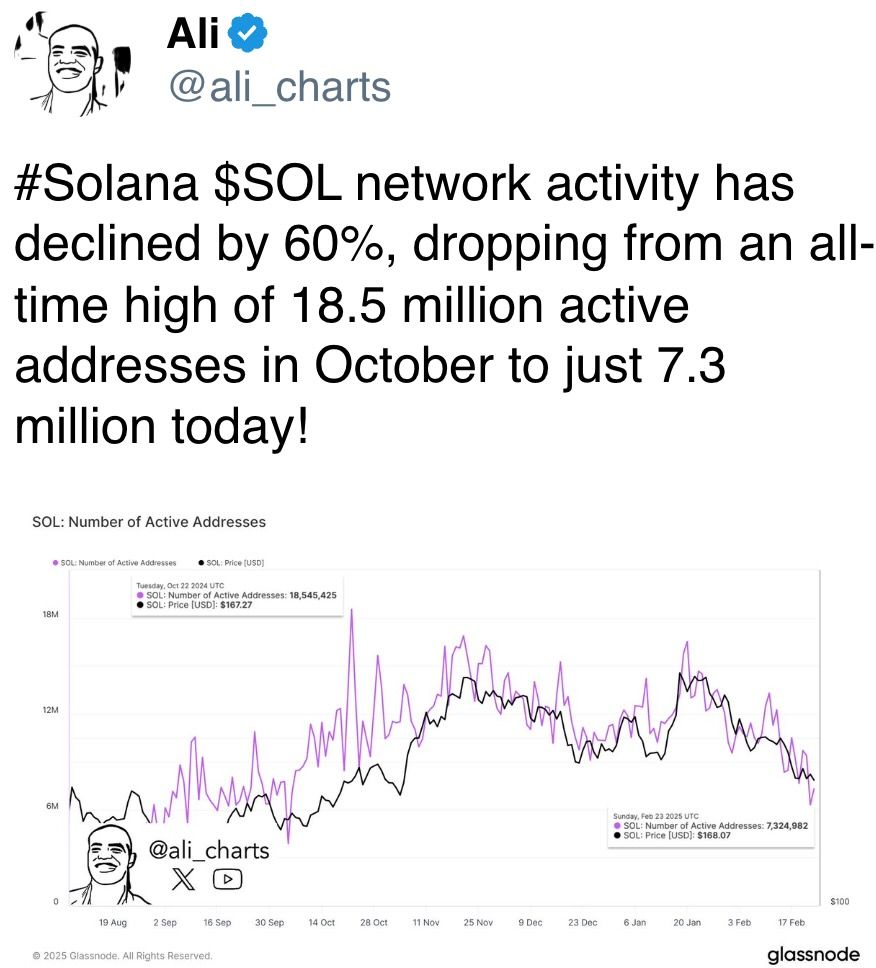
Raydium registered a cumulative trading volume of $1.9 billion on Monday, the lowest since Nov. 29, according to Artemis.
The slowdown partly explains the recent decline the value of the RAY token and Solana’s SOL token.
While You Were Sleeping
Bitcoin Slides Below $89K to 3-Month Low as Nasdaq Futures Dip, Yen Sparks Risk-Off Fears (CoinDesk): Bitcoin fell below $89,000 as Nasdaq futures signaled further tech losses and a strong yen raised concerns of risk aversion similar to August 2024.
U.S. Bitcoin ETFs Post Year’s 2nd-Biggest Outflows as Basis Trade Drops Below 5% (CoinDesk): U.S.-listed spot BTC ETFs saw $516 million in outflows on Monday and the bitcoin CME annualized basis fell to 4%, the lowest since the ETFs began trading in January 2024.
USDe Issuer Ethena Labs Integrates Chaos Labs’ Edge Proof of Reserves Oracles to Strengthen Risk Management (CoinDesk): Ethena Labs has enhanced USDe’s risk management by adopting independent data oracles from Chaos Labs.
Forget MAGA, Investors Want MEGA: Make Europe Great Again (The Wall Street Journal): Once lagging behind U.S. markets, Europe is staging a robust comeback, with Euro Stoxx 50 up 12% since Trump’s victory, spurred by record inflows and mounting calls for regulatory reform.
China Learned to Embrace What the U.S. Forgot: The Virtues of Creative Destruction (Bloomberg): Amid rising U.S. tariffs and a faltering property market, China is cutting back on government spending, letting weaker sectors collapse so resources can shift to tech and innovation.
Asian Shares Slide as U.S. Curbs China Investment, Euro Gain Fades (Reuters): Asian shares fell Tuesday amid U.S. restrictions on Chinese investments. MSCI’s Asia-Pacific index dropped 1% and Japan’s Nikkei fell 1.3%.
In the Ether


Wall Street giant Citigroup (C) has launched new ether (ETH) forecasts, calling for $4,300 by year-end, which would be a decline from the current $4,515.
That’s the base case though. The bank’s full assessment is wide enough to drive an army regiment through, with the bull case being $6,400 and the bear case $2,200.
The bank analysts said network activity remains the key driver of ether’s value, but much of the recent growth has been on layer-2s, where value “pass-through” to Ethereum’s base layer is unclear.
Citi assumes just 30% of layer-2 activity contributes to ether’s valuation, putting current prices above its activity-based model, likely due to strong inflows and excitement around tokenization and stablecoins.
A layer 1 network is the base layer, or the underlying infrastructure of a blockchain. Layer 2 refers to a set of off-chain systems or separate blockchains built on top of layer 1s.
Exchange-traded fund (ETF) flows, though smaller than bitcoin’s (BTC), have a bigger price impact per dollar, but Citi expects them to remain limited given ether’s smaller market cap and lower visibility with new investors.
Macro factors are seen adding only modest support. With equities already near the bank’s S&P 500 6,600 target, the analysts do not expect major upside from risk assets.
Read more: Ether Bigger Beneficiary of Digital Asset Treasuries Than Bitcoin or Solana: StanChart

Stellar’s XLM token endured sharp swings over the past 24 hours, tumbling 3% as institutional selling pressure dominated order books. The asset declined from $0.39 to $0.38 between September 14 at 15:00 and September 15 at 14:00, with trading volumes peaking at 101.32 million—nearly triple its 24-hour average. The heaviest liquidation struck during the morning hours of September 15, when XLM collapsed from $0.395 to $0.376 within two hours, establishing $0.395 as firm resistance while tentative support formed near $0.375.
Despite the broader downtrend, intraday action highlighted moments of resilience. From 13:15 to 14:14 on September 15, XLM staged a brief recovery, jumping from $0.378 to a session high of $0.383 before closing the hour at $0.380. Trading volume surged above 10 million units during this window, with 3.45 million changing hands in a single minute as bulls attempted to push past resistance. While sellers capped momentum, the consolidation zone around $0.380–$0.381 now represents a potential support base.
Market dynamics suggest distribution patterns consistent with institutional profit-taking. The persistent supply overhead has reinforced resistance at $0.395, where repeated rally attempts have failed, while the emergence of support near $0.375 reflects opportunistic buying during liquidation waves. For traders, the $0.375–$0.395 band has become the key battleground that will define near-term direction.
")
Technical Indicators
- XLM retreated 3% from $0.39 to $0.38 during the previous 24-hours from 14 September 15:00 to 15 September 14:00.
- Trading volume peaked at 101.32 million during the 08:00 hour, nearly triple the 24-hour average of 24.47 million.
- Strong resistance established around $0.395 level during morning selloff.
- Key support emerged near $0.375 where buying interest materialized.
- Price range of $0.019 representing 5% volatility between peak and trough.
- Recovery attempts reached $0.383 by 13:00 before encountering selling pressure.
- Consolidation pattern formed around $0.380-$0.381 zone suggesting new support level.
Disclaimer: Parts of this article were generated with the assistance from AI tools and reviewed by our editorial team to ensure accuracy and adherence to our standards. For more information, see CoinDesk’s full AI Policy.
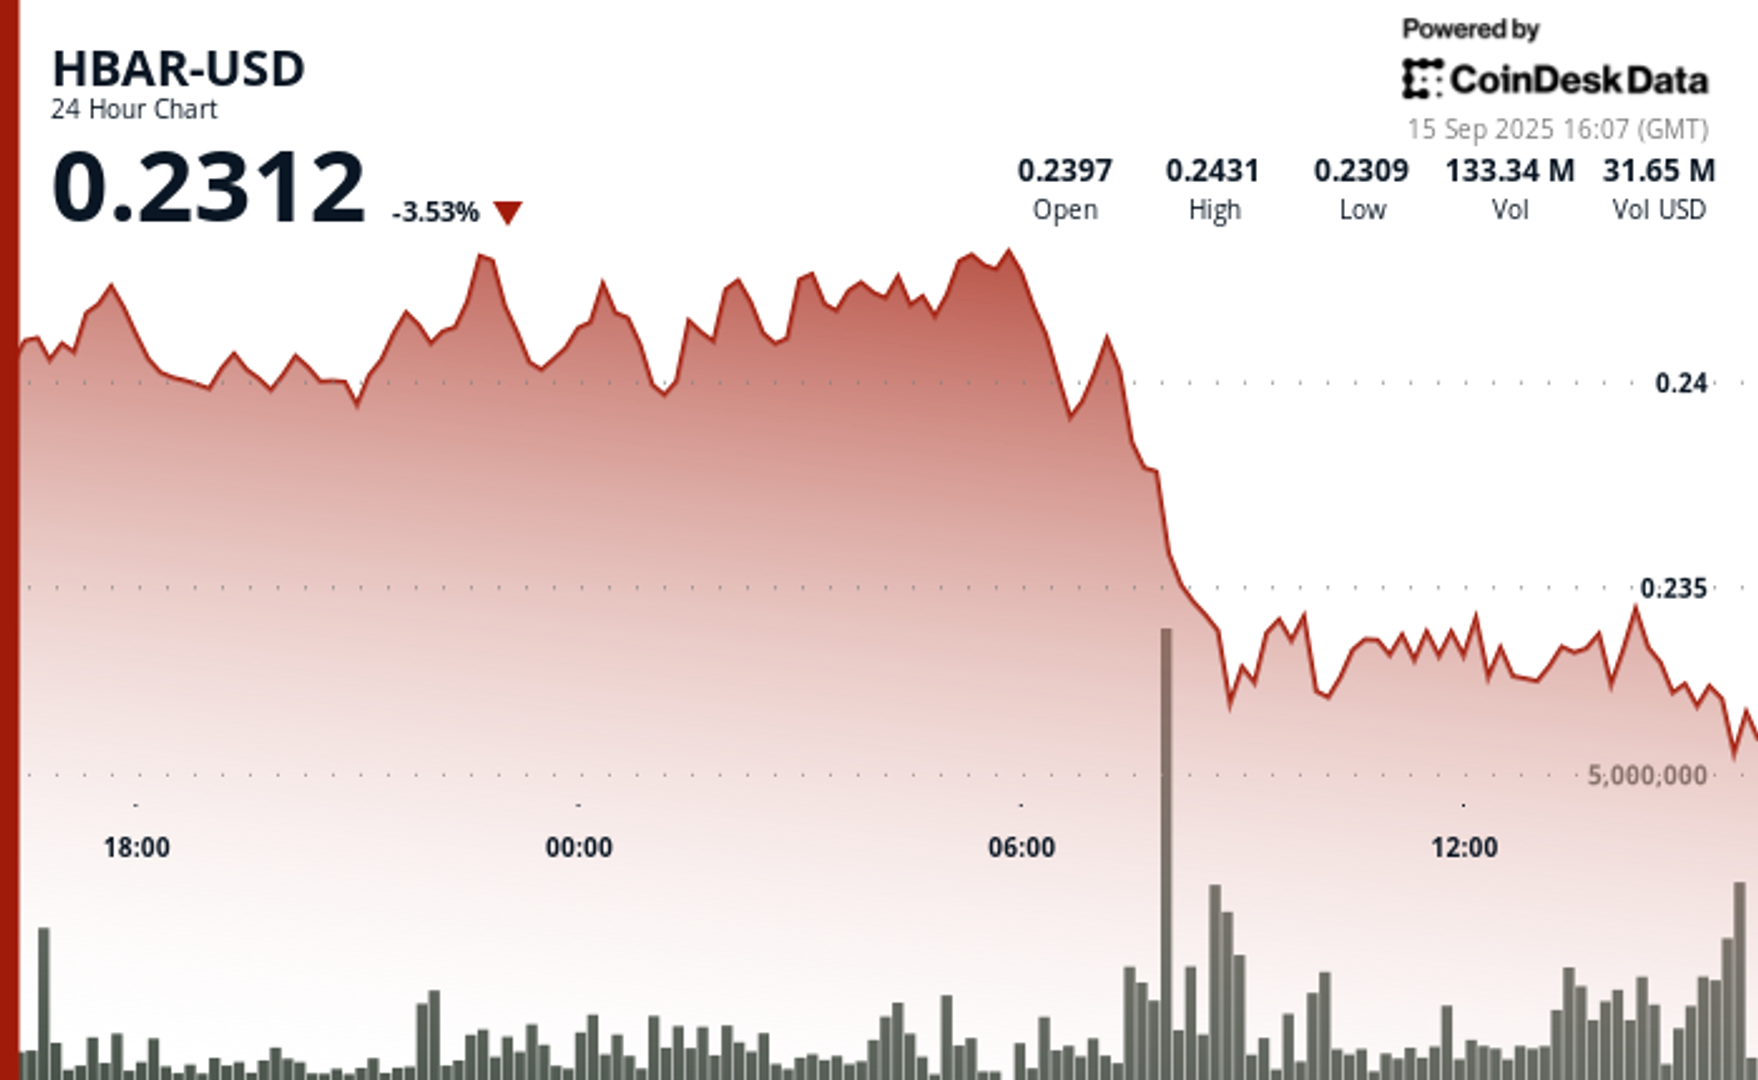
Hedera Hashgraph’s HBAR token endured steep losses over a volatile 24-hour window between September 14 and 15, falling 5% from $0.24 to $0.23. The token’s trading range expanded by $0.01 — a move often linked to outsized institutional activity — as heavy corporate selling overwhelmed support levels. The sharpest move came between 07:00 and 08:00 UTC on September 15, when concentrated liquidation drove prices lower after days of resistance around $0.24.
Institutional trading volumes surged during the session, with more than 126 million tokens changing hands on the morning of September 15 — nearly three times the norm for corporate flows. Market participants attributed the spike to portfolio rebalancing by large stakeholders, with enterprise adoption jitters and mounting regulatory scrutiny providing the backdrop for the selloff.
Recovery efforts briefly emerged during the final hour of trading, when corporate buyers tested the $0.24 level before retreating. Between 13:32 and 13:35 UTC, one accumulation push saw 2.47 million tokens deployed in an effort to establish a price floor. Still, buying momentum ultimately faltered, with HBAR settling back into support at $0.23.
The turbulence underscores the token’s vulnerability to institutional distribution events. Analysts point to the failed breakout above $0.24 as confirmation of fresh resistance, with $0.23 now serving as the critical support zone. The surge in volume suggests major corporate participants are repositioning ahead of regulatory shifts, leaving HBAR’s near-term outlook dependent on whether enterprise buyers can mount sustained defenses above key support.
")
Technical Indicators Summary
- Corporate resistance levels crystallized at $0.24 where institutional selling pressure consistently overwhelmed enterprise buying interest across multiple trading sessions.
- Institutional support structures emerged around $0.23 levels where corporate buying programs have systematically absorbed selling pressure from retail and smaller institutional participants.
- The unprecedented trading volume surge to 126.38 million tokens during the 08:00 morning session reflects enterprise-scale distribution strategies that overwhelmed corporate demand across major trading platforms.
- Subsequent institutional momentum proved unsustainable as systematic selling pressure resumed between 13:37-13:44, driving corporate participants back toward $0.23 support zones with sustained volumes exceeding 1 million tokens, indicating ongoing institutional distribution.
- Final trading periods exhibited diminishing corporate activity with zero recorded volume between 13:13-14:14, suggesting institutional participants adopted defensive positioning strategies as HBAR consolidated at $0.23 amid enterprise uncertainty.
Disclaimer: Parts of this article were generated with the assistance from AI tools and reviewed by our editorial team to ensure accuracy and adherence to our standards. For more information, see CoinDesk’s full AI Policy.


Wall Street Bank Citigroup Sees Ether Falling to $4,300 by Year-End

XLM Sees Heavy Volatility as Institutional Selling Weighs on Price

HBAR Tumbles 5% as Institutional Investors Trigger Mass Selloff
-

 Business11 месяцев ago
3 Ways to make your business presentation more relatable
-
Fashion11 месяцев ago
According to Dior Couture, this taboo fashion accessory is back
-
Entertainment11 месяцев ago
10 Artists who retired from music and made a comeback
-
Entertainment11 месяцев ago
\’Better Call Saul\’ has been renewed for a fourth season
-
Entertainment11 месяцев ago
New Season 8 Walking Dead trailer flashes forward in time
-
Business11 месяцев ago
15 Habits that could be hurting your business relationships
-
Entertainment11 месяцев ago
Meet Superman\’s grandfather in new trailer for Krypton
-
Entertainment11 месяцев ago
Disney\’s live-action Aladdin finally finds its stars