Uncategorized
As Bitcoin’s Post-Fed Price Dip Extends, This Key Contrary Indicator Offers Fresh Hope: Godbole

Bitcoin’s (BTC) post-Fed price drop to $96,000 has activated a crucial contrary indicator that has historically marked the end of price pullbacks.
On Wednesday, the Fed cut the benchmark borrowing cost as expected but penciled in only two rate cuts for 2025, down from four projected in September. The central bank stressed that it’s not interested in participating in a potential government plan to build a strategic BTC reserve.
Since then, BTC has dropped over 8%, hitting lows near $96,000 at one point. As of writing, the cryptocurrency changed hands near $97,500, down nearly 10% from the record high of $108,266 reached early this week, CoinDesk data show.
The losses have caused the 50-hour simple moving average (SMA) to dip below the 200-hour SMA, confirming a bearish crossover. The pattern suggests that the ongoing pullback could evolve into a deeper one, although it has failed to live up to its reputation during the recent bull run.
Bitcoin has experienced a few pullbacks during its post-U.S. election rally from $70,000 to over $100,000, and each of these dips has ended with a bearish crossover of the 50- and 200-hour SMAs.
The latest crossover, therefore, offers hope to bulls expecting a renewed move into six figures above $100,000.

A potential bounce could face resistance near $10,600, a level identified by the descending trendline, representing the recent price drop. A violation there would open doors for record highs.
It’s important to remember that patterns don’t always play out as expected, and the contrary indicator discussed above may fail, potentially leading to a deeper drop. The first sign of trouble will be if prices move below the overnight low of $96,000, which could expose the swing low of around $91,000 recorded on Dec. 5.
Uncategorized
Crypto Daybook Americas: Bitcoin Reasserts Itself as Stocks, Bonds Fall, Gold Hits Record High

By James Van Straten (All times ET unless indicated otherwise)
«There are decades where nothing happens; and there are weeks where decades happen.» Vladimir Ilyich Lenin
Few quotes better capture the current turbulence in global markets. For decades, the classic portfolio of 60% equities and 40% bonds was considered the cornerstone of balanced investing. This allocation typically offered protection in downturns through bonds, while equities drove returns in times of economic growth.
We saw this play out during crises like 2008 and 2020, when iShares 20+ Year Treasury Bond ETF (TLT) surged amid global uncertainty. Today, that dynamic has been upended. With persistent geopolitical tension ignited by President Donald Trump’s tariffs, stubborn inflation and slowing growth, Treasury yields have climbed and bond prices fallen. TLT is now down some 50% from its 2020 highs.
The equity side of the portfolio isn’t faring much better. U.S. stocks are underperforming, caught in what some are calling a broader «Sell America» trade. Even the dollar, which typically strengthens in risk-off environments, is weakening as capital flows shift toward the yen and euro.
In this new regime, alternative assets are taking center stage. Gold has surged to $3,500 an ounce for the first time, cementing its role as a haven. To underscore its meteoric rise: the precious metal has added about $6 trillion in market cap this year, triple the market cap of bitcoin (BTC) at its all-time high. Gold ETF inflows, measured over a 90-day rolling period, are approaching 9 million ounces, the biggest surge since 2022 and among the largest in the past decade.
Bitcoin, while lagging behind gold, is also reasserting itself. It has reached new highs in dominance within the crypto market and is beginning to diverge from U.S. tech stocks. It’s increasingly behaving like an uncorrelated asset, valuable in a diversified portfolio. This Friday, $6.7 billion in bitcoin options are set to expire, including $330 million in call options at the $100,000 strike price, setting the stage for a potentially volatile final week of April. Stay alert!
What to Watch
- Crypto:
- April 22: The Lyora upgrade goes live on the Injective (INJ) mainnet.
- April 25, 1 p.m.: U.S. Securities and Exchange Commission (SEC) Crypto Task Force Roundtable on «Key Considerations for Crypto Custody«.
- April 28: Enjin Relaychain increases active validator slots to 25 from 15, to enhance decentralization.
- April 29, 1:05 a.m.: BNB Chain (BNB) — BSC mainnet hardfork.
- April 30, 9:30 a.m.: ProShares expects its XRP ETF, offering exposure through futures and swap agreements, to begin trading on NYSE Arca.
- April 30, 10:03 a.m.: Gnosis Chain (GNO), an Ethereum sister chain, will activate the Pectra hard fork on its mainnet at slot 21,405,696, epoch 1,337,856.
- Macro
- Day 2 of 6: World Bank (WB) and the International Monetary Fund (IMF) spring meetings in Washington.
- April 22, 8:30 p.m.: Statistics Canada releases March producer price inflation data.
- PPI MoM Est. 0.3% vs. Prev. 0.4%
- PPI YoY Prev. 4.9%
- April 22, 6 p.m.: Fed Governor Adriana D. Kugler will deliver a speech titled «Transmission of Monetary Policy.»
- April 23, 8 a.m.: Mexico’s National Institute of Statistics and Geography releases retail sales data.
- Retail Sales MoM Prev. 0.6%
- Retail Sales YoY Prev. 2.7%
- April 23, 9:45 a.m.: S&P Global releases (flash) U.S. April purchasing managers’ index (PMI) data.
- Composite PMI Prev. 53.5
- Manufacturing PMI Est. 49.4 vs. Prev. 50.2
- Services PMI Est. 52.8 vs. Prev. 54.4
- Earnings (Estimates based on FactSet data)
Token Events
- Governance votes & calls
- Aave DAO is discussing partnering with Ether.fi to create a custom Aave market on EVM layer 2 to “facilitate on-chain credit for everyday payments through the Ether.fi Cash credit card program.”
- April 23, 9 p.m.: Manta Network to host a townhall meeting with its founders.
- April 24, 8 a.m.: Alchemy Pay to host an Ask Me Anything (AMA) session on its 2025 roadmap.
- April 30, 12 p.m.: Helium to host a community call meeting.
- Unlocks
- April 30: Optimism (OP) to unlock 1.89% of its circulating supply worth $21.83 million.
- May 1: Sui (SUI) to unlock 2.28% of its circulating supply worth $170.93 million.
- May 1: ZetaChain (ZETA) to unlock 5.67% of its circulating supply worth $10.46 million.
- May 2: Ethena (ENA) to unlock 0.73% of its circulating supply worth $11.92 million.
- May 7: Kaspa (KAS) to unlock 0.56% of its circulating supply worth $13 million.
- May 9: Movement (MOVA) to unlock 2.04% of its circulating supply worth $11.23 million.
- Token Launches
- April 22: Hyperlane to airdrop its HYPER tokens.
- April 22: BNB to be listed on Kraken.
- April 23: Zora to airdrop its ZORA tokens.
- April 24: Initia (INIT) to be listed on Binance, CoinW, WEEX, KuCoin, MEXC, and others.
Conferences:
- CoinDesk’s Consensus is taking place in Toronto on May 14-16. Use code DAYBOOK and save 15% on passes.
- Day 1 of 3: Money20/20 Asia (Bangkok)
- April 23: Crypto Horizons 2025 (Dubai)
- April 23-24: Blockchain Forum 2025 (Moscow)
- April 24: Bitwise’s Investor Day for Bitcoin Standard Corporations (New York)
- April 26: Crypto Vision Conference 2025 (Manilla)
- April 26-27: Harvard Blockchain in Action Conference (Cambridge, Mass.)
- April 27: N Crypto Conference 2025 (Kyiv)
- April 27-30: Web Summit Rio 2025
- April 28-29: Blockchain Disrupt 2025 (Dubai)
- April 28-29: Staking Summit Dubai
- April 29: El Salvador Digital Assets Summit 2025 (San Salvador)
- April 29: IFGS 2025 (London)
Token Talk
By Shaurya Malwa
- Pope Francis’ death on Easter Monday triggered significant activity in crypto markets and prediction platforms as traders aimed to capitalize on the news.
- LUCE, a Solana-based memecoin tied to the Vatican’s Holy Year 2025 mascot, surged 45% in value, reaching $0.013, according to CoinGecko data.
- Daily trading volume in the token skyrocketed to $60.27 million from $5 million the previous day, despite the price being down 95% from its November peak of 30 cents.
- Although unaffiliated with the Vatican, LUCE has attracted around 44,800 holders.
- Meanwhile, a Polymarket bet on who will be the next pope has attracted over $3.5 million in volumes since going live on Dec. 31, with over 18 candidates in the mix.
- As of Tuesday morning, Pietro Parolin leads odds at 37%, followed by Luis Antonio Tagle at 23% and Matteo Zuppi at 11%.
Derivatives Positioning
- HBAR, XLM and TRX have seen the most growth in perpetual futures open interest among major tokens in the past 24 hours. However, only TRX has seen a positive cumulative volume delta, implying an influx of new money predominantly on the bullish side.
- BTC’s open interest in has increased to 695K BTC, the most since March 25. ETH’s open interest held shy of the recent record above 11.9 million ETH.
- Perpetual funding rates for most major tokens remain marginally positive in a sign of cautiously bullish sentiment.
- On Deribit, BTC’s short and near-dated calls are now trading at par or a slight premium to puts, another sign of renewed bullishness. ETH puts, however, continue to trade at a premium to calls.
- Block options flows have been muted on Paradigm, with calendar spreads and April put spreads lifted in BTC and ETH.
Market Movements:
- BTC is up 1.45% from 4 p.m. ET Monday at $88,539.04 (24hrs: +1.16%)
- ETH is up 3.43% at $1,628.60 (24hrs: -0.84%)
- CoinDesk 20 is up 1.49% at 2,544.64 (24hrs: -0.3%)
- Ether CESR Composite Staking Rate is up 3 bps at 2.98%
- BTC funding rate is at -0.0058% (-2.1353% annualized) on Binance

- DXY is up 0.1% at 98.38
- Gold is up 4.28% at $3,456.97/oz
- Silver is up 0.5% at $32.57/oz
- Nikkei 225 closed -0.17% at 34,220.60
- Hang Seng closed +0.78% at 21,562.32
- FTSE is up 0.49% at 8,315.81
- Euro Stoxx 50 is down 0.28% at 4,922.48
- DJIA closed on Monday -2.48% at 38,170.41
- S&P 500 closed -2.36% at 5,158.20
- Nasdaq closed -2.55% at 15,870.90
- S&P/TSX Composite Index closed -0.76% at 24,008.86
- S&P 40 Latin America closed unchanged at 2,384.47
- U.S. 10-year Treasury rate is unchanged at 4.42%
- E-mini S&P 500 futures are up 0.98% at 5,235.75
- E-mini Nasdaq-100 futures are up 1.02% at 18,105.00
- E-mini Dow Jones Industrial Average Index futures are up 0.87% at 38,660.00
Bitcoin Stats:
- BTC Dominance: 64.39% (-0.09%)
- Ethereum to bitcoin ratio: 0.01839 (1.88%)
- Hashrate (seven-day moving average): 840 EH/s
- Hashprice (spot): $45.0 PH/s
- Total Fees: 6.56BTC / $572,645
- CME Futures Open Interest: 139,765 BTC
- BTC priced in gold: 25.5 oz
- BTC vs gold market cap: 7.22%
Technical Analysis
")
- If you feel gold’s rally is overstretched or overdone, think again.
- The ratio between gold’s spot price and its 200-day simple moving average, currently 1.3, is well below highs seen in 2011-2012 when the yellow metal rose to its then-record price of $2,000.
- The ratio went as high as 5.80 in the 1980.
- Bitcoin tends to follow gold with a lag of couple of months.
Crypto Equities
- Strategy (MSTR): closed on Monday at $317.76 +0.18%), up 2.02% at $324.19 in pre-market
- Coinbase Global (COIN): closed at $175 (-0.02%), up 1% at $176.75
- Galaxy Digital Holdings (GLXY): closed at C$15.38 (+0.13%)
- MARA Holdings (MARA): closed at $12.29 (-2.92%), up 2.36% at $12.59
- Riot Platforms (RIOT): closed at $6.29 (-2.63%), up 2.07% at $6.42
- Core Scientific (CORZ): closed at $6.39 (-3.62%)
- CleanSpark (CLSK): closed at $7.47 (-0.53%), up 2.68% at $7.67
- CoinShares Valkyrie Bitcoin Miners ETF (WGMI): closed at $11.74 (-2.49%)
- Semler Scientific (SMLR): closed at $29.83 (-8.17%)
- Exodus Movement (EXOD): closed at $36.59 (+0.03%), unchanged in pre-market
ETF Flows
Spot BTC ETFs:
- Daily net flow: $381.3 million
- Cumulative net flows: $35.86 billion
- Total BTC holdings ~ 1.11 million
Spot ETH ETFs
- Daily net flow: -$25.4 million
- Cumulative net flows: $2.24 billion
- Total ETH holdings ~ 3.30 million
Source: Farside Investors
Overnight Flows
Chart of the Day
")
- The chart shows the price of eggs in the U.S. has increased by over 200% since 2024, outperforming BTC’s 100% surge. Gold and the S&P 500 have gained 46% and 21%, respectively, over the same period.
- In other words, asset price growth has failed to compensate holders for the inflation on Main Street.
While You Were Sleeping
- Bitcoin, Euro Options Signal Bullishness Against Dollar Amid Equity and Bond Market Downturns (CoinDesk): Preference for BTC and euro call options over dollar exposure suggests investors are rotating out of U.S. assets and into bitcoin, the euro and gold.
- Dow Headed for Worst April Since 1932 as Investors Send ‘No Confidence’ Signal (The Wall Street Journal): Scott Ladner, chief investment officer at Horizon Investments, said the Trump administration’s policies have made the U.S. economy increasingly unstable and difficult to gauge, deterring investment.
- Bitcoin Runs Into Resistance Cluster Above $88K. What Next? (CoinDesk): Behavioral aspects of trading could influence whether bitcoin rallies further or faces a new downturn from the resistance zone.
- Bearish Dollar Bets Move Toward Levels That Raise Risk of Recoil (Bloomberg): Despite widespread bets against the dollar, steady demand for Treasuries and technical signals suggest a rebound is likely, though gains may be limited or short-lived if negative news continues.
- Japanese Investors Sold $20B of Foreign Debt as Trump Tariffs Shook Markets (Financial Times): Much of Japan’s selling likely involves U.S. Treasuries and mortgage-backed securities guaranteed by the U.S. government, said Tomoaki Shishido, senior rates strategist at Nomura.
- Bitcoin, Stablecoins Command Over 70% of Crypto Market as BTC Pushes Higher (CoinDesk): Bitcoin dominance rose to 64.6%, the highest since January 2021, as ether slumped and the ETH-to-BTC ratio fell to a five-year low of 0.01765.
In the Ether


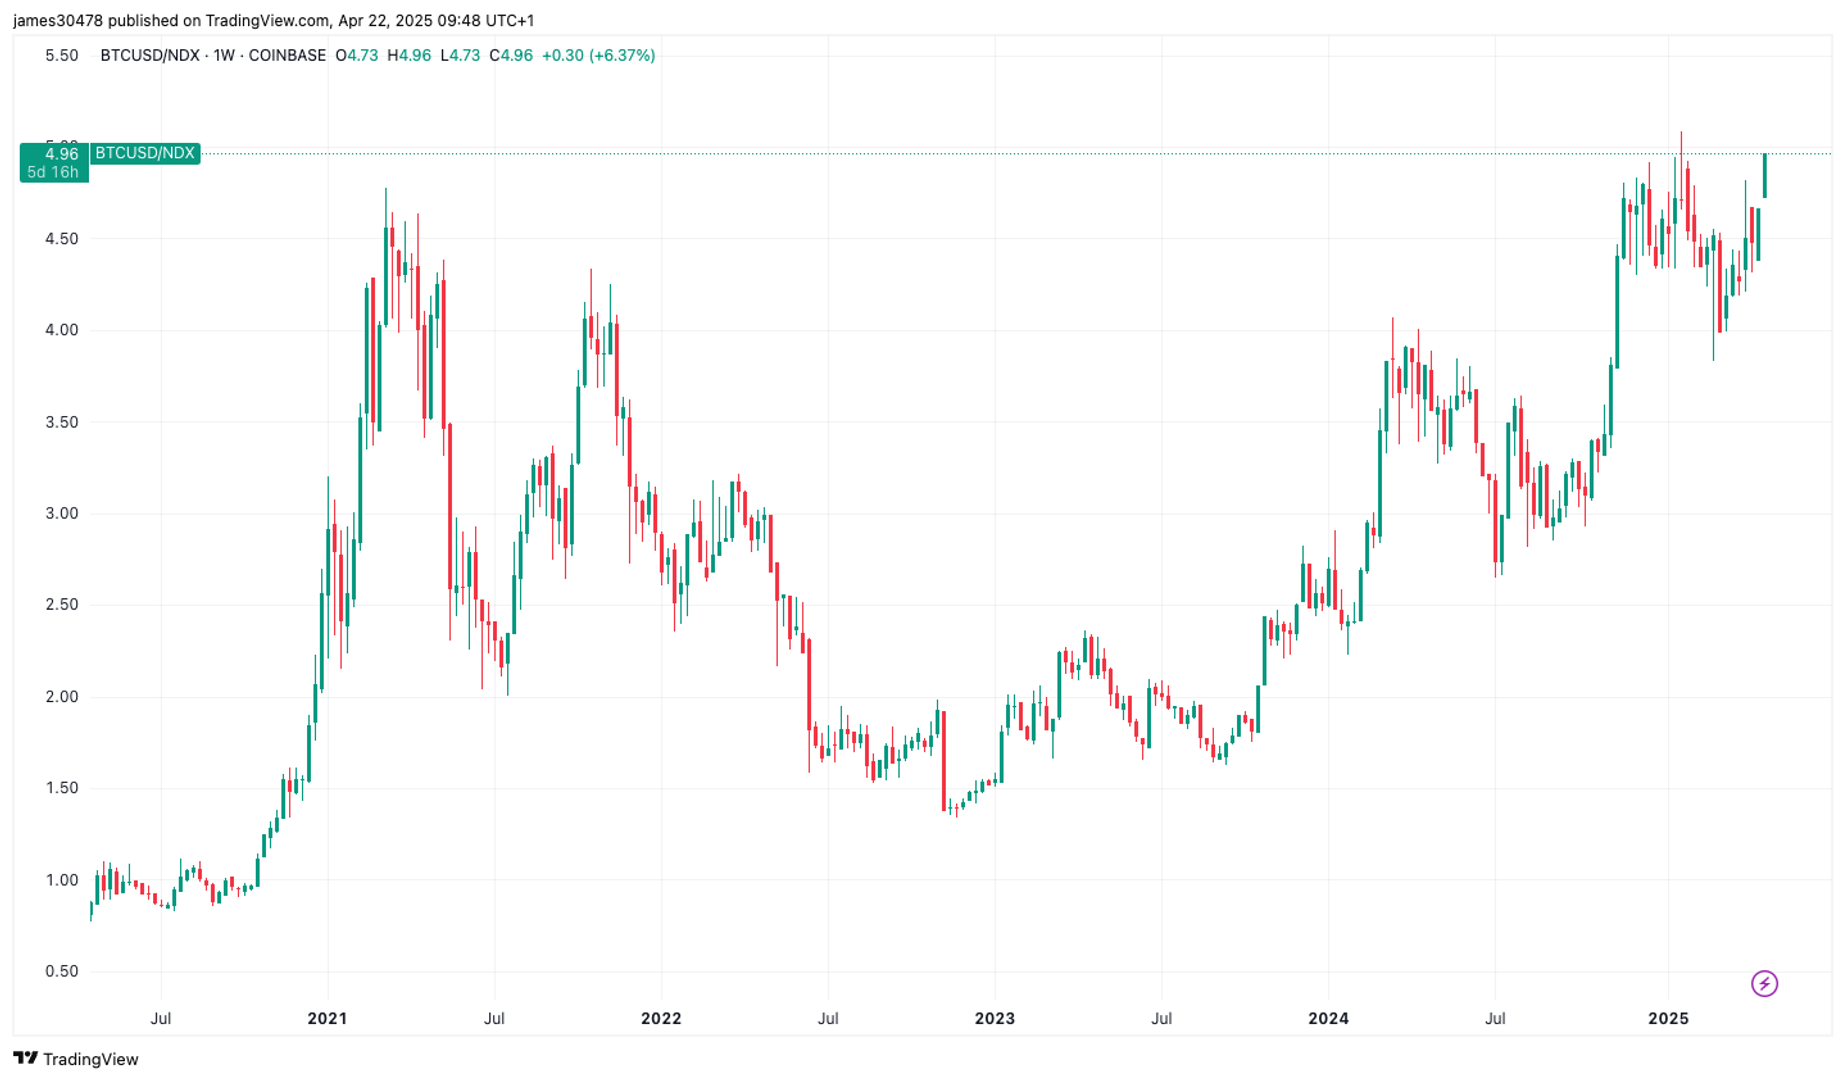
Bitcoin (BTC) is on the cusp of breaking out relative to the Nasdaq 100 Composite, with the current BTC/Nasdaq ratio sitting at 4.96. This means it now takes nearly five Nasdaq units to match the value of one bitcoin. The previous record of 5.08 was set in January 2025, when bitcoin hit its all-time high of over $109,000.
Historically, each market cycle has seen the ratio reach new highs—2017, 2021, and now 2025—highlighting bitcoin’s continued outperformance against the Nasdaq.
Across multiple timeframes, bitcoin is increasingly diverging from U.S. tech stocks. Year-to-date, bitcoin is down just 6%, compared to the Nasdaq’s 15% decline. Since Donald Trump’s election victory in November 2024, bitcoin has rallied 30%, while the Nasdaq has fallen 12%.
When measured against the «Magnificent Seven» mega-cap tech stocks, bitcoin remains around 20% below its all-time high from February this year. This indicates that while bitcoin has shown strength, the top tech names are holding up better than the broader Nasdaq Composite.
Strategy (MSTR), a well-known proxy for bitcoin exposure, is also holding up better than the U.S tech stocks. Since joining the QQQ ETF on Dec. 23, MSTR is down 11%, while the ETF itself has dropped over 16%. The divergence has become more pronounced in 2025: MSTR is up 6% year-to-date, compared to QQQ’s 15% decline.

This is a daily technical analysis by CoinDesk analyst and Chartered Market Technician Omkar Godbole.
Bitcoin’s (BTC) bullish advance has encountered a resistance zone above $88,000, marked by crucial levels that could make or break the ongoing recovery rally.
The resistance cluster’s first and perhaps most critical level is the 200-day simple moving average (SMA) at $88,356. The SMA is widely regarded as a key indicator of long-term momentum. Early this month, Coinbase institutional analysts called the downside break of the 200-day SMA in March a sign of the onset of a potential crypto winter.
So, a fresh move above the 200-day SMA could be taken to represent a renewed bullish shift in momentum.
Such a move would trigger a dual breakout, as the Ichimoku cloud’s upper end is located close to the 200-day SMA. A move above the Ichimoku cloud is also said to reflect a bullish shift in momentum.
Developed by a Japanese journalist in the 1960s, the Ichimoku cloud is a technical analysis indicator that offers a comprehensive view of market momentum, support, and resistance levels. The indicator comprises five lines: Leading Span A, Leading Span B, Conversion Line or Tenkan-Sen (T), Base Line or Kijun-Sen (K) and a lagging closing price line. The difference between Leading Span A and B forms the Ichimoku Cloud.
The third and final level forming the resistance cluster is the high of $88,804 on March 24, from where the market turned lower and fell back to $75,000.
")
A make-or-break resistance zone?
Behavioural aspects of trading come into play when an asset approaches a resistance zone, especially at key levels like the 200-day SMA and the Ichimoku cloud.
Prospect theory suggests that people are typically risk-averse with respect to gains and risk-seeking with respect to losses, known as the “reflection effect.» So, as traders, people tend to be risk-averse while locking in profits and keep losing trades open.
This tendency is amplified when an asset encounters a significant resistance zone. Traders who entered the bitcoin market around $75K, anticipating a rebound, may feel pressured to take profits as the price approaches this resistance. Such selling could, in turn, slow the price ascent or even trigger a new downturn.
Conversely, if bitcoin successfully breaks through the resistance zone, the fear of missing out could prompt more traders to make bullish bets, further fueling bullish momentum and pushing the price higher.


Crypto Daybook Americas: Bitcoin Reasserts Itself as Stocks, Bonds Fall, Gold Hits Record High

Bitcoin Closing In on Historic Breakout vs Nasdaq

Bitcoin Runs Into Resistance Cluster Above $88K. What Next?
-

 Fashion6 месяцев ago
These \’90s fashion trends are making a comeback in 2017
-
Entertainment6 месяцев ago
The final 6 \’Game of Thrones\’ episodes might feel like a full season
-
Fashion6 месяцев ago
According to Dior Couture, this taboo fashion accessory is back
-
Entertainment6 месяцев ago
The old and New Edition cast comes together to perform
-
Sports6 месяцев ago
Phillies\’ Aaron Altherr makes mind-boggling barehanded play
-
Business6 месяцев ago
Uber and Lyft are finally available in all of New York State
-
Entertainment6 месяцев ago
Disney\’s live-action Aladdin finally finds its stars
-
Sports6 месяцев ago
Steph Curry finally got the contract he deserves from the Warriors