Uncategorized
Bitcoin Set to Have Its Fourth Strongest Month Since October 2021
Nov. 30, is the last trading day of the month, so all eyes will be on bitcoin’s (BTC) monthly candle. Bitcoin is less than 4% away from the psychological wall of $100,000. While the <a href=»https://www.coindesk.com/markets/2024/11/25/bitcoin-options-worth-9-b-expire-friday-traders-may-be-thankful-for-the-post-thanksgiving-volatility» target=»_blank»>$9 billion worth of options expiry</a> for bitcoin has just expired, which has sent the token slightly higher on the day to over $96,000.
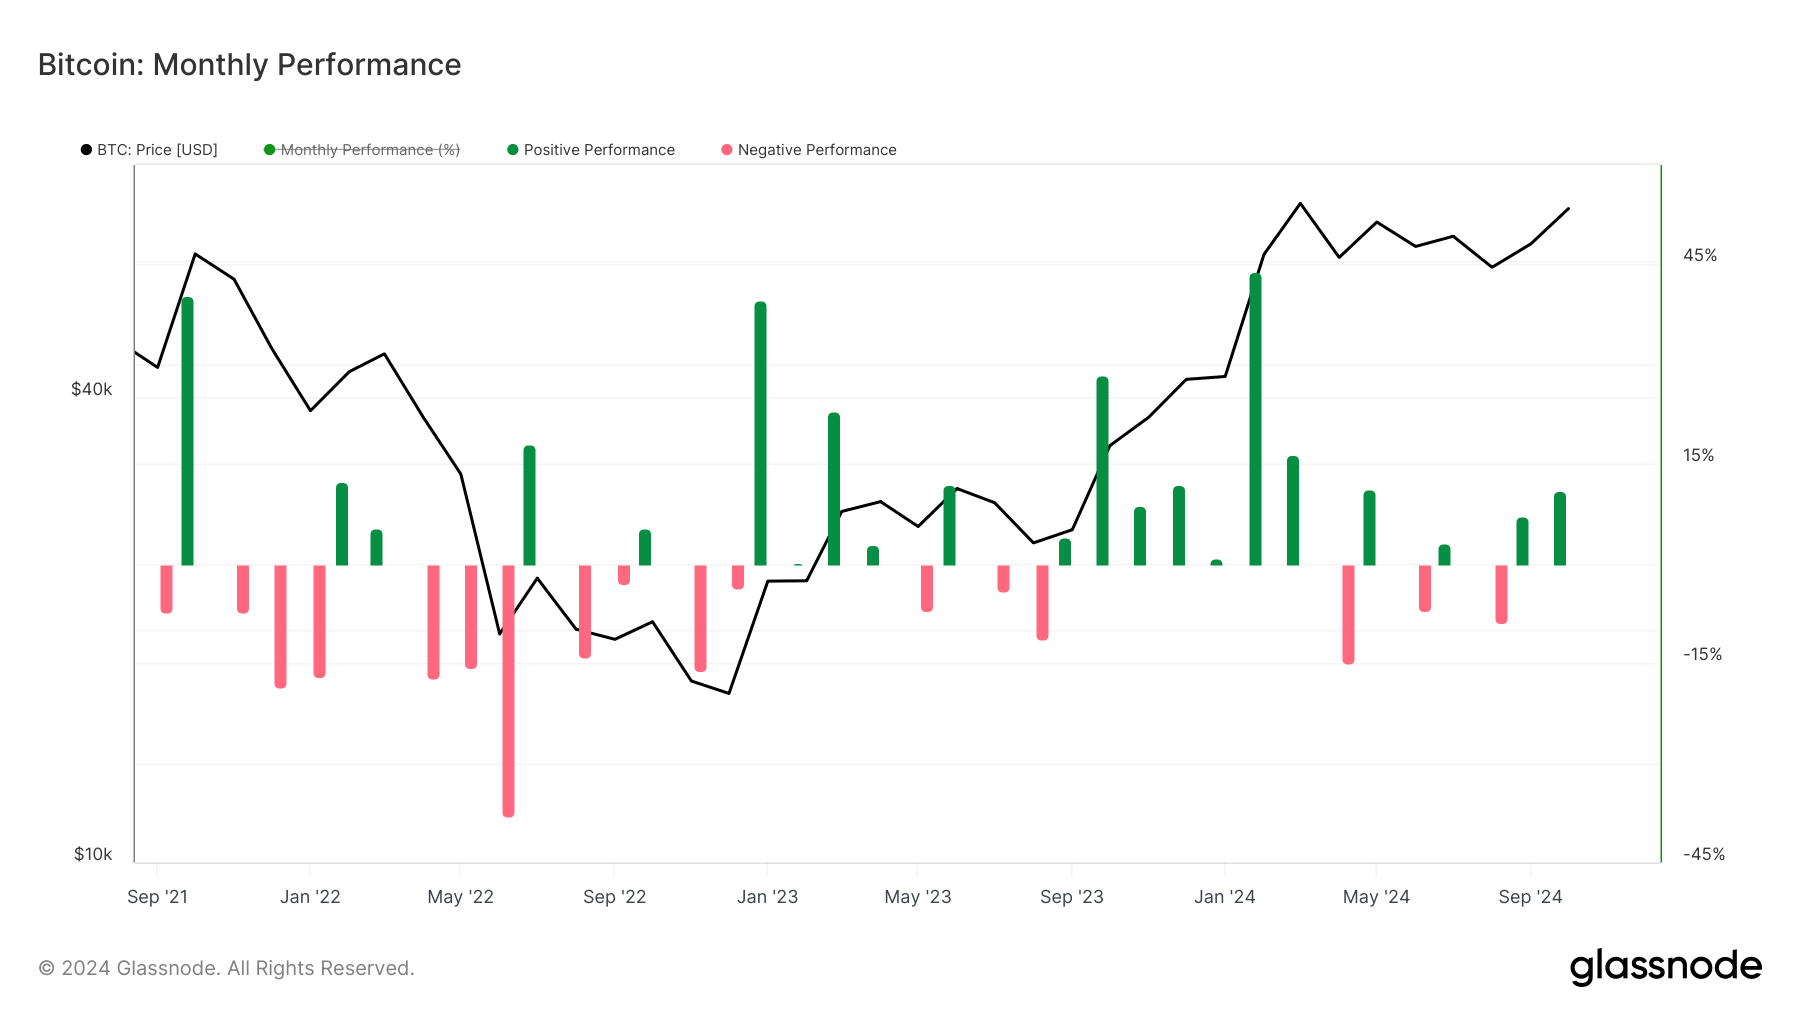
CoinGlass data shows that November has been one of the strongest months for bitcoin for several years, currently up over 36%, which would be the fourth best performing month since October 2021.
November’s rise has only been beaten thrice February 2024 (44%), January 2023 (40%) and October 2021 (40%). November’s impressive performance is largely due to the fact that Donald Trump won the U.S. presidential election earlier this month.
Yet, bitcoin still has two more days until the official monthly close so there is still time to beat these milestones.
On a quarterly timeframe, bitcoin is currently up 51% on the quarter with December still to come, on average the month of December returns around 5%. Q4 2024 has been the strongest quarter since Q1 which returned 69%.
It seems a matter of when not if, bitcoin breaks past $100,000 while it is on track towards an all-time high monthly close.
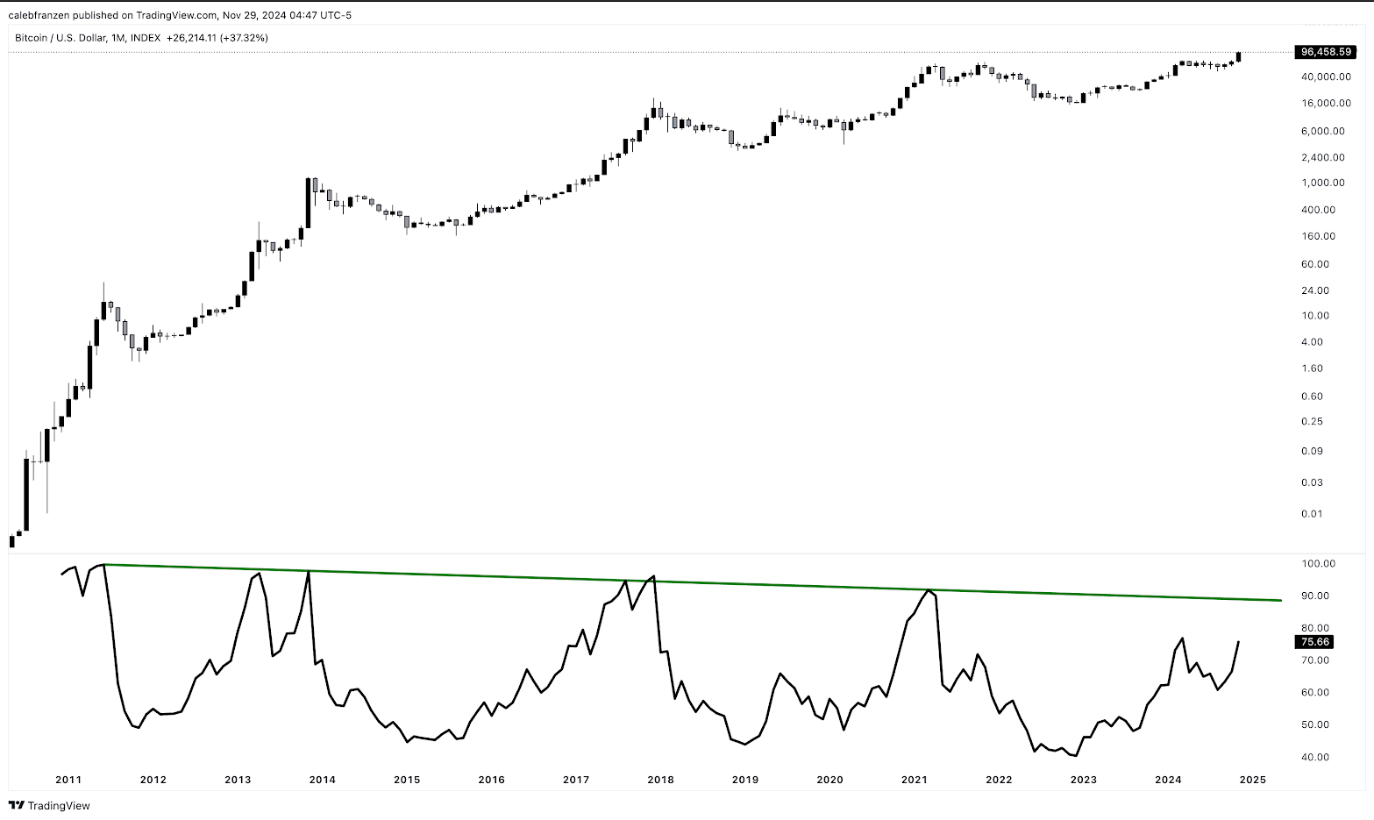
Analyst Caleb Franzen believes there is more juice left to squeeze in this current bitcoin bull market.
«BTCUSD monthly chart with the RSI indicator: Bitcoin bull markets often peak with the monthly RSI trading above 90, versus the current level of 75. Historically, we’ve seen each bull market peak with a lower RSI, illustrated by the descending trend line, Franzen says. The implication is that momentum is not yet «overheated» and that more upside can be squeezed out of this uptrend in the months/quarters ahead».
Similar market structure to Q4 2020
Bitcoin is in a similar market structure to Q4 2020, both periods saw strong green months in October and November, with a correction during the <a href=»https://www.coindesk.com/markets/2024/11/26/bitcoins-tumble-to-91-k-evokes-thanksgiving-massacre-of-2020″ target=»_blank»>2020 Thanksgiving period</a>. In the back end of 2020, this was when bitcoin conclusively left behind the psychological barrier of $10,000 and went to $60,000 by April 2021.
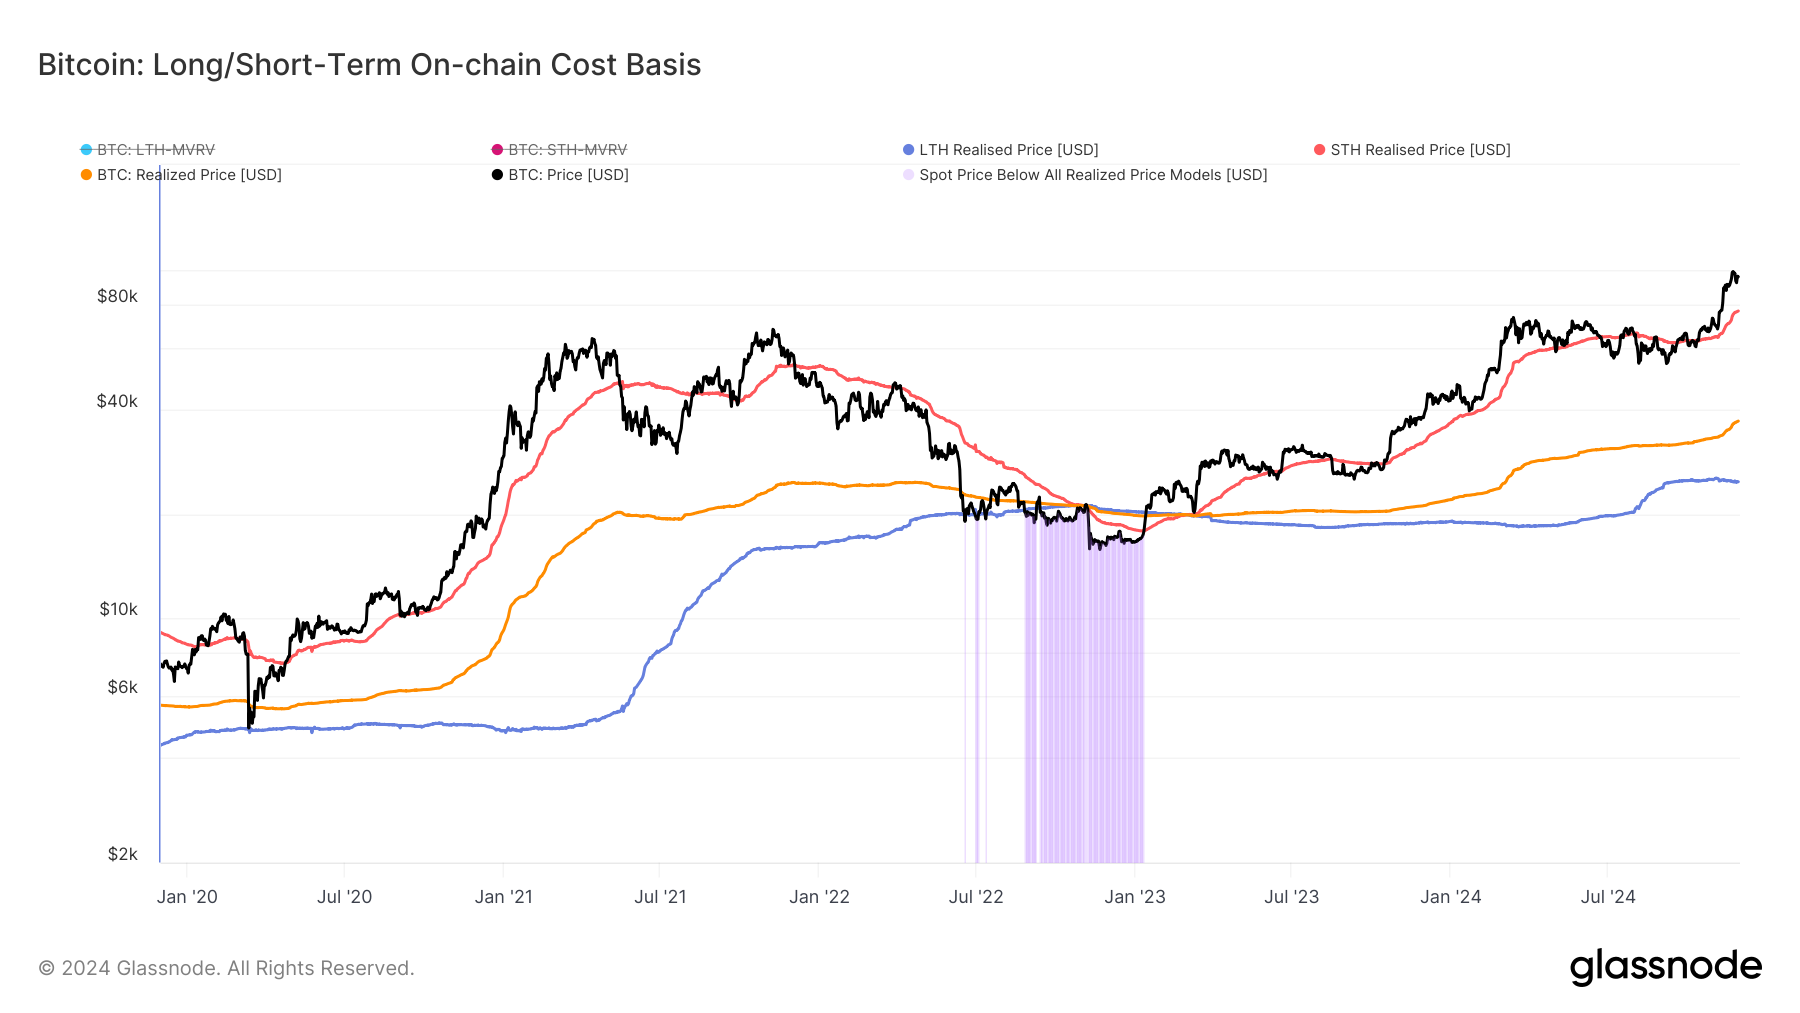
Glassnode data shows that when bitcoin is above the short-term holder’s realized price (STHRP) it tends to mean bitcoin is in a bull market. In Q4 2020, bitcoin used the STHRP consistently as a support level, as the price continued higher.
An expectation could be that bitcoin continues higher and using the STHRP as a support level mimicking Q4 2020. STHP reflects the average on-chain acquisition price for coins held outside exchange reserves, which were moved within the last 155 days. These reflect the most probable coins to be spent on any given day.
There is also a growing divergence between the realized price (which reflects the average on-chain acquisition price for the entire coin supply) and the long-term holder realized price (LTHRP) which reflects the average on-chain acquisition price for coins held outside exchange reserves, which have not moved within the last 155-days. These reflect the least probable coins to be spent on any given day.
A growing divergence tells us that new participants are entering the market while long-term holders are spending or realizing profits.
One very small data point indicates that bitcoin could even hit $100,000 on Nov. 29. Bitcoin first hit $1,000 on Nov. 27, 2013. Four years and one day later, bitcoin first hit $10,000. Could we see $100,000, just seven years and one day later?

Crypto trading firm Keyrock said it’s expanding into asset and wealth management by acquiring Turing Capital, a Luxembourg-registered alternative investment fund manager.
The deal, announced on Tuesday, marks the launch of Keyrock’s Asset and Wealth Management division, a new business unit dedicated to institutional clients and private investors.
Keyrock, founded in Brussels, Belgium and best known for its work in market making, options and OTC trading, said it will fold Turing Capital’s investment strategies and Luxembourg fund management structure into its wider platform. The division will be led by Turing Capital co-founder Jorge Schnura, who joins Keyrock’s executive committee as president of the unit.
The company said the expansion will allow it to provide services across the full lifecycle of digital assets, from liquidity provision to long-term investment strategies. «In the near future, all assets will live onchain,» Schnura said, noting that the merger positions the group to capture opportunities as traditional financial products migrate to blockchain rails.
Keyrock has also applied for regulatory approval under the EU’s crypto framework MiCA through a filing with Liechtenstein’s financial regulator. If approved, the firm plans to offer portfolio management and advisory services, aiming to compete directly with traditional asset managers as well as crypto-native players.
«Today’s launch sets the stage for our longer-term ambition: bringing asset management on-chain in a way that truly meets institutional standards,» Keyrock CSO Juan David Mendieta said in a statement.
Read more: Stablecoin Payments Projected to Top $1T Annually by 2030, Market Maker Keyrock Says
Gemini Space Station (GEMI), the crypto exchange founded by Cameron and Tyler Winklevoss, has seen its shares tumble by more than 20% since listing on the Nasdaq last Friday.
The stock is down around 6% on Tuesday, trading at $30.42, and has dropped nearly 24% over the past week. The sharp decline follows an initial surge after the company raised $425 million in its IPO, pricing shares at $28 and valuing the firm at $3.3 billion before trading began.
On its first day, GEMI spiked to $45.89 before closing at $32 — a 14% premium to its offer price. But since hitting that high, shares have plunged more than 34%, erasing most of the early enthusiasm from public market investors.
The broader crypto equity market has remained more stable. Coinbase (COIN), the largest U.S. crypto exchange, is flat over the past week. Robinhood (HOOD), which derives part of its revenue from crypto, is down 3%. Token issuer Circle (CRCL), on the other hand, is up 13% over the same period.
Part of the pressure on Gemini’s stock may stem from its financials. The company posted a $283 million net loss in the first half of 2025, following a $159 million loss in all of 2024. Despite raising fresh capital, the numbers suggest the business is still far from turning a profit.
Compass Point analyst Ed Engel noted that GEMI is currently trading at 26 times its annualized first-half revenue. That multiple — often used to gauge whether a stock is expensive — means investors are paying 26 dollars for every dollar the company is expected to generate in sales this year. For a loss-making company in a volatile sector, that’s a steep price, and could be fueling investor skepticism.


Crypto Trading Firm Keyrock Buys Luxembourg’s Turing Capital in Asset Management Push
Crypto Trading Firm Keyrock Buys Luxembourg’s Turing Capital in Asset Management Push

Gemini Shares Slide 6%, Extending Post-IPO Slump to 24%
-

 Business11 месяцев ago
3 Ways to make your business presentation more relatable
-
Fashion11 месяцев ago
According to Dior Couture, this taboo fashion accessory is back
-
Entertainment11 месяцев ago
10 Artists who retired from music and made a comeback
-
Entertainment11 месяцев ago
\’Better Call Saul\’ has been renewed for a fourth season
-
Entertainment11 месяцев ago
New Season 8 Walking Dead trailer flashes forward in time
-
Business11 месяцев ago
15 Habits that could be hurting your business relationships
-
Entertainment11 месяцев ago
Meet Superman\’s grandfather in new trailer for Krypton
-
Entertainment11 месяцев ago
Disney\’s live-action Aladdin finally finds its stars