Uncategorized
Bitcoin Volatility Comes Alive Ahead of PCE Inflation Data: Crypto Daybook Americas

Crypto Daybook Americas will not be published on Monday due to the Labor Day holiday. It will return on Tuesday.
By Omkar Godbole (All times ET unless indicated otherwise)
Bitcoin (BTC) has dropped nearly 3% to $109,800 in the past 24 hours, pulling the broader market, including ether (ETH), down with it. But those losses are nothing out of the ordinary, meaning major tokens are trading near recent valuations.
What’s new today is that BTC’s volatility is bouncing from recent multiyear lows (See Chart of the Day). The 30-day implied volatility, as represented by Volmex’s BVIV and Deribit’s DVOL indices, has surged above the 100-day simple moving average for the first time since mid-June. Perhaps the price turbulence that some traders predicted for August may unfold in September.
The increase could be noteworthy for stock traders as an early indicator of a potential uptick in Wall Street’s VIX. The VIX is inversely correlated with stocks, suggesting there’s of a rough day ahead on Wall Street, a possibility underlined by fiat liquidity dynamics.
«Market liquidity pressures are mounting as reserve balances decline and large Treasury settlements approach, leaving equities vulnerable despite lower volatility,» Michael Kramer, the founder of Mott Capital Management, wrote in the latest edition of the firm’s markets update.
One piece of data to keep an eye on is the U.S. core PCE release, due later today.
«This PCE release will shape the Fed’s future easing path rather than the September decision itself,» analysts from crypto exchange Bitunix wrote in an email. «If data comes in at or below expectations, risk sentiment can hold; but if significantly hotter, the Fed’s forward guidance may shift toward a ‘one-and-wait’ stance. Investors should focus on core services and wage trends, alongside U.S. Treasury yields and the DXY as key drivers of risk appetite.»
In the event of a soft CPI, ether may outperform because traders have been increasingly focusing on Ethereum’s native token. That’s evident from the ETF flows. This week, the U.S.-listed ETH ETFs have registered a net inflow of over $1 billion, SoSoValue data show. That’s close to double the $567 million entering the bitcoin ETFs.
In traditional markets, the spread between the U.S. 10- and two-year Treasury yields has risen to the highest since September 2022. The so-called curve steepening supports the bullish case in gold and bitcoin. Stay alert!
What to Watch
- Crypto
- Aug. 29, 2 p.m.: The Stellar Development Foundation will host a livestream on X to discuss how NEAR Intents will enable new DeFi use cases on the Stellar blockchain.
- Aug. 30: Conflux (CFX), a layer-1 blockchain focused on high throughput and Ethereum compatibility, will activate its v3.0.1 hard fork network upgrade at epoch 129,680,000 introducing 8 enhancements to improve EVM compatibility, fix bugs and optimize performance. Node operators must upgrade before Sept. 1 to ensure network compatibility.
- Sept. 1: Starknet (STRK), a layer-2 scaling product for Ethereum, will introduce its v0.14.0 mainnet upgrade featuring decentralized sequencing, subsecond transaction pre-confirmations and an EIP-1559 fee market to improve speed and decentralization.
- Sept. 3, 10:15 a.m.: Tellor (TRB), a decentralized oracle network that operates as an Ethereum layer-2 blockchain, will upgrade its mainnet to version 5.1.1. The upgrade improves network performance and node operation, enhancing Tellor’s role in providing off-chain data to Ethereum smart contracts.
- Sept. 4: Polygon will switch its mainnet token to POL from MATIC. Holders of MATIC on Ethereum, Polygon zkEVM or centralized exchanges may need to take action.
- Macro
- Aug. 29, 8:30 a.m.: The U.S. Bureau of Economic Analysis (BEA) releases July consumer income and expenditure data.
- Core PCE Price Index MoM Est. 0.3% vs. Prev. 0.3%
- Core PCE Price Index YoY Est. 2.9% vs. Prev. 2.8%
- PCE Price Index MoM Est. 0.2% vs. Prev. 0.3%
- PCE Price Index YoY Est. 2.6% vs. Prev. 2.6%
- Personal Income MoM Est. 0.4% vs. Prev. 0.3%
- Personal Spending MoM Est. 0.5% vs. Prev. 0.3%
- Aug. 29, 11 a.m.: Colombia’s National Administrative Department of Statistics (DANE) releases July unemployment rate data.
- Unemployment Rate Est. 8.9% vs. Prev. 8.6%
- Aug. 30 – Sept. 1: The Shanghai Cooperation Organization (SCO) — a Eurasian intergovernmental alliance focused on regional security, economic cooperation, and political coordination — holds its 25th annual summit in Tianjin, China.
- Sept. 1, 9 a.m.: S&P Global releases August Brazil data on manufacturing and services activity.
- Manufacturing PMI Prev. 48.2
- Sept. 1, 11 a.m.: S&P Global releases August Mexico data on manufacturing and services activity.
- Manufacturing PMI Prev. 49.10
- Sept. 1, 11 a.m.: Peru’s National Institute of Statistics and Informatics releases August consumer price inflation data.
- Inflation Rate MoM Prev. 0.23%
- Inflation Rate YoY Prev. 1.69%
- Aug. 29, 8:30 a.m.: The U.S. Bureau of Economic Analysis (BEA) releases July consumer income and expenditure data.
- Earnings (Estimates based on FactSet data)
- none in the near future
Token Events
- Governance votes & calls
- GMX (GMX) is voting on approving a recurring monthly treasury swap to support the expansion of GMX Solana. Voting closes on Aug. 30.
- Sonic (S) is voting on a potential U.S. ETF listing and building a strategic reserve to strengthen the balance sheet of a Nasdaq-listed vehicle. Voting closes on Aug. 31.
- dYdX (DYDX) is voting on whether to approve the v9.0 software upgrade. Voting ends on Aug. 31.
- Aug. 29: TON (TON) to host ask me anything with Atomic Wallet on TON’s role in Telegram’s growth at 7 a.m.
- Aug. 29: IOTA (IOTA) to host monthly call on the mainnet upgrade at at 9 a.m.
- Aug. 29: Basic Attention (BAT) to host X spaces event on paywalls at 1 p.m.
- Aug. 29: NEAR Protocol (NEAR) and Stellar (XLM) to host livestream on new DeFi use cases at 2 p.m.
- Unlocks
- Sept. 1: Sui (SUI) to release 1.25% of its circulating supply worth $153.1 million.
- Sept. 2: Ethena (ENA) to release 0.64% of its circulating supply worth $25.64 million.
- Sept. 5: Immutable (IMX) to unlock 1.27% of its circulating supply worth $13.26 million.
- Sept. 11: Aptos (APT) to unlock 2.2% of its circulating supply worth $48.18 million.
- Token Launches
- Aug. 29: CeluvPlay (CELB) to list on KuCoin, Gate and MEXC.
- Aug. 29: Camp Network (CAMP) to list on Bithumb.
- Aug. 29: Kori (KORI) to list on KuCoin.
Conferences
The CoinDesk Policy & Regulation conference (formerly known as State of Crypto) is a one-day boutique event held in Washington on Sept. 10 that allows general counsels, compliance officers and regulatory executives to meet with public officials responsible for crypto legislation and regulatory oversight. Space is limited. Use code CDB15 for 15% off your registration through Sept. 1.
- Aug. 29: Bitcoin Asia 2025 (Hong Kong)
- Sept. 3-4: CONF3RENCE (Dortmund, Germany)
- Sept. 3-5: bitcoin++ (Istanbul)
- Sept. 4-5: ETHWarsaw 2025 (Warsaw)
- Sept. 4-6: Taipei Blockchain Week (Taiwan)
- Sept. 5: Bitcoin Indonesia Conference 2025 (Bali)
Token Talk
By Shaurya Malwa
- Solana (SOL) posted a 44% drop in second-quarter application revenue, sliding to to $576.4 million from $1 billion in the first quarter even as its DeFi sector expanded, according to Messari.
- The downturn reflects weaker profitability across key decentralized apps. Pump.fun (PUMP) still led with $156.9 million, but was still down 44% as memecoin frenzy cooled.
- Axiom was the outlier, surging 641% to $126.6 million, showing how fast protocol-specific growth can offset broader ecosystem weakness. Jupiter (JUP) earned $66.4 million (–16%), while Phantom and Photon were hit hardest with declines of 65% and 72%, respectively.
- Despite revenue losses, DeFi TVL on Solana climbed 30% to $8.6 billion in the quarter and has since crossed $11 billion, cementing the chain as the largest DeFi network behind Ethereum.
- Kamino Finance drove TVL growth, up 34% to $2.1 billion after introducing Kamino Lend V2, which attracted $200 million in deposits and $80 million in loans within three weeks. Kamino now controls 25% of Solana’s market share.
- Raydium staged a strong comeback, rising 54% to $1.8 billion in TVL, reclaiming second place from Jupiter. It now commands 21% share versus Jupiter’s 19%.
- Trading activity, however, told a different story: Average daily spot DEX volume fell 45% to $2.5 billion, reflecting a fading of the memecoin momentum that had fueled the previous quarter’s records.
Derivatives Positioning
- Open interest (OI) in futures tied to the top 20 coins, excluding SOL, has decreased in the past 24 hours, indicating broad-based capital outflows.
- SOL’s open interest, however, hit a record high 63.84 million, alongside a rally in the token’s price to $217, a level last seen in February.
- The eight-hour funding rates for ether, tron and BNB flipped slightly negative, indicating a bias for bearish bets on a drop in prices. Funding rates for other major tokens were steady at around zero, indicating neutral sentiment.
- OI in the CME bitcoin futures slipped to 135.72K BTC, the lowest since April, while ether OI remained elevated at record highs near 2.10 million ETH. The divergence suggests a continued preference among investors for ETH over BTC.
- On Deribit, downside bias in BTC options has strengthened across all tenors, with puts trading at a five volatility premium to calls at the front end. ETH options display similar dynamics, marking a shift from bullish positioning early this week.
- On Paradigm, block flows featured call selling and put rolling strategies in BTC and ETH. Market maker Wintermute pointed to demand for call spreads in the December expiry BTC options.
Market Movements
- BTC is down 1.87% from 4 p.m. ET Thursday at $109,828.05 (24hrs: +1.95%)
- ETH is down 2.66% at $4,013.41 (24hrs: -5.69%)
- CoinDesk 20 is down 2.52% at 4,168.55 (24hrs: -3.73%)
- Ether CESR Composite Staking Rate is up 2 bps at 2.92%
- BTC funding rate is at 0.0056% (6.0992% annualized) on Binance

- DXY is up 0.14% at 97.95
- Gold futures are down 0.18% at $3,467.90
- Silver futures are down 0.54% at $39.49
- Nikkei 225 closed down 0.26% at 42,718.47
- Hang Seng closed up 0.32% at 25,077.62
- FTSE is down 0.27% at 9,192.27
- Euro Stoxx 50 is down 0.52% at 5,368.49
- DJIA closed on Thursday up 0.16% at 45,636.90
- S&P 500 closed up 0.32% at 6,501.86
- Nasdaq Composite closed up 0.53% at 21,705.16
- S&P/TSX Composite closed unchanged at 28,434.80
- S&P 40 Latin America closed up 1.07% at 2,770.74
- U.S. 10-Year Treasury rate is up 1.8 bps at 4.225%
- E-mini S&P 500 futures are down 0.32% at 6,496.75
- E-mini Nasdaq-100 futures are down 0.47% at 23,657.75
- E-mini Dow Jones Industrial Average Index are down 0.34% at 45,551.00
Bitcoin Stats
- BTC Dominance: 58.41% (+0.25%)
- Ether-bitcoin ratio: 0.03954 (-1.35%)
- Hashrate (seven-day moving average): 978 EH/s
- Hashprice (spot): $53.73
- Total fees: 3.3 BTC / $371,906
- CME Futures Open Interest: 135,720 BTC
- BTC priced in gold: 32.2 oz.
- BTC vs gold market cap: 9.11%
Technical Analysis
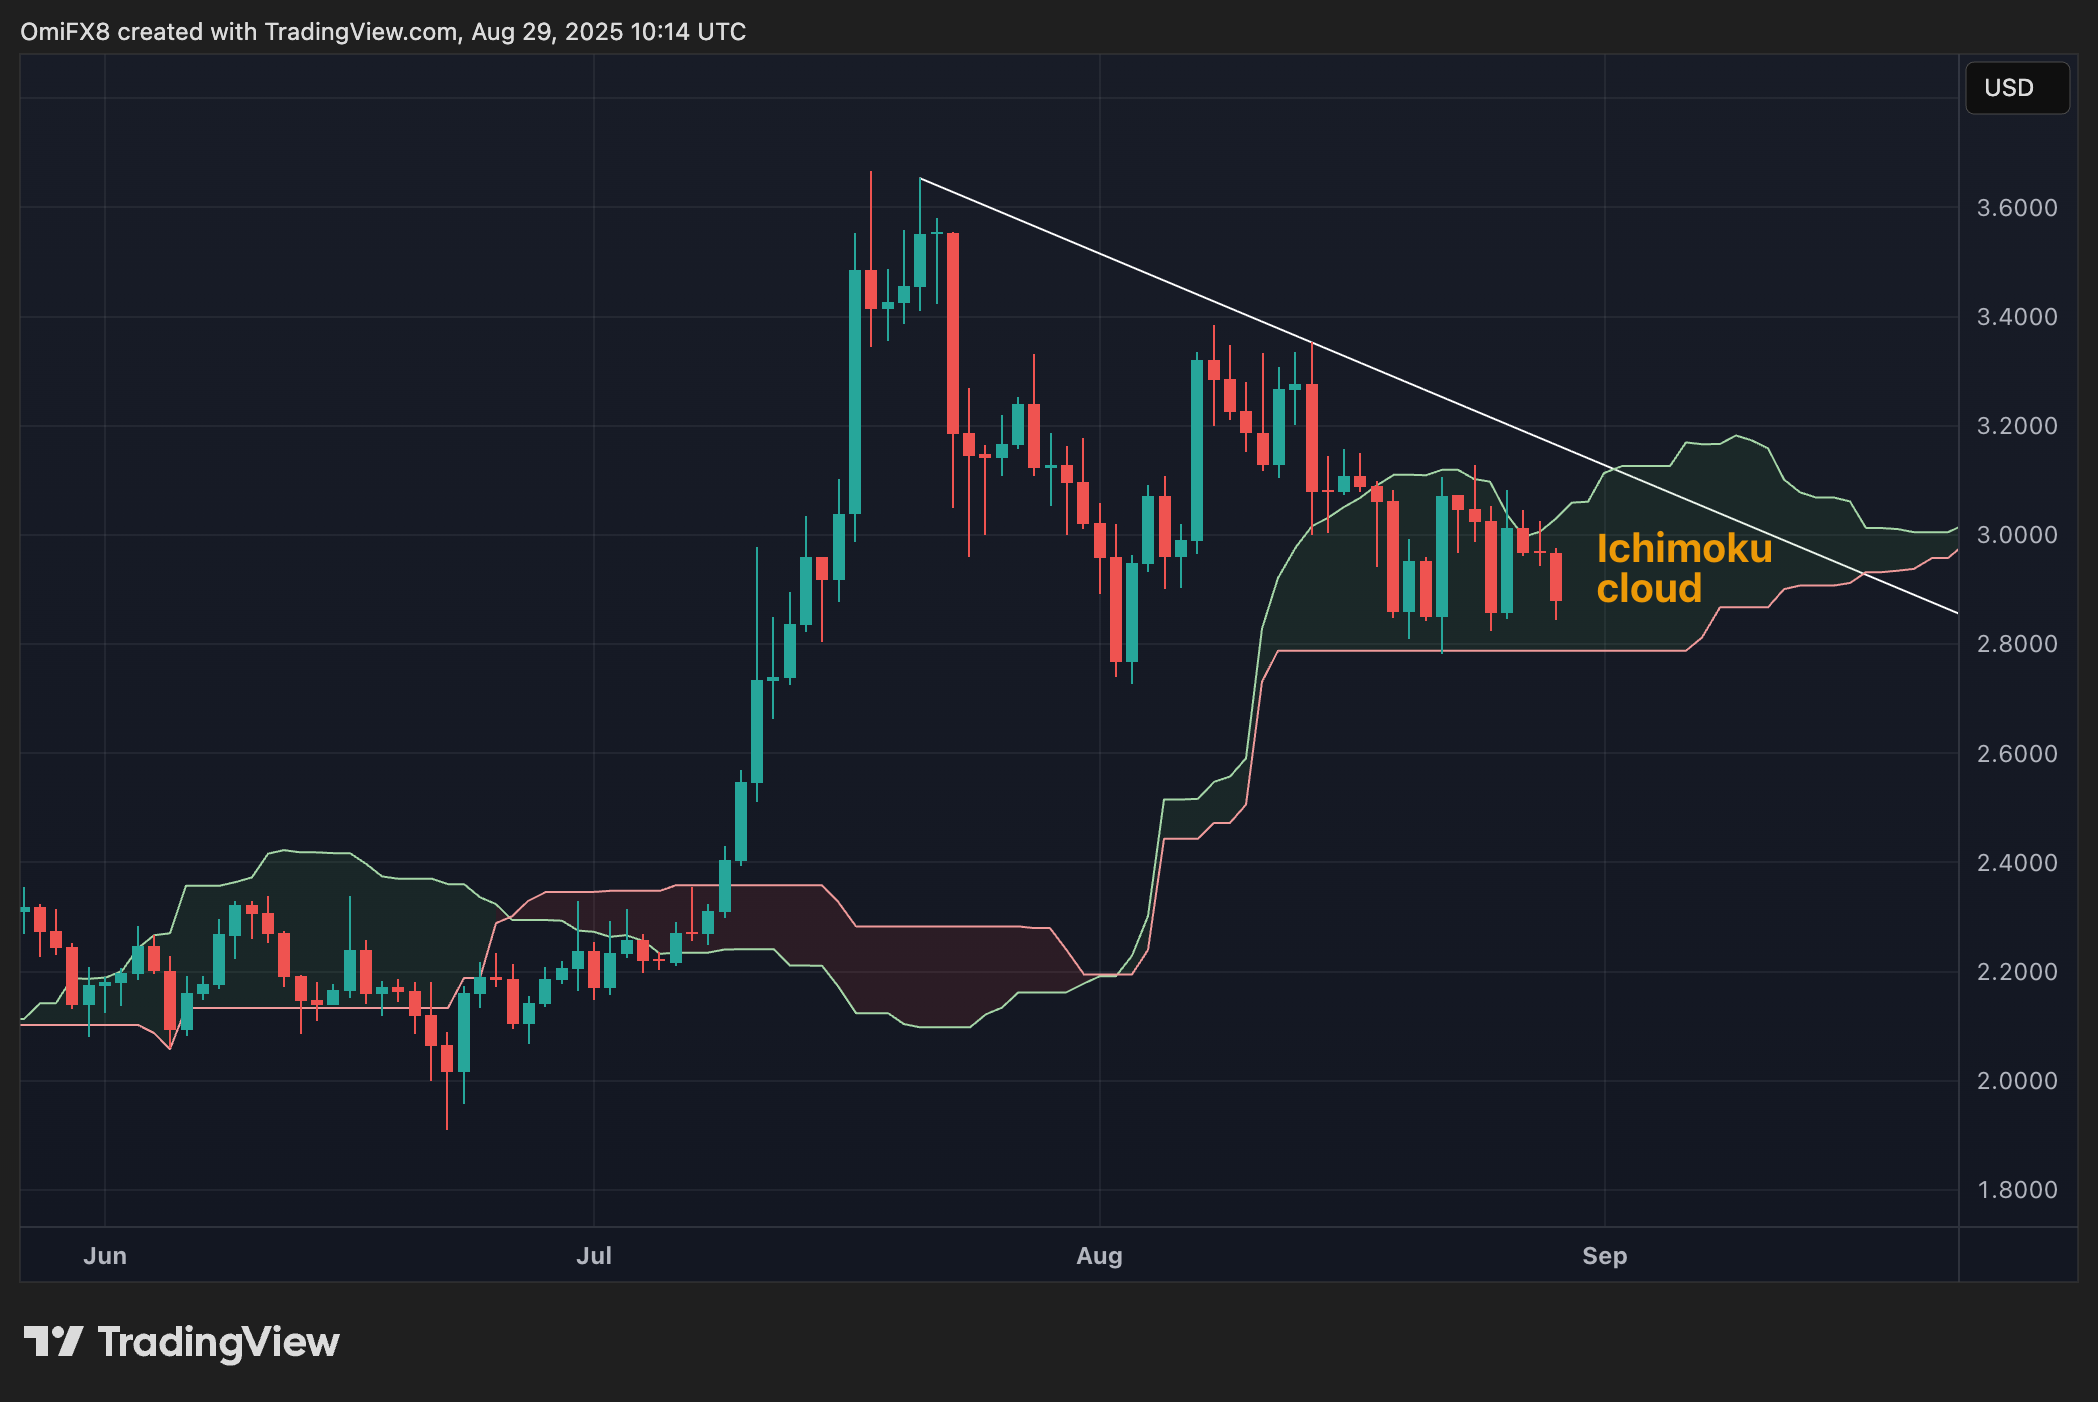
- The chart shows XRP’s price is stuck within the Ichimoku cloud, indicating a clear directional bias in the market.
- A move below the cloud would confirm a bearish trend shift, opening the way for a deeper decline.
- The price has already established a downtrend since peaking at $3.65 in July.
Crypto Equities
- Coinbase Global (COIN): closed on Thursday at $308.47 (-0.16%), -1.53% at $303.75 in pre-market
- Circle (CRCL): closed at $130.94 (+2.78%), -0.69% at $130.04
- Galaxy Digital (GLXY): closed at $24.51 (+0.41%), -2.08% at $24
- Bullish (BLSH): closed at $64.43 (+0.7%), -2.5% at $62.82
- MARA Holdings (MARA): closed at $15.96 (+0.69%), -2.26% at $15.60
- Riot Platforms (RIOT): closed at $13.8 (+1.84%), -1.88% at $13.54
- Core Scientific (CORZ): closed at $14.35 (+1.06%), -1.74% at $14.10
- CleanSpark (CLSK): closed at $9.55 (-0.31%), -1.26% at $9.43
- CoinShares Valkyrie Bitcoin Miners ETF (WGMI): closed at $29.67 (+1.23%), +0.78% at $29.90
- Exodus Movement (EXOD): closed at $26.16 (-4%), unchanged in pre-market
Crypto Treasury Companies
- Strategy (MSTR): closed at $338.84 (-0.94%), -1.84% at $332.60
- Semler Scientific (SMLR): closed at $30.63 (+0.23%), -0.2% at $30.57
- SharpLink Gaming (SBET): closed at $18.46 (-4.2%), -3.14% at $17.88
- Upexi (UPXI): closed at $8.09 (-1.58%), -5.32% at $7.66
- Mei Pharma (MEIP): closed at $5.2 (+0.78%)
ETF Flows
Spot BTC ETFs
- Daily net flows: $178.9 million
- Cumulative net flows: $54.34 billion
- Total BTC holdings ~1.29 million
Spot ETH ETFs
- Daily net flows: $39.1 million
- Cumulative net flows: $13.7 billion
- Total ETH holdings ~6.6 million
Source: Farside Investors
Chart of the Day
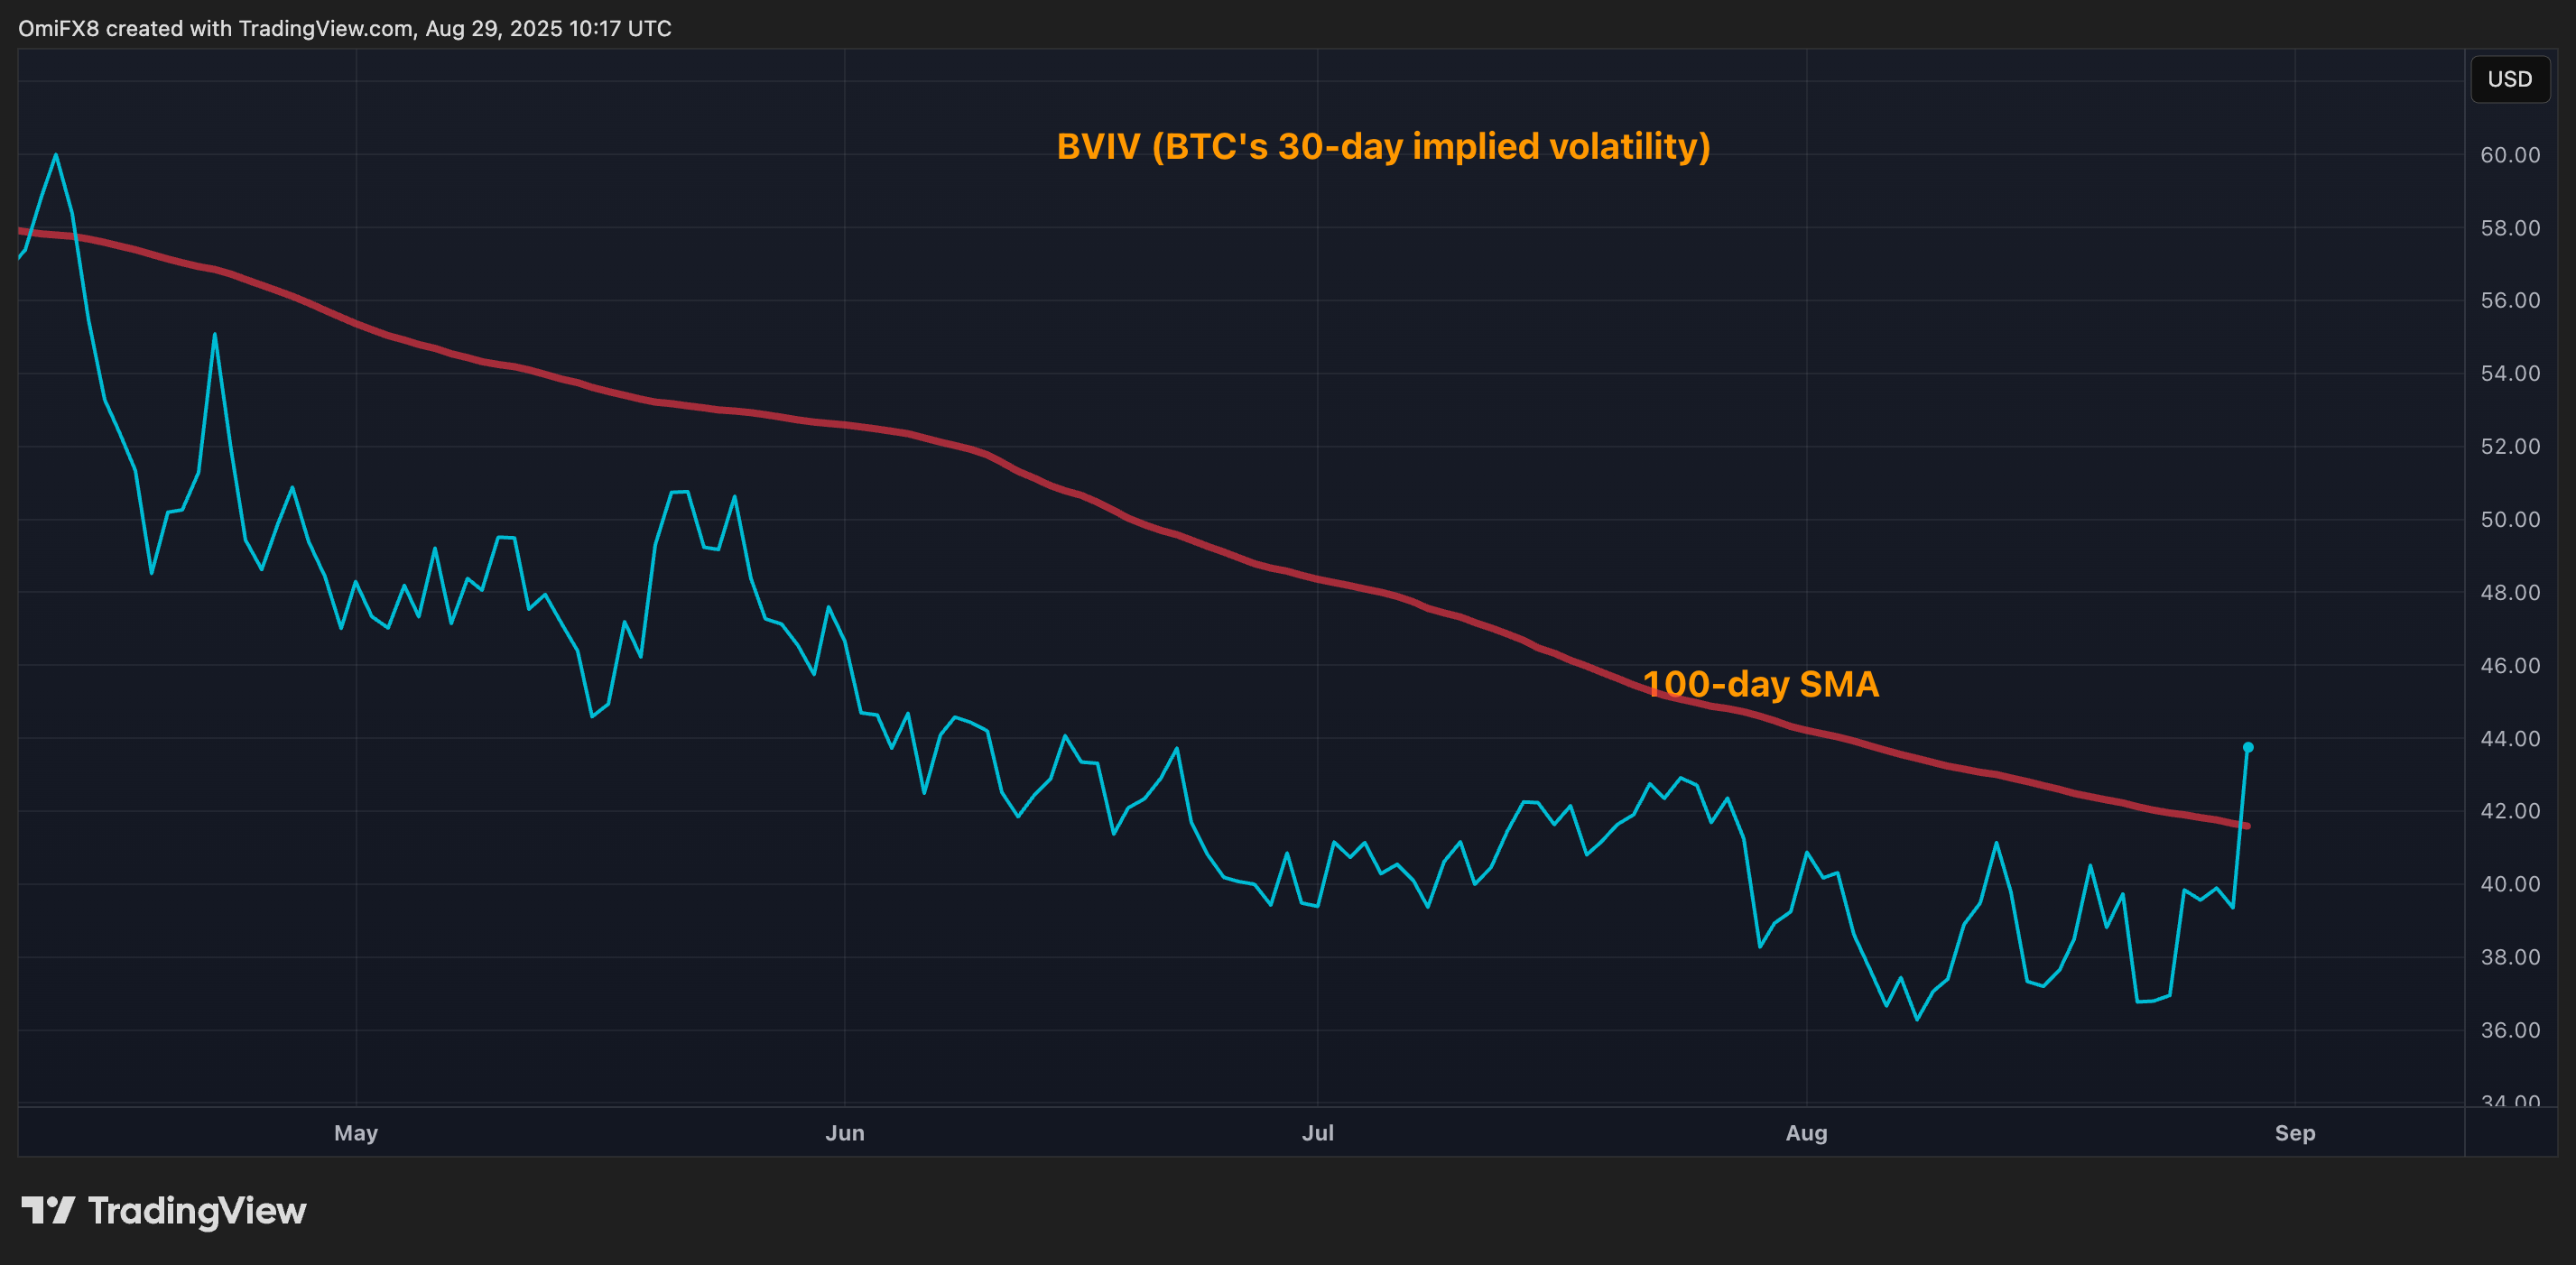
- Volmex’s BVIV index, which represents bitcoin’s 30-day implied volatility, has risen above the 100-day simple moving average for the first time since April.
- The uptick could be an early indicator of an impending rise in Wall Street’s so-called fear gauge, the VIX index.
While You Were Sleeping
- China Says Stronger Ties With India Is in Interest of Both Sides (Bloomberg): China’s Foreign Ministry said Xi’s 2024 meeting with Modi restarted relations, stressing there was no “secret diplomacy” and that both sides are resuming dialogue while seeking a long-term strategic framework.
- Stand Up to Trump on Big Tech, Says EU Antitrust Chief (Financial Times): The European Commission’s executive vice president said Brussels may walk away from a new trade deal if Trump demands weakening of the bloc’s Digital Services Act and Digital Markets Act.
- Bitcoin Bull Market May End Early, Warns Key Indicator, But Flows Continue to Lean Bullish (CoinDesk): RSI, a key momentum gauge, suggests bitcoin’s rally may be running out of steam, but large trades in options markets suggest many investors are still betting on gains into year-end.
- Bitcoin Headed to $190K on Institutional Wave, Research Firm Says (CoinDesk): Tiger Research argues record liquidity, ETF accumulation and Trump’s 401(k) order give bitcoin its strongest institutional setup in years, though weak retail activity and on-chain signals show risks remain.
- IREN Posts First Full-Year Profit on AI Cloud Growth, Mining Expansion; Shares Climb (CoinDesk): The company reported a $86.9 million profit on record $501 million revenue, with bitcoin mining generating $1 billion annually and the AI cloud unit set to reach $250 million in annualized revenue by year-end.
- A Tariff Loophole on Cheap Imports Has Closed. How Will It Affect Shoppers? (The New York Times): From today, individuals and businesses in the U.S. can no longer receive packages under $800 tariff-free from abroad, a change set to raise shopping costs and disrupt supply chains.
In the Ether



Uncategorized
BitMEX Co-Founder Arthur Hayes Sees Money Printing Extending Crypto Cycle Well Into 2026

Arthur Hayes believes the current crypto bull market has further to run, supported by global monetary trends he sees as only in their early stages.
Speaking in a recent interview with Kyle Chassé, a longtime bitcoin and Web3 entrepreneur, the BitMEX co-founder and current Maelstrom CIO argued that governments around the world are far from finished with aggressive monetary expansion.
He pointed to U.S. politics in particular, saying that President Donald Trump’s second term has not yet fully unleashed the spending programs that could arrive from mid-2026 onward. Hayes suggested that if expectations for money printing become extreme, he may consider taking partial profits, but for now he sees investors underestimating the scale of liquidity that could flow into equities and crypto.
Hayes tied his outlook to broader geopolitical shifts, including what he described as the erosion of a unipolar world order. In his view, such periods of instability tend to push policymakers toward fiscal stimulus and central bank easing as tools to keep citizens and markets calm.
He also raised the possibility of strains within Europe — even hinting that a French default could destabilize the euro — as another factor likely to accelerate global printing presses. While he acknowledged these policies eventually risk ending badly, he argued that the blow-off top of the cycle is still ahead.
Turning to bitcoin, Hayes pushed back on concerns that the asset has stalled after reaching a record $124,000 in mid-August.
He contrasted its performance with other asset classes, noting that while U.S. stocks are higher in dollar terms, they have not fully recovered relative to gold since the 2008 financial crisis. Hayes pointed out that real estate also lags when measured against gold, and only a handful of U.S. technology giants have consistently outperformed.
When measured against bitcoin, however, he believes all traditional benchmarks appear weak.
Hayes’ message was that bitcoin’s dominance becomes even clearer once assets are viewed through the lens of currency debasement.
For those frustrated that bitcoin is not posting fresh highs every week, Hayes suggested that expectations are misplaced.
In his telling, investors from the traditional world and those in crypto actually share the same premise: governments and central banks will print money whenever growth falters. Hayes says traditional finance tends to express this view by buying bonds on leverage, while crypto investors hold bitcoin as the “faster horse.”
His conclusion is that patience is essential. Hayes argued that the real edge of holding bitcoin comes from years of compounding outperformance rather than short-term speculation.
Coupled with what he sees as an inevitable wave of money creation through the rest of the decade, he believes the present crypto cycle could stretch well into 2026, far from exhausted.
Uncategorized
Bitcoin Bulls Bet on Fed Rate Cuts To Drive Bond Yields Lower, But There’s a Catch

On Sept. 17, the U.S. Federal Reserve (Fed) is widely expected to cut interest rates by 25 basis points, lowering the benchmark range to 4.00%-4.25%. This move will likely be followed by more easing in the coming months, taking the rates down to around 3% within the next 12 months. The fed funds futures market is discounting a drop in the fed funds rate to less than 3% by the end of 2026.
Bitcoin (BTC) bulls are optimistic that the anticipated easing will push Treasury yields sharply lower, thereby encouraging increased risk-taking across both the economy and financial markets. However, the dynamics are more complex and could lead to outcomes that differ significantly from what is anticipated.
While the expected Fed rate cuts could weigh on the two-year Treasury yield, those at the long end of the curve may remain elevated due to fiscal concerns and sticky inflation.
Debt supply
The U.S. government is expected to increase the issuance of Treasury bills (short-term instruments) and eventually longer-duration Treasury notes to finance the Trump administration’s recently approved package of extended tax cuts and increased defense spending. According to the Congressional Budget Office, these policies are likely to add over $2.4 trillion to primary deficits over ten years, while Increasing debt by nearly $3 trillion, or roughly $5 trillion if made permanent.
The increased supply of debt will likely weigh on bond prices and lift yields. (bond prices and yields move in the opposite direction).
«The U.S. Treasury’s eventual move to issue more notes and bonds will pressure longer-term yields higher,» analysts at T. Rowe Price, a global investment management firm, said in a recent report.
Fiscal concerns have already permeated the longer-duration Treasury notes, where investors are demanding higher yields to lend money to the government for 10 years or more, known as the term premium.
The ongoing steepening of the yield curve – which is reflected in the widening spread between 10- and 2-year yields, as well as 30- and 5-year yields and driven primarily by the relative resilience of long-term rates – also signals increasing concerns about fiscal policy.
Kathy Jones, managing director and chief income strategist at the Schwab Center for Financial Research, voiced a similar opinion this month, noting that «investors are demanding a higher yield for long-term Treasuries to compensate for the risk of inflation and/or depreciation of the dollar as a consequence of high debt levels.»
These concerns could keep long-term bond yields from falling much, Jones added.
Stubborn inflation
Since the Fed began cutting rates last September, the U.S. labor market has shown signs of significant weakening, bolstering expectations for a quicker pace of Fed rate cuts and a decline in Treasury yields. However, inflation has recently edged higher, complicating that outlook.
When the Fed cut rates in September last year, the year-on-year inflation rate was 2.4%. Last month, it stood at 2.9%, the highest since January’s 3% reading. In other words, inflation has regained momentum, weakening the case for faster Fed rate cuts and a drop in Treasury yields.
Easing priced in?
Yields have already come under pressure, likely reflecting the market’s anticipation of Federal Reserve rate cuts.
The 10-year yield slipped to 4% last week, hitting the lowest since April 8, according to data source TradingView. The benchmark yield has dropped over 60 basis points from its May high of 4.62%.
According to Padhraic Garvey, CFA, regional head of research, Americas at ING, the drop to 4% is likely an overshoot to the downside.
«We can see the 10yr Treasury yield targeting still lower as an attack on 4% is successful. But that’s likely an overshoot to the downside. Higher inflation prints in the coming months will likely cause long-end yields some issues, requiring a significant adjustment,» Garvey said in a note to clients last week.
Perhaps rate cuts have been priced in, and yields could bounce back hard following the Sept. 17 move, in a repeat of the 2024 pattern. The dollar index suggests the same, as noted early this week.
Lesson from 2024
The 10-year yield fell by over 100 basis points to 3.60% in roughly five months leading up to the September 2024 rate cut.
The central bank delivered additional rate cuts in November and December. Yet, the 10-year yield bottomed out with the September move and rose to 4.57% by year-end, eventually reaching a high of 4.80% in January of this year.
According to ING, the upswing in yields following the easing was driven by economic resilience, sticky inflation, and fiscal concerns.
As of today, while the economy has weakened, inflation and fiscal concerns have worsened as discussed earlier, which means the 2024 pattern could repeat itself.
What it means for BTC?
While BTC rallied from $70,000 to over $100,000 between October and December 2024 despite rising long-term yields, this surge was primarily fueled by optimism around pro-crypto regulatory policies under President Trump and growing corporate adoption of BTC and other tokens.
However, these supporting narratives have significantly weakened looking back a year later. Consequently, the possibility of a potential hardening of yields in the coming months weighing over bitcoin cannot be dismissed.
Read: Here Are the 3 Things That Could Spoil Bitcoin’s Rally Towards $120K
Uncategorized
Are the Record Flows for Traditional and Crypto ETFs Reducing the Power of the Fed?

Record-breaking flows into exchange-traded funds may be reshaping markets in ways that even the Federal Reserve can’t control.
New data show U.S.-listed ETFs have become a dominant force in capital markets. According to a Friday press release by ETFGI, an independent consultancy, assets invested in U.S. ETFs hit a record $12.19 trillion at the end of August, up from $10.35 trillion at the close of 2024. Bloomberg, which highlighted the surge on Friday, noted the flows are challenging the traditional influence of the Federal Reserve.
Investors poured $120.65 billion into ETFs during August alone, lifting year-to-date inflows to $799 billion — the highest on record. By comparison, the prior full-year record was $643 billion in 2024.
The growth is concentrated among the biggest providers. iShares leads with $3.64 trillion in assets, followed closely by Vanguard with $3.52 trillion and State Street’s SPDR family at $1.68 trillion.
Together, those three firms control nearly three-quarters of the U.S. ETF market. Equity ETFs drew the largest share of August inflows at $42 billion, while fixed-income funds added $32 billion and commodity ETFs nearly $5 billion.
Crypto-linked ETFs are now a meaningful piece of the picture.
Data from SoSoValue show U.S.-listed spot bitcoin and ether ETFs manage more than $120 billion combined, led by BlackRock’s iShares Bitcoin Trust (IBIT) and Fidelity’s Wise Origin Bitcoin Trust (FBTC). Bitcoin ETFs alone account for more than $100 billion, equal to about 4% of bitcoin’s $2.1 trillion market cap. Ether ETFs add another $20 billion, despite launching only earlier this year.
The surge underscores how ETFs — traditional and crypto alike — have become the vehicle of choice for investors of all sizes. For many, the flows are automatic.
In the U.S., much of the cash comes from retirement accounts known as 401(k)s, where workers put aside part of every paycheck.
A growing share of that money goes into “target-date funds.” These funds automatically shift investments — moving gradually from stocks into bonds — as savers approach retirement age. Model portfolios and robo-advisers follow similar rules, automatically directing flows into ETFs without investors making day-to-day choices.
Bloomberg described this as an “autopilot” effect: every two weeks, millions of workers’ contributions are funneled into index funds that buy the same baskets of stocks, regardless of valuations, headlines or Fed policy. Analysts cited by Bloomberg say this steady demand helps explain why U.S. equity indexes keep climbing even as data on jobs and inflation show signs of strain.
The trend raises questions about the Fed’s influence.
Traditionally, interest rate cuts or hikes sent strong signals that rippled through stocks, bonds, and commodities. Lower rates typically encouraged risk-taking, while higher rates reined it in. But with ETFs absorbing hundreds of billions of dollars on a set schedule, markets may be less sensitive to central bank cues.
That tension is especially clear this month. With the Fed expected to cut rates by a quarter point on Sept. 17, stocks sit near record highs and gold trades above $3,600 an ounce.
Bitcoin, meanwhile, is trading at around $116,000, not far from its all-time high of $124,000 set in mid August.
Stock, bond and crypto ETFs have seen strong inflows, suggesting investors are positioning for easier money — but also reflecting a structural tide of passive allocations.
Supporters told Bloomberg the rise of ETFs has lowered costs and broadened access to markets. But critics quoted in the same report warn that the sheer scale of inflows could amplify volatility if redemptions cluster in a downturn, since ETFs move whole baskets of securities at once.
As Bloomberg put it, this “perpetual machine” of passive investing may be reshaping markets in ways that even the central bank struggles to counter.
-

 Business11 месяцев ago
3 Ways to make your business presentation more relatable
-

 Fashion11 месяцев ago
According to Dior Couture, this taboo fashion accessory is back
-

 Entertainment11 месяцев ago
10 Artists who retired from music and made a comeback
-

 Entertainment11 месяцев ago
\’Better Call Saul\’ has been renewed for a fourth season
-

 Entertainment11 месяцев ago
New Season 8 Walking Dead trailer flashes forward in time
-

 Business11 месяцев ago
15 Habits that could be hurting your business relationships
-

 Entertainment11 месяцев ago
Meet Superman\’s grandfather in new trailer for Krypton
-

 Entertainment11 месяцев ago
Disney\’s live-action Aladdin finally finds its stars


