Uncategorized
BTC Risks Deeper Slide to $100K, XRP Challenges Corrective Trend

This is a daily analysis of top tokens with CME futures by CoinDesk analyst and Chartered Market Technician Omkar Godbole.
Bitcoin: Risks deeper pullback
Bitcoin’s (BTC) multi-month rally appears to have hit a significant wall, with a confluence of bearish signals emerging across both weekly and daily charts.
The weekly candlestick chart shows that bulls have failed to establish a foothold above the macro trendline connecting the 2017 and 2021 bull market highs. This failed breakout is supported by weakening momentum, as the MACD histogram, though still positive, is significantly lower than its peak in December 2024 when the macro trendline was first tested.
")
The bearish sentiment is further reinforced by the 14-week RSI, which has broken its uptrend line from the March lows while continuing to print a series of lower highs since March 2024.
On a shorter-term daily timeframe, the shift in momentum is even more pronounced. The three-line break chart, a tool designed to filter out minor noise and confirm trend changes, has printed three straight red bricks (bars), a classic bearish reversal signal, confirming that sellers have seized control.
")
The combination of these signals – a failed long-term breakout, weakening momentum, and a confirmed short-term reversal – indicates that a deeper correction is now the path of least resistance and prices could take out the immediate support at $11,965, the former high hit in May, for a test of dip demand at $100,000.
Prices need to overcome $122,056 to invalidate the bearish setup.
- Resistance: $120,000, $122,056, $123,181.
- Support: $111,965, $112,301 (the 50-day SMA), $100,000.
XRP: Challenging downtrend line
While XRP (XRP) is attempting to break out of the downtrend line, which represents the recent correction, the overwhelming momentum from the moving averages across both the hourly and daily timeframes suggests that a sustained breakout may not occur immediately.
")
On the daily timeframe, the price has seen a modest bounce, but this rally is capped by the 38.2% Fibonacci retracement level, which is acting as a key resistance. This corrective move is happening against a bearish backdrop, with both the 5 and 10-day simple moving averages (SMAs) continuing to trend south, confirming the downward bias. Further, the 50-, 100-, and 200-hour SMAs are stacked in a bearish configuration, all trending south, a classic technical signal of a strong downtrend.
")
Should we close above $3.00, the focus would shift to the lower high of $3.33 registered on July 28.
- Resistance: $3.33, $3.65, $4.00.
- Support: $2.72, $2.65, $2.58.
Ether: Bearish outside week
Ether fell nearly 10% last week, forming a large bearish outside week candle, a significant bearish pattern, which indicates that sellers are looking to regain control.
")
This sentiment is reinforced on the daily timeframe. The daily candlestick chart shows that the 5- and 10-day SMAs have executed a bearish cross, confirming a break in the short-term uptrend.
So, while the price has seen a modest bounce since Sunday, its strength is questionable. This is further substantiated by the daily three-line break chart, which has printed two consecutive red bricks – a decisive bearish signal that confirms the trend has reversed to the downside.
The combination of these long-term and short-term charts suggests that the path of least resistance is now lower.
- Resistance: $3,941, $4,000, $4,100.
- Support: $3,355, $3,000, $2,879.
Solana: Golden cross
Solana’s recent pullback appears to be meeting a critical test, with bulls successfully defending a key support level over the past 24 hours. The price has bounced from the 61.8% Fibonacci retracement of its recent rally, a level often watched by traders as a strong potential price floor in an uptrend.
")
Meanwhile, a major long-term signal is on the horizon: the 50- and 200-day SMAs are nearing a «golden cross.» While this is a lagging indicator, a successful cross would be a powerful long-term bullish signal, confirming a major shift in momentum and potentially setting the stage for a new, sustained uptrend.
For traders, the coming days are critical, with the 61.8% Fib level needing to hold strong as support while the impending golden cross provides a bullish long-term tailwind. Also note that despite the defense of the Fib level, the short-term trend remains bearish, with the 5- and 10-day Simple Moving Averages (SMAs) continuing to trend lower.
- Resistance: $175, $187, $200.
- Support: $156, $145, $126.

Stellar’s XLM token endured sharp swings over the past 24 hours, tumbling 3% as institutional selling pressure dominated order books. The asset declined from $0.39 to $0.38 between September 14 at 15:00 and September 15 at 14:00, with trading volumes peaking at 101.32 million—nearly triple its 24-hour average. The heaviest liquidation struck during the morning hours of September 15, when XLM collapsed from $0.395 to $0.376 within two hours, establishing $0.395 as firm resistance while tentative support formed near $0.375.
Despite the broader downtrend, intraday action highlighted moments of resilience. From 13:15 to 14:14 on September 15, XLM staged a brief recovery, jumping from $0.378 to a session high of $0.383 before closing the hour at $0.380. Trading volume surged above 10 million units during this window, with 3.45 million changing hands in a single minute as bulls attempted to push past resistance. While sellers capped momentum, the consolidation zone around $0.380–$0.381 now represents a potential support base.
Market dynamics suggest distribution patterns consistent with institutional profit-taking. The persistent supply overhead has reinforced resistance at $0.395, where repeated rally attempts have failed, while the emergence of support near $0.375 reflects opportunistic buying during liquidation waves. For traders, the $0.375–$0.395 band has become the key battleground that will define near-term direction.
")
Technical Indicators
- XLM retreated 3% from $0.39 to $0.38 during the previous 24-hours from 14 September 15:00 to 15 September 14:00.
- Trading volume peaked at 101.32 million during the 08:00 hour, nearly triple the 24-hour average of 24.47 million.
- Strong resistance established around $0.395 level during morning selloff.
- Key support emerged near $0.375 where buying interest materialized.
- Price range of $0.019 representing 5% volatility between peak and trough.
- Recovery attempts reached $0.383 by 13:00 before encountering selling pressure.
- Consolidation pattern formed around $0.380-$0.381 zone suggesting new support level.
Disclaimer: Parts of this article were generated with the assistance from AI tools and reviewed by our editorial team to ensure accuracy and adherence to our standards. For more information, see CoinDesk’s full AI Policy.
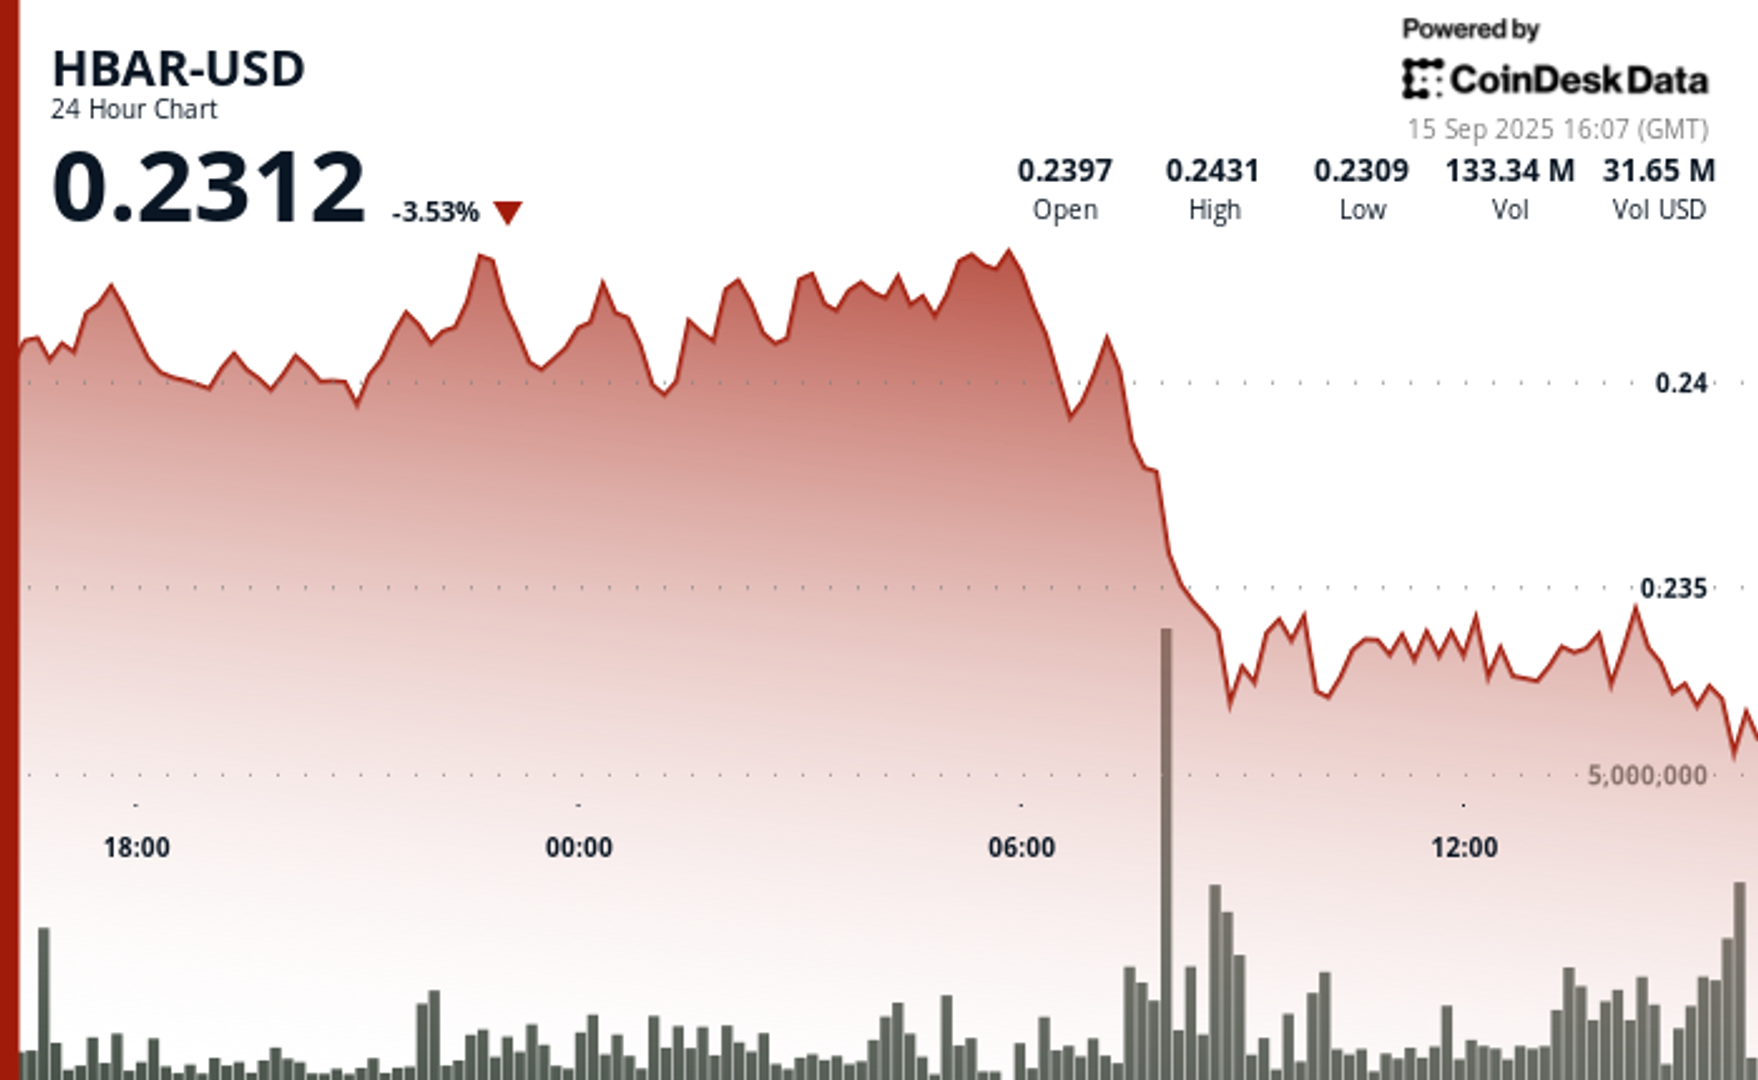
Hedera Hashgraph’s HBAR token endured steep losses over a volatile 24-hour window between September 14 and 15, falling 5% from $0.24 to $0.23. The token’s trading range expanded by $0.01 — a move often linked to outsized institutional activity — as heavy corporate selling overwhelmed support levels. The sharpest move came between 07:00 and 08:00 UTC on September 15, when concentrated liquidation drove prices lower after days of resistance around $0.24.
Institutional trading volumes surged during the session, with more than 126 million tokens changing hands on the morning of September 15 — nearly three times the norm for corporate flows. Market participants attributed the spike to portfolio rebalancing by large stakeholders, with enterprise adoption jitters and mounting regulatory scrutiny providing the backdrop for the selloff.
Recovery efforts briefly emerged during the final hour of trading, when corporate buyers tested the $0.24 level before retreating. Between 13:32 and 13:35 UTC, one accumulation push saw 2.47 million tokens deployed in an effort to establish a price floor. Still, buying momentum ultimately faltered, with HBAR settling back into support at $0.23.
The turbulence underscores the token’s vulnerability to institutional distribution events. Analysts point to the failed breakout above $0.24 as confirmation of fresh resistance, with $0.23 now serving as the critical support zone. The surge in volume suggests major corporate participants are repositioning ahead of regulatory shifts, leaving HBAR’s near-term outlook dependent on whether enterprise buyers can mount sustained defenses above key support.
")
Technical Indicators Summary
- Corporate resistance levels crystallized at $0.24 where institutional selling pressure consistently overwhelmed enterprise buying interest across multiple trading sessions.
- Institutional support structures emerged around $0.23 levels where corporate buying programs have systematically absorbed selling pressure from retail and smaller institutional participants.
- The unprecedented trading volume surge to 126.38 million tokens during the 08:00 morning session reflects enterprise-scale distribution strategies that overwhelmed corporate demand across major trading platforms.
- Subsequent institutional momentum proved unsustainable as systematic selling pressure resumed between 13:37-13:44, driving corporate participants back toward $0.23 support zones with sustained volumes exceeding 1 million tokens, indicating ongoing institutional distribution.
- Final trading periods exhibited diminishing corporate activity with zero recorded volume between 13:13-14:14, suggesting institutional participants adopted defensive positioning strategies as HBAR consolidated at $0.23 amid enterprise uncertainty.
Disclaimer: Parts of this article were generated with the assistance from AI tools and reviewed by our editorial team to ensure accuracy and adherence to our standards. For more information, see CoinDesk’s full AI Policy.
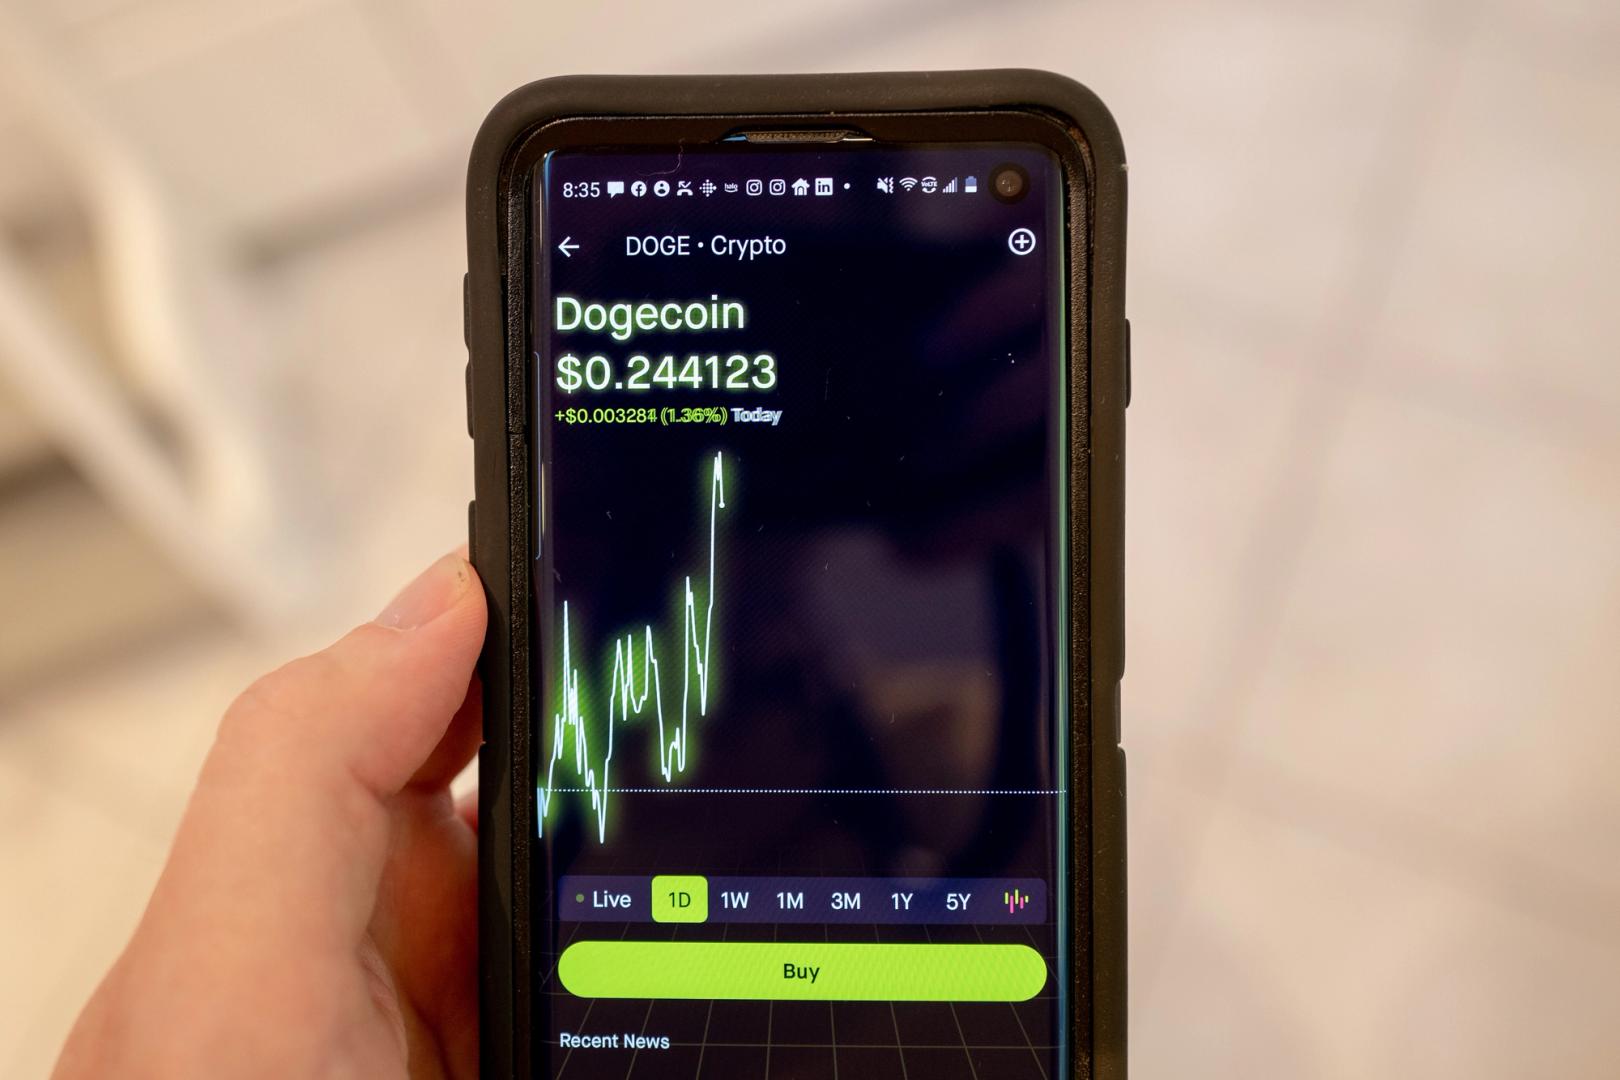
The first exchange-traded fund (ETF) built around a meme coin could hit the market this week, after multiple delays and much speculation.
The DOGE ETF — formally called the Rex Shares-Osprey Dogecoin ETF (DOJE) — was originally slated to debut last week, alongside a handful of politically themed and crypto-related ETFs. Those included funds tied to Bonk (BONK), XRP, Bitcoin (BTC) and even a Trump-themed fund. But DOJE’s debut never materialized.
Now, Bloomberg ETF analysts Eric Balchunas and James Seyffart believe Wednesday is the most likely launch date, though they caution nothing is certain.
“It’s more likely than not,” Seyffart said. “That seems like the base case.”
Ahead of the introduction of the ETF, DOGE has been among the top performers over the past month, ahead 15% even including a decline of 3.5% over the past 24 horus.
If launched, DOJE would mark a milestone as the first U.S. ETF to focus on a meme coin — cryptocurrencies that generally lack utility or a clear economic purpose. These include tokens like Dogecoin, Shiba Inu (SHIB) and Bonk, which often surge in popularity thanks to internet culture, celebrity endorsements and speculative trading.
Balchunas described DOJE’s significance in a post on X: “First-ever US ETF to hold something that has no utility on purpose.”
DOJE is not a spot ETF. That means it won’t hold DOGE directly. Instead, the fund will use a Cayman Islands-based subsidiary to gain exposure through futures and other derivatives. This approach sidesteps the need for physical custody of the coin while still offering traders a way to bet on its performance within a traditional brokerage account.
The ETF was approved earlier this month under the Investment Company Act of 1940, which is typically used for mutual funds and diversified ETFs. That sets it apart from the wave of bitcoin ETFs that received green lights under the Securities Act of 1933, a framework used for commodity-based and asset-backed products. In short, DOJE is structured more like a mutual fund than a commodity trust.
More direct exposure may be coming soon. Several firms have filed applications to launch spot DOGE ETFs, which would hold the meme coin itself rather than derivatives. These applications are still under review by the U.S. Securities and Exchange Commission (SEC), which has grown more comfortable with crypto ETFs since approving a slate of bitcoin products in early 2024.
The broader crypto market has shown that investor demand can outweigh fundamental critiques. Meme coins have long drawn skepticism for having no underlying value or use case, but that hasn’t kept them from drawing billions in speculative capital.
Seyffart said the ETF market is likely to follow the same path. “There’s going to be a bunch of products like this, whether you love it or need it, they’re going to be coming to market,” he said.
He added that many existing financial products serve no deeper purpose than providing a vehicle for short-term bets. “There’s plenty of products out there that are just being used as gambling or short-term trading,” he said. “So if there’s an audience for this in the crypto world, I wouldn’t be surprised at all if this finds an audience in the ETF and TradFi world.”
Whether the DOJE ETF opens the door to more meme coin funds — or just proves the concept is viable — may depend on how the market responds this week. Either way, it signals a new phase in the merging of internet culture and traditional finance.


XLM Sees Heavy Volatility as Institutional Selling Weighs on Price

HBAR Tumbles 5% as Institutional Investors Trigger Mass Selloff

Dogecoin Inches Closer to Wall Street With First Meme Coin ETF
-

 Business11 месяцев ago
3 Ways to make your business presentation more relatable
-
Fashion11 месяцев ago
According to Dior Couture, this taboo fashion accessory is back
-
Entertainment11 месяцев ago
10 Artists who retired from music and made a comeback
-
Entertainment11 месяцев ago
\’Better Call Saul\’ has been renewed for a fourth season
-
Entertainment11 месяцев ago
New Season 8 Walking Dead trailer flashes forward in time
-
Business11 месяцев ago
15 Habits that could be hurting your business relationships
-
Entertainment11 месяцев ago
Meet Superman\’s grandfather in new trailer for Krypton
-
Entertainment11 месяцев ago
Disney\’s live-action Aladdin finally finds its stars