Uncategorized
Why ‘ETH Is Going to $10,000,’ Explains EMJ Capital Founder and President
On Sunday, Eric Jackson, the founder and president of Toronto-based hedge fund EMJ Capital posted a thread on X that explained his firm’s bullishness on ether (ETH).
According to Jackson, the market has underestimated the impact of upcoming developments, particularly the anticipated approval of staking for ETH exchange-traded funds (ETFs) by October 2025. He argued that this event, rather than the already-approved ETH ETFs, represents the true catalyst for significant price growth, as it could transform ether into a yield-generating asset attractive to institutional investors.
Jackson explained that his firm’s model anticipates a supply crunch driven by several factors. He highlighted that staking approval would likely lead to increased institutional demand, reduced circulating supply, and passive investment flows from traditional finance. Combined with Ethereum’s deflationary tokenomics post-merge, growing transaction fees from layer-2 solutions, and the rise of real-world asset (RWA) tokenization, he believes these dynamics could significantly boost ETH’s value.
Jackson emphasized that Ethereum’s ability to generate real revenue positions it as an undervalued network, poised to become an institutional-grade yield product rather than merely a speculative asset.
In his analysis, Jackson projected a base case of ether reaching $10,000 by the end of the current market cycle, with a more optimistic scenario of $15,000 or higher if layer-2 adoption and ETF inflows exceed expectations.
He noted that while Bitcoin continues to dominate market attention with its price surpassing $120,000, Ethereum is quietly establishing itself as a critical infrastructure for cryptocurrency transactions.
Jackson also expressed skepticism about the analogy of Ethereum as “digital oil,” instead suggesting that its role as a foundational platform for commerce in a crypto-driven economy aligns it with companies like Circle, Coinbase, Shopify, and Robinhood. His firm remains bullish, maintaining a long position in the $ETHA ETF and plans to update its model as new developments unfold.
With the crypto market struggling today in the wake of the profit-taking that took bitcoin’s price in the past two days from above $123,000 to around $116,000, the ether price is holding up relatively well, down only 0.6% in the past 24-hour period at the time of writing. One reason for that is probably the support from Nasdaq-listed SharpLink Gaming (SBET).
Earlier today, the firm announced via a post on X that it has solidified its position as the largest corporate holder of ether globally, surpassing even the Ethereum Foundation. The company disclosed that between July 7 and July 13, 2025, it acquired approximately 74,656 ETH for roughly $213 million, at an average price of $2,852 per ETH, bringing its total holdings to around 280,706 ETH.
It says that this aggressive acquisition strategy, funded in part by raising $413 million through the sale of 24.5 million shares via its At-The-Market (ATM) facility during the same period, underscores its commitment to making ether its primary treasury reserve asset.
The announcement also highlighted that approximately 99.7% of SharpLink’s ETH holdings are actively staked, generating around 415 ETH in staking rewards since the company launched its ETH-focused treasury strategy on June 2, 2025.
Additionally, SharpLink reported a 23% increase in its proprietary “ETH Concentration” metric since June 13, 2025, reflecting greater ETH exposure per share. This move aligns with the company’s broader vision, articulated by Chairman Joseph Lubin, a co-founder of Ethereum, to position SharpLink at the forefront of digital commerce by leveraging Ethereum’s utility in decentralized finance and blockchain infrastructure.
Technical Analysis
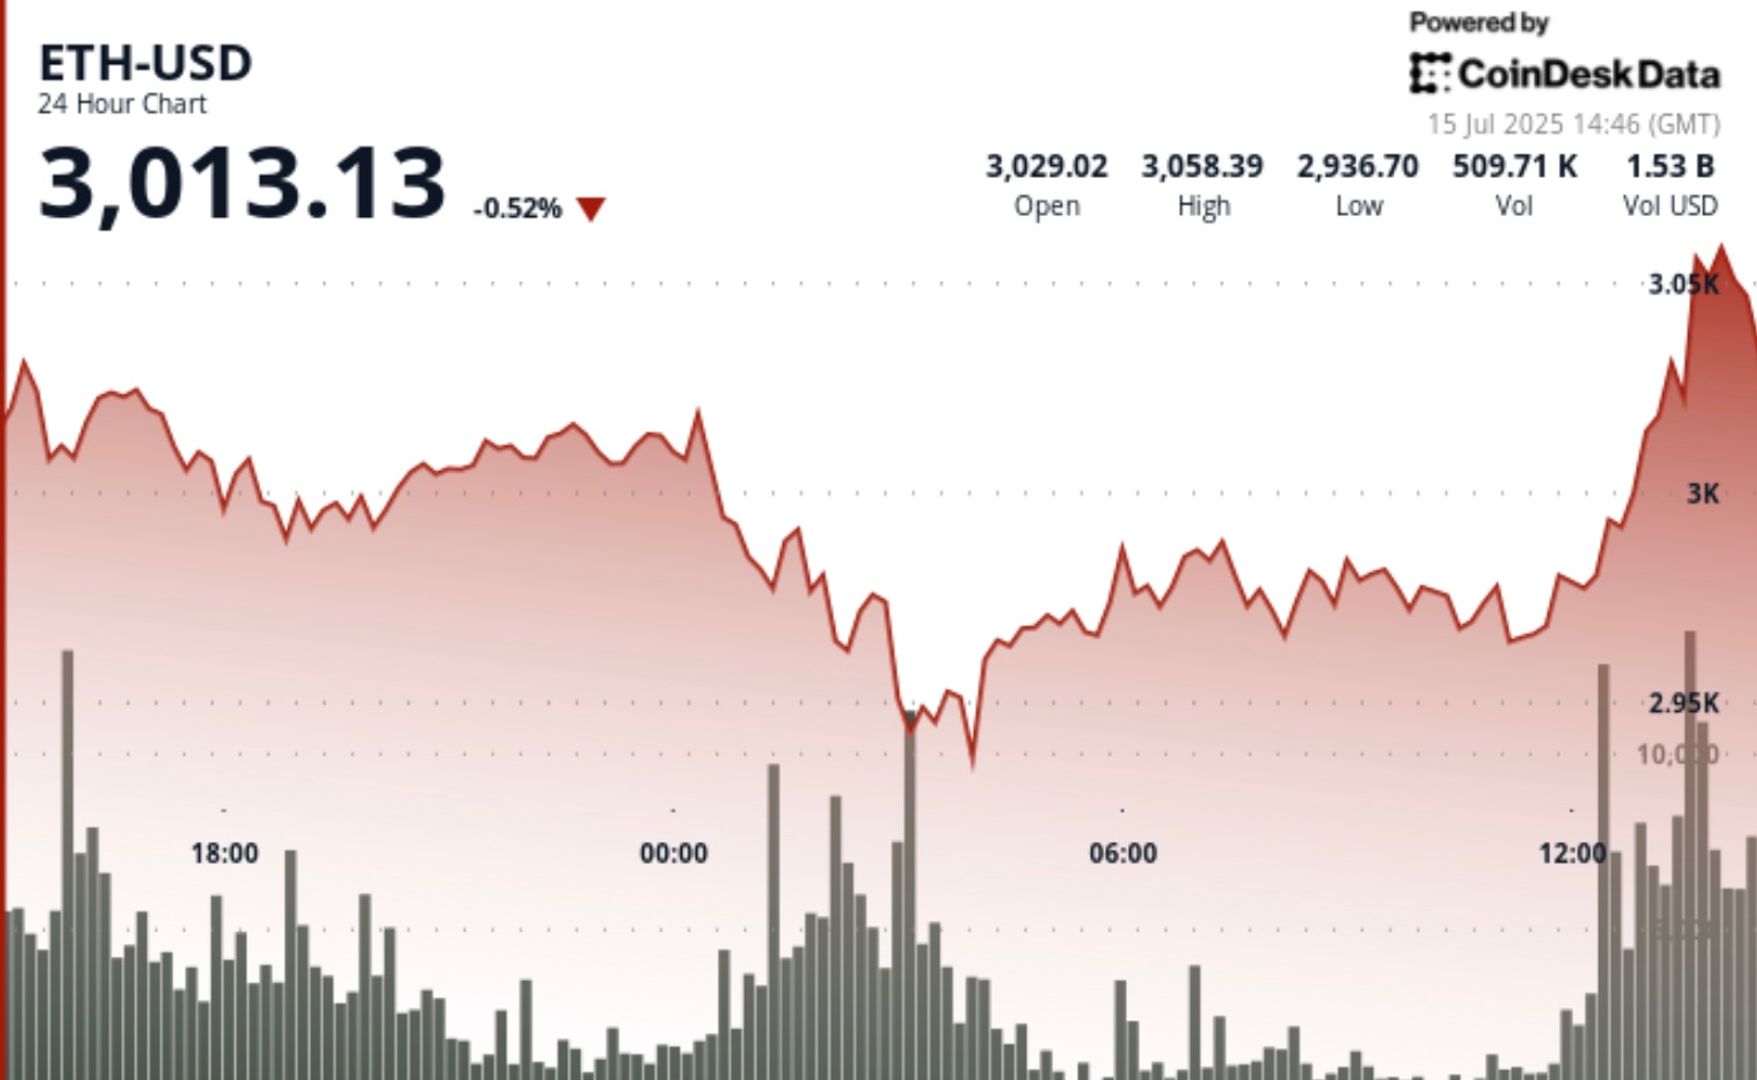
- According to CoinDesk Research’s technical analysis model, ETH-USD showcased very high volatility throughout the 24-hour period from July 14 15:00 UTC to July 15 14:00 UTC, establishing a trading corridor of $132.08 that constituted 4% movement between the session’s floor at $2,933.50 and ceiling at $3,065.45.
- The trading session was characterized by sustained bearish pressure during overnight hours, witnessing ETH’s descent from $3,013.65 to reach the daily nadir of $2,933.50 approximately at 03:00, subsequently entering a lateral consolidation phase within the $2,960-$2,990 bandwidth throughout the majority of the session.
- The pivotal moment materialized during the concluding trading hour as ETH orchestrated a spectacular ascent from $3,000.02 to $3,051.89, accumulating $51.87 gains within a single hour accompanied by extraordinary trading activity of 496,321 units — exceeding twice the 24-hour baseline of roughly 225,000.
- This dynamic surge indicates robust institutional positioning and signals a potential breakthrough beyond the $3,000 psychological barrier that previously constrained upward momentum attempts.
- ETH-USD exhibited extraordinary price action during the final 60 minutes spanning 15 July 13:08 UTC to 14:07 UTC, accelerating from $3,016.75 to achieve a session pinnacle of $3,065.45 before consolidating at $3,047.00, marking a net appreciation of $30.25 or 1%.
- The timeframe showcased a compelling breakout narrative commencing at 13:25 when ETH catapulted from $3,017.89 to $3,026.08, succeeded by persistent bullish momentum that reached its zenith during the 13:42 to 13:50 UTC interval, where valuation skyrocketed from $3,029.14 to $3,065.37 — capturing $36.23 appreciation within an 8-minute window as trading activity surged beyond 21,000 units at 13:46, approaching triple the hourly baseline.
- This powerful advance definitively penetrated the $3,030 resistance threshold and established fresh session peaks, although subsequent profit-realization dynamics surfaced during the concluding 17 minutes, retreating ETH to $3,047.00 amid declining activity that reached zero during the final three minutes, indicating momentary fatigue following the exponential climb.
Disclaimer: Parts of this article were generated with the assistance from AI tools and reviewed by our editorial team to ensure accuracy and adherence to our standards. For more information, see CoinDesk’s full AI Policy.

Good Morning, Asia. Here’s what’s making news in the markets:
Welcome to Asia Morning Briefing, a daily summary of top stories during U.S. hours and an overview of market moves and analysis. For a detailed overview of U.S. markets, see CoinDesk’s Crypto Daybook Americas.
Bitcoin (BTC) traded just above $115k in Asia Tuesday morning, slipping slightly after a strong start to the week.
The modest pullback followed a run of inflows into U.S. spot ETFs and lingering optimism that the Federal Reserve will cut rates next week. The moves left traders divided: is this recovery built on fragile foundations, or is crypto firmly back on track after last week’s CPI-driven jitters?
That debate is playing out across research desks. Glassnode’s weekly pulse emphasizes fragility. While ETF inflows surged nearly 200% last week and futures open interest jumped, the underlying spot market looks weak.
Buying conviction remains shallow, Glassnode writes, funding rates have softened, and profit-taking is on the rise with more than 92% of supply in profit.
Options traders have also scaled back downside hedges, pushing volatility spreads lower, which Glassnode warns leaves the market exposed if risk returns. The core message: ETFs and futures are supporting the rally, but without stronger spot flows, BTC remains vulnerable.
QCP takes the other side.
The Singapore-based desk says crypto is “back on track” after CPI confirmed tariff-led inflation without major surprises. They highlight five consecutive days of sizeable BTC ETF inflows, ETH’s biggest inflow in two weeks, and strength in XRP and SOL even after ETF delays.
Traders, they argue, are interpreting regulatory postponements as inevitability rather than rejection. With the Altcoin Season Index at a 90-day high, QCP sees BTC consolidation above $115k as the launchpad for rotation into higher-beta assets.
The divide underscores how Bitcoin’s current range near $115k–$116k is a battleground. Glassnode calls it fragile optimism; QCP calls it momentum. Which side is right may depend on whether ETF inflows keep offsetting profit-taking in the weeks ahead.
")
Market Movement
BTC: Bitcoin is consolidating near the $115,000 level as traders square positions ahead of expected U.S. Fed policy moves; institutional demand via spot Bitcoin ETFs is supporting upside
ETH: ETH is trading near $4500 in a key resistance band; gains are being helped by renewed institutional demand, tightening supply (exchange outflows), and positive technical setups.
Gold: Gold continues to hold near record highs, underpinned by expectations of Fed interest rate cuts, inflation risk, and investor demand for safe havens; gains tempered somewhat by profit‑taking and a firmer U.S. dollar
Nikkei 225: Japan’s Nikkei 225 topped 45,000 for the first time Monday, leading Asia-Pacific gains as upbeat U.S.-China trade talks and a TikTok divestment framework lifted sentiment.
S&P 500: The S&P 500 rose 0.5% to close above 6,600 for the first time on Monday as upbeat U.S.-China trade talks and anticipation of a Fed meeting lifted stocks.
Elsewhere in Crypto

Wall Street giant Citigroup (C) has launched new ether (ETH) forecasts, calling for $4,300 by year-end, which would be a decline from the current $4,515.
That’s the base case though. The bank’s full assessment is wide enough to drive an army regiment through, with the bull case being $6,400 and the bear case $2,200.
The bank analysts said network activity remains the key driver of ether’s value, but much of the recent growth has been on layer-2s, where value “pass-through” to Ethereum’s base layer is unclear.
Citi assumes just 30% of layer-2 activity contributes to ether’s valuation, putting current prices above its activity-based model, likely due to strong inflows and excitement around tokenization and stablecoins.
A layer 1 network is the base layer, or the underlying infrastructure of a blockchain. Layer 2 refers to a set of off-chain systems or separate blockchains built on top of layer 1s.
Exchange-traded fund (ETF) flows, though smaller than bitcoin’s (BTC), have a bigger price impact per dollar, but Citi expects them to remain limited given ether’s smaller market cap and lower visibility with new investors.
Macro factors are seen adding only modest support. With equities already near the bank’s S&P 500 6,600 target, the analysts do not expect major upside from risk assets.
Read more: Ether Bigger Beneficiary of Digital Asset Treasuries Than Bitcoin or Solana: StanChart

Stellar’s XLM token endured sharp swings over the past 24 hours, tumbling 3% as institutional selling pressure dominated order books. The asset declined from $0.39 to $0.38 between September 14 at 15:00 and September 15 at 14:00, with trading volumes peaking at 101.32 million—nearly triple its 24-hour average. The heaviest liquidation struck during the morning hours of September 15, when XLM collapsed from $0.395 to $0.376 within two hours, establishing $0.395 as firm resistance while tentative support formed near $0.375.
Despite the broader downtrend, intraday action highlighted moments of resilience. From 13:15 to 14:14 on September 15, XLM staged a brief recovery, jumping from $0.378 to a session high of $0.383 before closing the hour at $0.380. Trading volume surged above 10 million units during this window, with 3.45 million changing hands in a single minute as bulls attempted to push past resistance. While sellers capped momentum, the consolidation zone around $0.380–$0.381 now represents a potential support base.
Market dynamics suggest distribution patterns consistent with institutional profit-taking. The persistent supply overhead has reinforced resistance at $0.395, where repeated rally attempts have failed, while the emergence of support near $0.375 reflects opportunistic buying during liquidation waves. For traders, the $0.375–$0.395 band has become the key battleground that will define near-term direction.
")
Technical Indicators
- XLM retreated 3% from $0.39 to $0.38 during the previous 24-hours from 14 September 15:00 to 15 September 14:00.
- Trading volume peaked at 101.32 million during the 08:00 hour, nearly triple the 24-hour average of 24.47 million.
- Strong resistance established around $0.395 level during morning selloff.
- Key support emerged near $0.375 where buying interest materialized.
- Price range of $0.019 representing 5% volatility between peak and trough.
- Recovery attempts reached $0.383 by 13:00 before encountering selling pressure.
- Consolidation pattern formed around $0.380-$0.381 zone suggesting new support level.
Disclaimer: Parts of this article were generated with the assistance from AI tools and reviewed by our editorial team to ensure accuracy and adherence to our standards. For more information, see CoinDesk’s full AI Policy.


Asia Morning Briefing: Fragility or Back on Track? BTC Holds the Line at $115K

Wall Street Bank Citigroup Sees Ether Falling to $4,300 by Year-End

XLM Sees Heavy Volatility as Institutional Selling Weighs on Price
-

 Business11 месяцев ago
3 Ways to make your business presentation more relatable
-
Fashion11 месяцев ago
According to Dior Couture, this taboo fashion accessory is back
-
Entertainment11 месяцев ago
10 Artists who retired from music and made a comeback
-
Entertainment11 месяцев ago
\’Better Call Saul\’ has been renewed for a fourth season
-
Entertainment11 месяцев ago
New Season 8 Walking Dead trailer flashes forward in time
-
Business11 месяцев ago
15 Habits that could be hurting your business relationships
-
Entertainment11 месяцев ago
Meet Superman\’s grandfather in new trailer for Krypton
-
Entertainment11 месяцев ago
Disney\’s live-action Aladdin finally finds its stars