Uncategorized
Bonk.fun Grabs 55% of Solana Token Issuance Share, Pushes BONK Demand
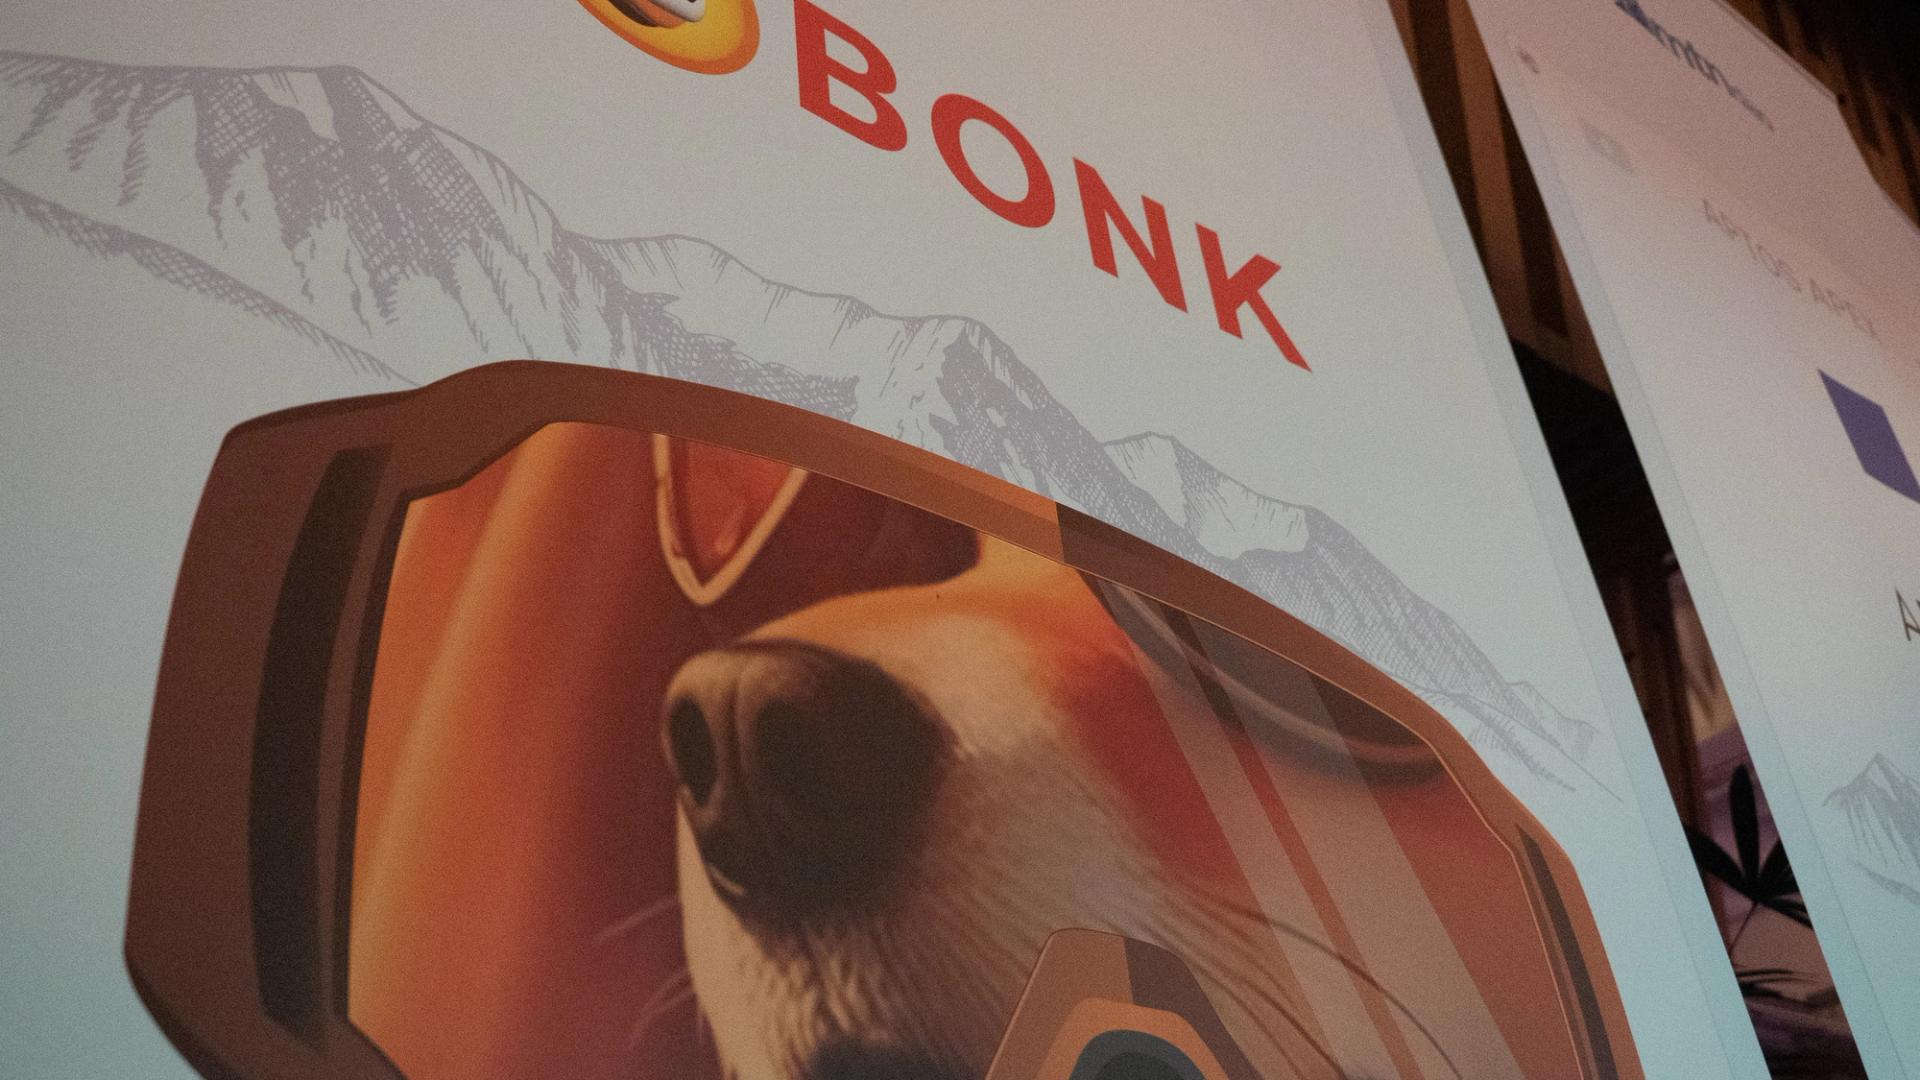
Over the weekend, Bonk.fun overtook Pump.fun, the popular Solana token issuer, to become the leading launchpad in the market, claiming over 55% market share. This milestone is bumping up demand for BONK, the Solana-based token at the center of its ecosystem.
New data show that Bonk.fun has facilitated over $540 million in volume across 175,000 launches, generating approximately $34 million in fees. That gives it a commanding 55.2% share of the meme launchpad market — ahead of Pump.fun’s 34.9% and $341 million in total volume.
Pump.fun had dominated the sector since its January 2024 debut, accumulating over $800 million in fees within two years.
Bonk.fun has flipped that lead in just two months, driven by deeper token incentives and faster platform traction and a BONK buy-back plan that has caught the eye of some early investors.
«The massive increase in Bonk.fun market share helps BONK through the aggressive market buy pressure it contributes to the BONK token,» shared widely-followed crypto investor theunipcs in a message to CoinDesk.
A key difference lies in Bonk.fun’s fee structure. 50% goes to buying then burning BONK, 8% goes to buying BONK for reserves, and the rest the platform keeps as revenue.
«50% of Bonk.fun fees goes towards buying and burning $BONK, and another 8% goes towards buying BONK for reserves. When you consider that Bonk.fun has generated over $1 million/day daily since it flipped Pump.fun, that’s at least $500,000/day in revenue-driven BONK buy and burn,» the trader added.
The biggest Bonk.fun-issued token is USELESS, an intrinsically useless token that jibes at its own lack of utility that has built a cult following in past week, helping propel it to over $100 million in market capitalization just weeks after going live.
If Bonk.fun continues to dominate at current pace, annualized BONK purchases could reach into the hundreds of millions, further tightening supply.
Meanwhile, other Solana-based launchpads, such as Believe (3.8% market share), Jup Studio (2.1%), and Moonshot (1.7%), remain far behind in both volume and engagement.
Read more: Pump.fun Aiming to Raise $1B Via Token Sale at $4B Valuation: Blockworks

Ethereum is in the midst of a paradox. Even as ether hit record highs in late August, decentralized finance (DeFi) activity on Ethereum’s layer-1 (L1) looks muted compared to its peak in late 2021. Fees collected on mainnet in August were just $44 million, a 44% drop from the prior month.
Meanwhile, layer-2 (L2) networks like Arbitrum and Base are booming, with $20 billion and $15 billion in total value locked (TVL) respectively.
This divergence raises a crucial question: are L2s cannibalizing Ethereum’s DeFi activity, or is the ecosystem evolving into a multi-layered financial architecture?
AJ Warner, the chief strategy officer of Offchain Labs, the developer firm behind layer-2 Arbitrum, argues that the metrics are more nuanced than just layer-2 DeFi chipping at the layer 1.
In an interview with CoinDesk, Warner said that focusing solely on TVL misses the point, and that Ethereum is increasingly functioning as crypto’s “global settlement layer,” a foundation for high-value issuance and institutional activity. Products like Franklin Templeton’s tokenized funds or BlackRock’s BUIDL product launch directly on Ethereum L1 — activity that isn’t fully captured in DeFi metrics but underscores Ethereum’s role as the bedrock of crypto finance.
Ethereum as a layer-1 blockchain is the secure but relatively slow and expensive base network. Layer-2s are scaling networks built on top of it, designed to handle transactions faster and at a fraction of the cost before ultimately settling back to Ethereum for security. That’s why they’ve become so appealing to traders and builders alike. Metrics like TVL, the amount of crypto deposited in DeFi protocols, highlight this shift, as activity is moved to L2s where lower fees and quicker confirmations make everyday DeFi far more practical.
Warner likens Ethereum’s place in the ecosystem to a wire transfer in traditional finance: trusted, secure and used for large-scale settlement. Everyday transactions, however, are migrating to L2s — the Venmos and PayPals of crypto.
“Ethereum was never going to be a monolithic blockchain with all the activity happening on it,” Warner told CoinDesk. Instead, it’s meant to anchor security while enabling rollups to execute faster, cheaper and more diverse applications.
Layer 2s, which have exploded over the last few years because they are seen as the faster and cheaper alternative to Ethereum, enable whole categories of DeFi that don’t function as well on mainnet. Fast-paced trading strategies, like arbitraging price differences between exchanges or running perpetual futures, don’t work well on Ethereum’s slower 12-second blocks. But on Arbitrum, where transactions finalize in under a second, those same strategies become possible, Warner explained. This is apparent, as Ethereum has had fewer than 50 million transactions over the last month, compared to Base’s 328 million transactions and Arbitrum’s 77 million transactions, according to L2Beat.
Builders also see L2s as an ideal testing ground. Alice Hou, a research analyst at Messari, pointed to innovations like Uniswap V4’s hooks, customizable features that can be iterated far more cheaply on L2s before going mainstream. For developers, quicker confirmations and lower costs are more than a convenience: they expand what’s possible.
“L2s provide a natural playground to test these kinds of innovations, and once a hook achieves breakout popularity, it could attract new types of users who engage with DeFi in ways that weren’t feasible on L1,” Hou said.
But the shift isn’t just about technology. Liquidity providers are responding to incentives. Hou said that data shows smaller liquidity providers increasingly prefer L2s where yield incentives and lower slippage amplify returns. Larger liquidity providers, however, still cluster on Ethereum, prioritizing security and depth of liquidity over bigger yields.
")
Interestingly, while L2s are capturing more activity, flagship DeFi protocols like Aave and Uniswap still lean heavily on mainnet. Aave has consistently kept about 90% of its TVL on Ethereum. With Uniswap however, there’s been an incremental shift towards L2 activity.
")
Another factor accelerating L2 adoption is user experience. Wallets, bridges and fiat on-ramps increasingly steer newcomers directly to L2s, Hou said. Ultimately, the data suggests the L1 vs. L2 debate isn’t zero-sum.
As of September 2025, about a third of L2 TVL still comes bridged from Ethereum, another third is natively minted, and the rest comes via external bridges.
“This mix shows that while Ethereum remains a key source of liquidity, L2s are also developing their own native ecosystems and attracting cross-chain assets,” Hou said.
Ethereum thus as a base layer appears to be cementing itself as the secure settlement engine for global finance, while rollups like Arbitrum and Base are emerging as execution layers for fast, cheap and creative DeFi applications.
“Most payments I make use something like Zelle or PayPal… but when I bought my home, I used a wire. That’s somewhat parallel to what’s happening between Ethereum layer one and layer twos,” Warner of Offchain Labs said.
Read more: Ethereum DeFi Lags Behind, Even as Ether Price Crossed Record Highs
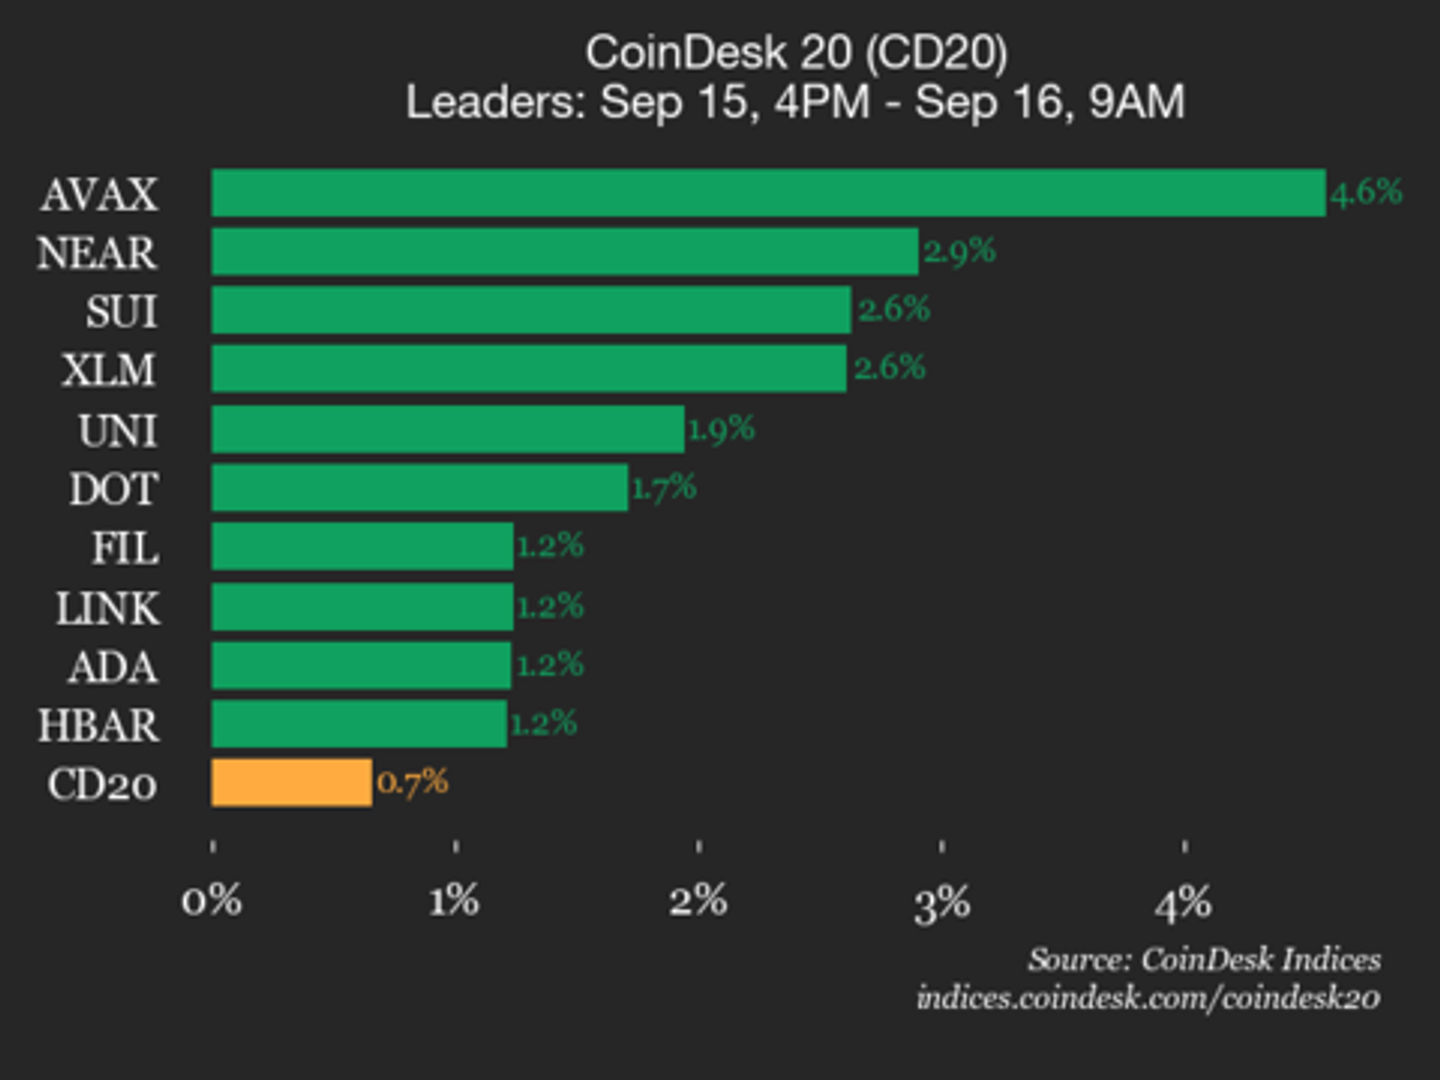
CoinDesk Indices presents its daily market update, highlighting the performance of leaders and laggards in the CoinDesk 20 Index.
The CoinDesk 20 is currently trading at 4267.12, up 0.7% (+27.81) since 4 p.m. ET on Monday.

Eighteen of 20 assets is trading higher.
Leaders: AVAX (+4.6%) and NEAR (+2.9%).
Laggards: AAVE (-0.9%) and BCH (-0.2%).
The CoinDesk 20 is a broad-based index traded on multiple platforms in several regions globally.
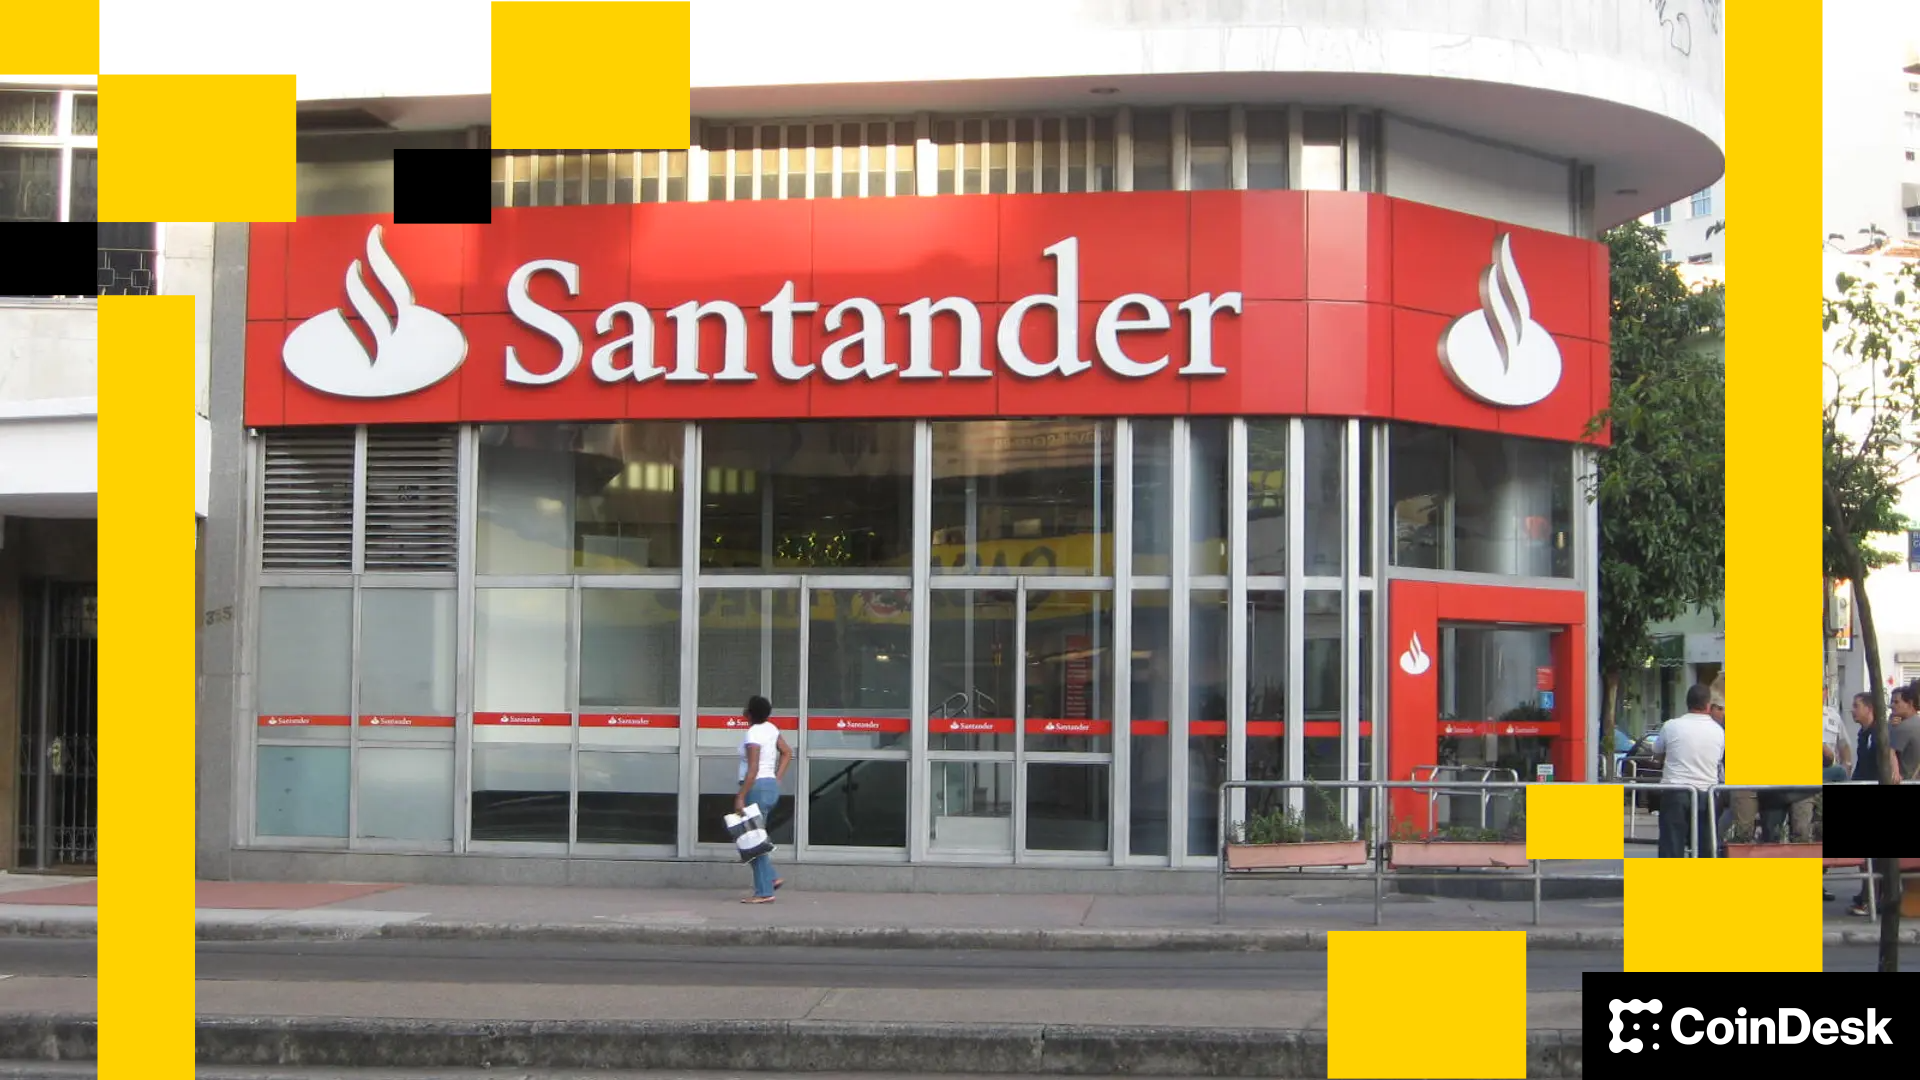
The digital banking arm of Spanish financial giant Santander Group, Openbank, opened cryptocurrency trading for customers in Germany, with plans to add its home market in the next few weeks.
The new service allows users to buy, sell and hold five popular cryptocurrencies: bitcoin (BTC), ether (ETH), litecoin (LTC), polygon (MATIC) and cardano (ADA), according to a press release. The cryptocurrencies are available alongside stocks, ETFs and investment funds.
Customers can trade without moving funds to an external platform, keeping all investments in one place under Santander’s umbrella, the bank said.
“By incorporating the main cryptocurrencies into our investment platform, we are responding to the demand of some of our customers,” said Coty de Monteverde, head of crypto at Grupo Santander.
The bank charges a 1.49% fee per transaction, with a 1 euro ($1.2) minimum, and does not include custody fees. The bank said it plans to add more cryptocurrencies and new features, such as crypto-to-crypto conversions, in coming months.
Santander Private Bank was back in 2023 making headlines when it started letting clients with accounts in Switzerland trade BTC and ETH. It selected crypto safekeeping technology firm Taurus for custody.


Is Ethereum’s DeFi Future on L2s? Liquidity, Innovation Say Perhaps Yes

CoinDesk 20 Performance Update: Avalanche (AVAX) Gains 4.6% as Index Moves Higher

Santander’s Openbank Starts Offering Crypto Trading in Germany, Spain Coming Soon
-

 Business11 месяцев ago
3 Ways to make your business presentation more relatable
-
Fashion11 месяцев ago
According to Dior Couture, this taboo fashion accessory is back
-
Entertainment11 месяцев ago
10 Artists who retired from music and made a comeback
-
Entertainment11 месяцев ago
\’Better Call Saul\’ has been renewed for a fourth season
-
Entertainment11 месяцев ago
New Season 8 Walking Dead trailer flashes forward in time
-
Business11 месяцев ago
15 Habits that could be hurting your business relationships
-
Entertainment11 месяцев ago
Meet Superman\’s grandfather in new trailer for Krypton
-
Entertainment11 месяцев ago
Disney\’s live-action Aladdin finally finds its stars